
IT teams know the stakes are high for system monitoring. It’s not an overstatement to say tracking the health, performance, and security of the many IT components throughout your environment is crucial if you hope to ensure the overall organization stays operational and secure. When businesses don’t invest in the right solutions for measuring system health, they can miss red flags and ultimately affect end users and cause losses in business productivity. In fact, the research firm Gartner found in 2014 that downtime could cost the average enterprise up to $5,600 per minute.
That’s why I’m an advocate for rigorous system monitoring—which means choosing the right system monitor. Yes, you can manually check system health on your individual workstation. But using tools to provide a real-time overview of hardware, servers, and applications is an absolute must if you’re managing more than one or two devices.
In this article, I explain the components and capabilities involved in the effective system monitoring as well as provide a list of recommended system monitors to help you find the one best for your organization. With so much at stake, I suggest trying out the suite of tools included in SolarWinds® Systems Management Bundle for a complete system monitoring solution. Click here to see my other choices for the best system monitoring tools on the market today.
Components of System Monitoring
Monitoring Server Health
Monitoring Applications and Services
Options for Manual System Health Monitoring
Advantages of System Monitoring Software
8 Best System Monitors
Choosing a System Monitoring Client
Components of System Monitoring
System monitoring is essentially about checking the operation of devices and applications across the IT infrastructure, including measuring traffic and activity between different network components. It can also include catching discrete occurrences or patterns within event logs signaling errors or security issues. These measurements must be recorded and displayed to be useful for admins.
At the most basic level, networks have devices or hardware, on top of which are various applications and services. End users tend to stay at the “top” level, interacting with software—they may naturally blame issues on the software they’re using, but slowdowns and errors could occur anywhere in the stack. To effectively monitor your system, you’ll want to have an inventory of components and an understanding of dependencies or relationships between various network elements.
Along with this kind of system overview or “map,” you should have a sense of how your system functions over time. System monitoring relies on specific measurements, or metrics, of system functioning, including uptime, operations, security, and performance. Metrics are values taken at specific points in time. Depending on your needs, measurement intervals for different metrics may vary from one second to five minutes or more.
It’s important to understand both average capacity and peak capacity as you track metrics, while a historical baseline helps to define “normal” resource use. For instance, if consumption is way above average compared to past patterns, you may want to investigate. You’ll also want to track configuration changes to see performance impact moving forward.
It’s possible to use custom metrics meaningful for your situation, but in most cases, admins rely on some foundational metrics typically built into monitoring tools. The following are a few of the many potential metrics you might draw from for an overall picture of system health:
- CPU usage: This helps you measure the load on a server’s processor. If CPU utilization is high, you may need to replace the hardware, so it can better manage all the services running on it. You can also redistribute the load to help avoid overutilization.
- Disk performance: Storage performance can affect your applications, so it helps to monitor queued input/output (I/O) and disk latency for a sense of how often the disk is busy. High disk queue length may be caused by a storage performance issue, indicating it’s time to change RAID type or add physical disks.
- Physical and virtual memory: By tracking physical memory, you can see where there’s the potential for bottlenecks, which indicates it’s necessary to add more RAM. Meanwhile, as virtual memory consumption goes up, more data moves to and from RAM, raising the chances of a bottleneck or swap file fragmentation happening.
Monitoring Server Health
When it comes to system health monitoring, servers are one of the most critical components for ensuring overall IT stability. If the server goes down, it doesn’t matter how well the other applications are functioning. For this reason, it makes sense to ensure best practices are in place for monitoring key server metrics, ideally for every type of network server—including application, client, FTP, mail, virtual, and web servers.
Typically, admins monitor server health through the following parameters:
- Server availability and uptime: Servers should be “up” most of the time—think 99% of the time. If you start to drop below that, it’s time to pay attention.
- Security: Tracking server security means keeping an eye on modifications, unauthorized access, and other security events (typically by scanning event logs).
- System performance: Do you have what you need in place to support server performance? This includes metrics like CPU utilization, sufficient RAM, hard drive space, and bandwidth.
- Application performance: Applications and services run on your servers, so it’s critical to understand how these processes are affecting performance and server load.
What does server health monitoring look like in action? Well, if you’re monitoring on-premises server hardware, you’ll be tasked with monitoring the status of features like the hard drive, power supply, temperature, array, and fan speed. These are a kind of “base layer” of functionality—if the device is overheating, it could throw everything else into disarray.
It’s also important to track usage metrics, like CPU usage, I/O, disk usage, and memory consumption. You’ll want a clear picture of user load, server capacity and availability, and any data loss. Monitoring remote servers is equally important, and although you won’t have to track hardware stats, you’ll want to pay attention to resource utilization, total traffic, uptime, and response time.
Monitoring Applications and Services
To ensure total system health, you need to have a deep view of your applications environment. Not only do end-users typically interact more closely with applications than with other network components, but businesses depend on applications to function. At the same time, services and applications can take up large amounts of bandwidth, tax server performance, and cause system errors. It’s important to monitor and analyze as many of your applications as possible. This means understanding application dependencies, including virtual and storage layers, as well as gaining insight into web and cloud apps.
Most organizations use at least a handful, if not dozens, of applications—and these applications need to perform. For instance, your business might rely on programs like Active Directory, Microsoft Office 365, SharePoint, SQL Server, and Skype for Business. Third-party applications like Oracle, Java, VMware, and Apache are common as well. For business-critical applications, you’ll want to track usage and availability, while managing high rates of traffic or requests. Monitoring should encompass user activity, historical growth, response time for database queries, and much more.
You’ll also want to track the applications you might think of like services, like cloud hosting services, virtualization, storage, remote desktop services, and update services. These are critical to a business function, and you need a way to “look under the hood” at regular intervals.
With the rise of cloud computing, you may need to monitor cloud-based apps or storage with KPIs like service availability and throughput. While your cloud provider may do their own health monitoring, you may wish to keep an eye on these web-hosted applications for more control and visibility. Moreover, many popular programs (including Adobe Creative Cloud and Microsoft Office 365) are now software-as-a-service apps. You’ll want to track security threats, test for functionality, and understand speed metrics.
Similarly, many companies use virtualization for workstations or servers to optimize their use of hardware. Virtualization “partitions” resources—sometimes isolating these systems from easy visibility. Meanwhile, you may end up dealing with virtual sprawl, with virtual machines scattered across your overall system. When implementing virtualization, it’s critical to track stats for the underlying hardware, hypervisor, and operating system. You’ll want to watch everything from capacity to wait time to ensure the virtual machine is running effectively, and helping with resource utilization, not dragging down system performance overall.
Options for Manual System Health Monitoring
Some at-home PC users and small business administrators may wish to test the waters themselves before investing in more extensive system monitoring software. If you’re looking for basic insights into a single machine, there are manual methods for analyzing system health. In fact, most operating systems offer some form of native system monitor. On a Windows machine, you should be able to use the Windows Task Manager, while Linux/Unix offers similar functionality through command-line tools.
Windows Task Manager is built to help with task, system, and startup management. Using Task Manager, admins can see how respective programs utilize CPU, memory, disk space, and network bandwidth. Should they be using an inordinate share of any storage or network medium, administrators can intervene as appropriate. Task Manager also allows admins to see currently running programs and logged-in users, forcibly quit unresponsive applications, and track usage and performance history.
Accessing Windows Task Manager is easy. If you’ve ever pressed CTRL + ALT + DEL on a Windows machine, you’ve been given the option to open the Task Manager (pressing CTRL + SHIFT + ESC also works). Task Manager provides an easy overview of the computer’s CPU, memory, disk, and network usage. You can drill down a bit more within the program to see:
- Currently running applications and processes, along with historical app resource use
- Graphs of CPU, memory, network, GPU, power usage, and disk usage
- Startup programs
- User accounts
- System services
Based on this information, you can take steps to troubleshoot the device and improve performance.
Task Manager can be great for understanding the resource usage of various processes. However, to avoid causing additional issues in your system function, end tasks only if you truly know what they’re doing—some running services may be critical background processes.
Within Linux/Unix, consider using the top command to run the built-in Linux performance monitoring tool. This command displays running, active processes in real time, including CPU usage, memory usage, cache size, buffer size, swap memory, and process identifier. Another command, vmstat, can display stats like virtual memory, disks, and I/O blocks (but you have to first install a sysstat package). Although Linux/Unix offers command options for analyzing your system, this device-by-device solution provides only basic monitoring functionality. While you can discover useful details, the process isn’t particularly user-friendly or scalable.
Windows Task Manager is built into your system and comes at no extra cost. On the other hand, it’s difficult to scale system health monitoring across your network if you’re going device by device. What’s more, Windows Task Manager requires you to do the digging—there’s no automated, centralized overview of device usage and availability. Unless you’re an individual at-home user, it’s far more effective to leverage designated system monitoring software.
Advantages of System Monitoring Software
When faced with these common system performance hurdles, administrators have a few options. In my opinion, the best route is to invest in IT system monitoring tools. While premium software isn’t cheap, in the long run it more than pays for itself by cutting down on costs. Crucially, it eliminates a good deal of unforeseen downtime, which can add up to hundreds of thousands of dollars in lost productivity, destroyed data, and damaged expensive equipment.
A good system monitor decreases the amount of time IT has to spend manually monitoring systems. A little system administration isn’t the end of the world on a personal computer, but working with an enterprise, it can quickly become overwhelming. When faced with an exponential number of nodes (personal and professional laptops, tablets, mobile phones, printers), system management can easily morph into a full-time job, diverting manpower from other crucial functions.
For this reason, many IT administrators find it better for the health of their decentralized system to automate and outsource comprehensive system management to SysAdmin monitoring tools. Such software can alleviate the stress of tracking down unresponsive devices, correlating events and logs, and combing through records to ascertain root causes. The more sophisticated—and most worthwhile—system monitors can even grant software permission to take automated action in response to certain emergency situations. For example, some tools can isolate a compromised device and force it offline when malware is detected, protecting the broader network until IT has a chance to fix the device in question.
For businesses dependent on functional tech—which describes just about every company—it’s critical to have the right tools to monitor key metrics across your IT system. Here are some of the top advantages to using a system monitor:
- Centralization: It’s much easier to view metrics for all managed devices and applications within one consolidated dashboard. You can more quickly pinpoint hotspots, glance over lists, and compare metrics (and potentially gain a historical baseline), easily gaining a clear picture of system health.
- Scalability: Even smaller organizations may find it onerous to check the health of various system components one by one. For larger organizations, it’s nearly impossible. A software solution incorporates all servers and applications as your business grows.
- Alerts: This is arguably what makes a good system monitor truly worth the cost. Automated alerts, based on built-in or custom thresholds, can flag issues before they affect end users and send notifications right to whoever is in charge. No more missing issues until it’s too late.
- Reports: Having overviews to outline key metrics at particular moments in time is useful for techs, especially for planning purposes. It’s also sometimes critical for compliance.
- Automated responses: As with alerts, automated responses can be hugely helpful to overloaded admins. Some system monitoring software can respond when certain conditions are met and perform basic actions like ending and restarting a service or application.
8 Best System Monitors
In addition to helping you catch little issues before they get bigger, these SysAdmin monitoring tools can provide better visibility across your network and guide you in better managing the IT infrastructure moving forward to avoid damage to business functioning down the line. Here’s my roundup of the best system monitoring software on the market.
My frontrunner for the best system health monitoring solution on the market is the Systems Management Bundle from SolarWinds. This bundled software is the superior choice for combining storage resource management, web and SaaS performance monitoring, server and application tracking, and virtualization tools to visualize and observe virtual infrastructure.
-
SolarWinds Systems Management Bundle (Free Trial)
The Systems Management Bundle brings together four must-have tools from SolarWinds built to serve the needs of an IT admin managing a complex or enterprise-scale network
The bundle includes Server & Application Monitor (SAM), the best Windows system monitor, hands down. SAM provides more than 1,200 templates for monitoring any environment, whether it be private, public, or a hybrid cloud. It tracks servers, applications, operating systems, and infrastructure both on-premises and remotely, making it possible to capture a screenshot of an entire network in real time. This Windows and Linux tool connects to servers and apps across your system, whether on-premises or in the cloud, so you get a truly complete view of IT performance and health.
No software goes further than SAM in analyzing holistic system health. Its Windows Server Monitoring and Management tool is built to forecast capacity, suggest methods for redistributing server loads, and detect hardware failures. Using all its collected information across a network, it can then stack graphical depictions of system component performance to aid IT admins in correlating and analyzing data. Often, this juxtaposition can help zero in on the underlying problem driving system dysfunction.
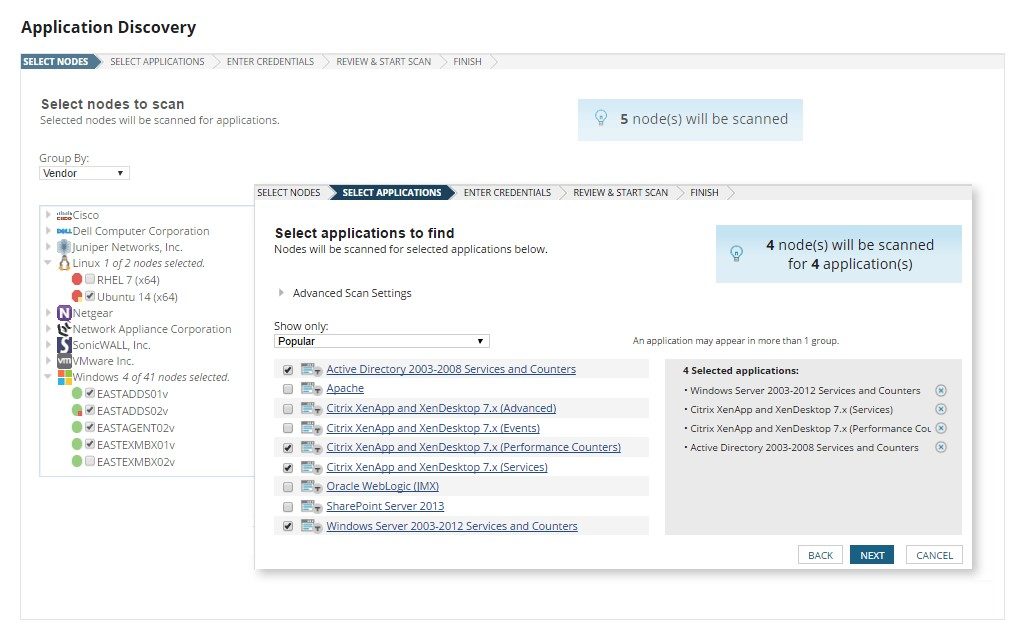
In addition to Server & Application Monitor, the Systems Management Bundle includes Storage Resource Monitor (SRM). SRM can help resolve storage problems in SAN and NAS environments. Robust autodiscovery capabilities enable the bundle to detect applications across system nodes in minutes, streamlining implementation.
With the inclusion of Virtualization Manager (for insights into all things virtual) and Web Performance Monitor (for insights into all things web) to round out its total system monitoring capabilities, these four tools included in the Systems Management Bundle have everything you need to deliver clear visibility across your systems environment—from applications to servers, virtualized infrastructure, and storage systems—to help you quickly and more easily diagnose and troubleshoot performance problems than ever before. The integrated AppStack™ dashboard maps infrastructural dependencies, facilitating troubleshooting from the source, while intelligent application dependency visualization illuminates the relationships between apps and servers, delineating networking problems that could hinder the performance of business-critical programs.
SolarWinds offers a fully functional 30-day free trial of all the solutions included in the Systems Management Bundle, you can see if all, one, or some of the tools meet your needs, since each product featured in the bundle is also available as a standalone solution.
SolarWinds Server Health Monitor is a system monitoring software free download offering a detailed look at the health of up to five servers. Another high-performing tool, it gauges all fundamental aspects of system hardware, including fan speed, operating temperature, system power supply, CPU usage, and battery status.
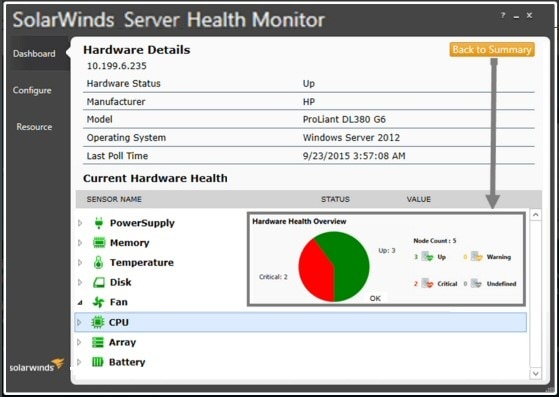
Server Health Monitor supports different server manufacturers (including Dell, HP, IBM, and VMware) and network management models (SNMP, WMI, and CIM). This makes it possible to get granular real-time data about your system, regardless of your network configuration.
Best of all, this free tool can roll its data into the Systems Management Bundle, which means you’ll avoid investing in redundant software. If you decide to expand your monitoring and management capabilities, you can easily take all the data and functions of Server Health Monitor with you.
-
Nagios XI (Free Trial)
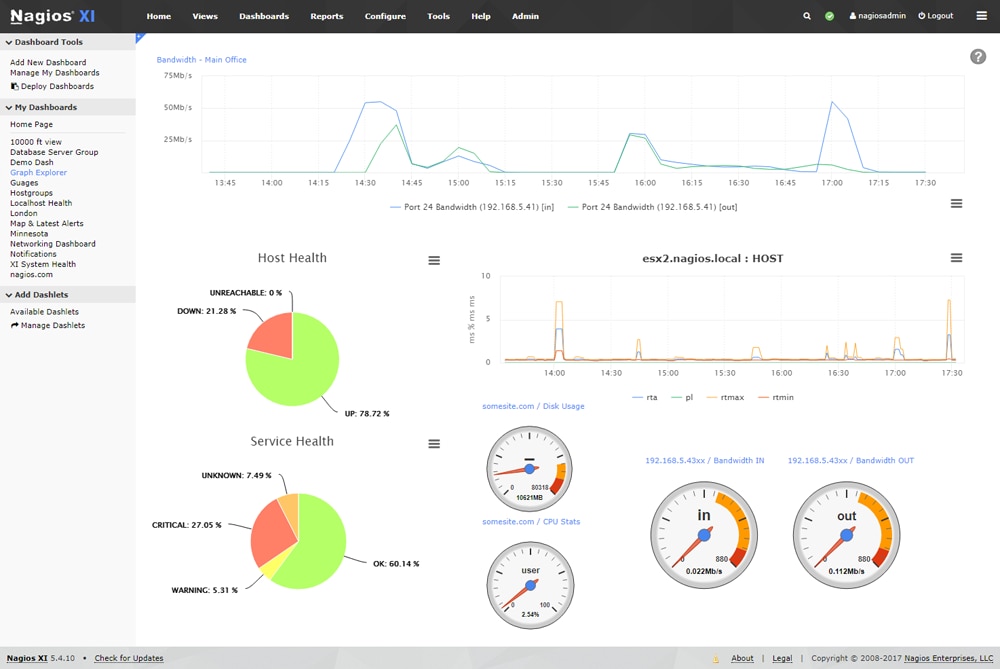
Nagios infrastructure monitoring comes in two variants: Nagios Core and Nagios XI. Generally considered to have a less-than-ideal interface, Nagios Core is underwhelming. As an open-source tool, however, it offers some valuable baseline capabilities: event scheduling, processing, and alert monitoring.
The premium version is the Nagios XI system monitor, which offers a bevy of upgraded features: a graphical interface to consolidate application, server, and network monitoring; remotely assisted program deployment; compatibility with third-party add-ons for expanded functionality; and graphical expressions of performance trends and capacity projections.
Nagios software has cultivated a large cybercommunity committed to developing it and extending its capabilities with integrable plug-ins. Its most notable disadvantages involve its clunkiness: it can be unintuitive, and it doesn’t always meet the user halfway (for example, it doesn’t have device autodiscovery). In contrast, a comprehensive package like the SolarWinds Systems Management Bundle is complete as-is.
-
vRealize Hyperic (Free Trial)
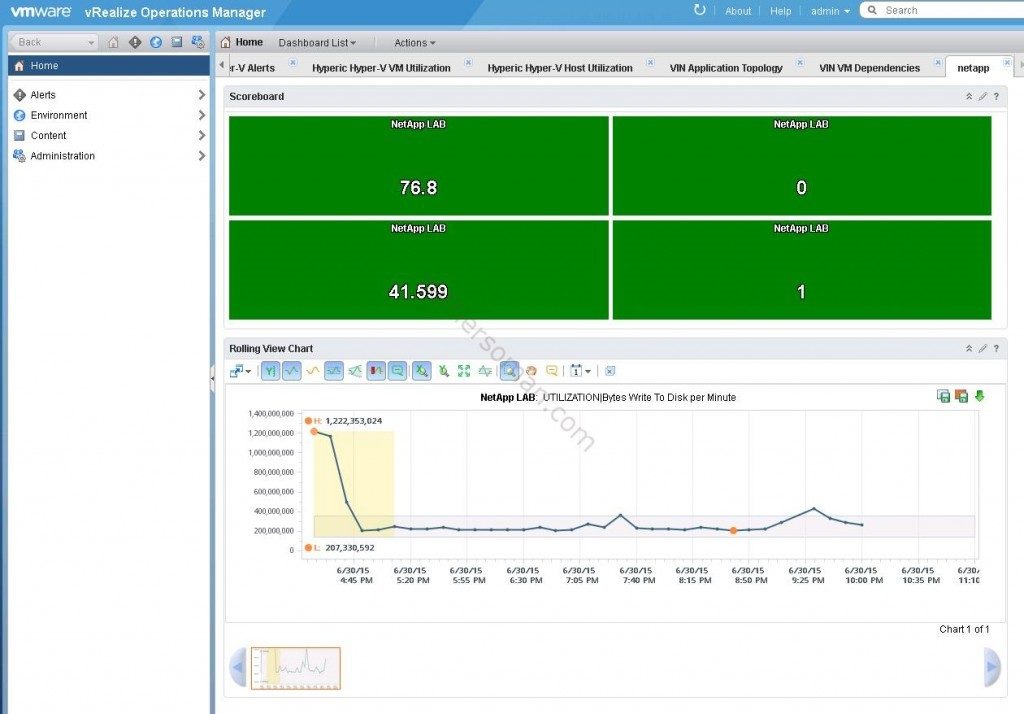
VMware’s vRealize Hyperic monitors infrastructure, operating systems, middleware, and applications across environments from a single convenient dashboard. While not distinct from SolarWinds in its breadth, it’s another good option when it comes to system monitoring at scale. Compatible with over 70 application types, it can track up to 50,000 metrics while still preventing notification fatigue; admins can configure and personalize alert settings, ensuring the right employees see pertinent alarms.
This system monitor is ideal for developers, because its API allows users to consolidate functions and use them in the creation of custom plug-ins. The program is considered a fast-running remote system monitoring software, although its visualizations could be more personalized.
-
Paessler PRTG Network Monitor (Free Trial)
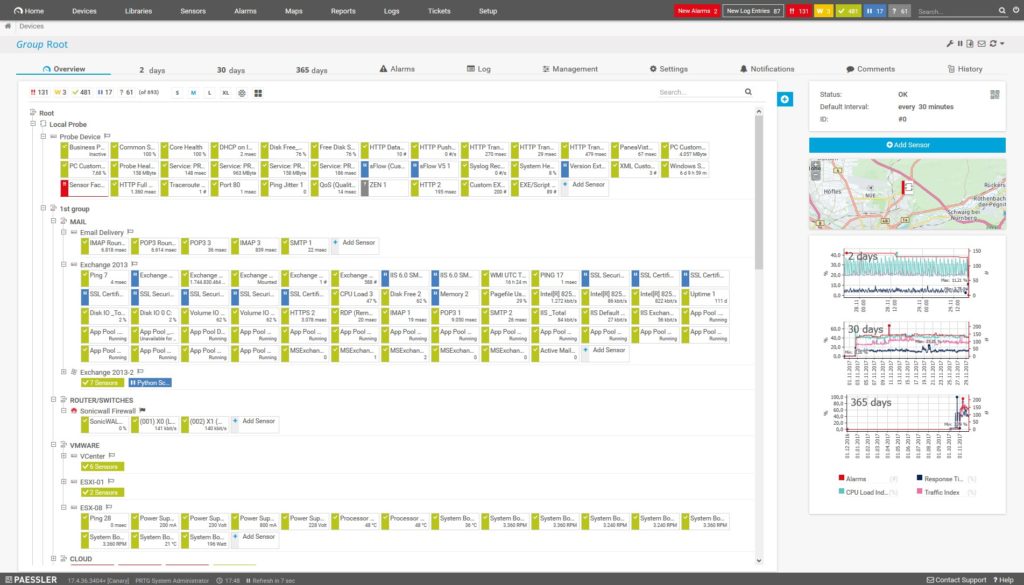
Paessler PRTG Network Monitor comes in a limited free version as well as a 30-day free trial of the fully functional premium variant. It has powerful and granular monitoring capabilities, including the ability to track a specific dataset within a database using configurable sensors and SQL queries. In terms of resource storage, it can monitor not just application performance and cloud computing services, but also the amount of bandwidth each device and app takes up on the network—helpful in solving bottlenecks during peak traffic hours.
The tool’s network maps and graphs sourced from real-time status data are informative and more visually digestible than those on less UI-oriented clients. Another advantageous feature is its failover tolerant monitoring, which uses node clusters and designated masters to ensure monitoring never suffers downtime.
Although the Paessler model of pricing by node can grow expensive in enterprise environments, PRTG is entirely free for up to 100 sensors, making it a reasonable option for small businesses.
-
MMSoft Pulseway (Free Trial)
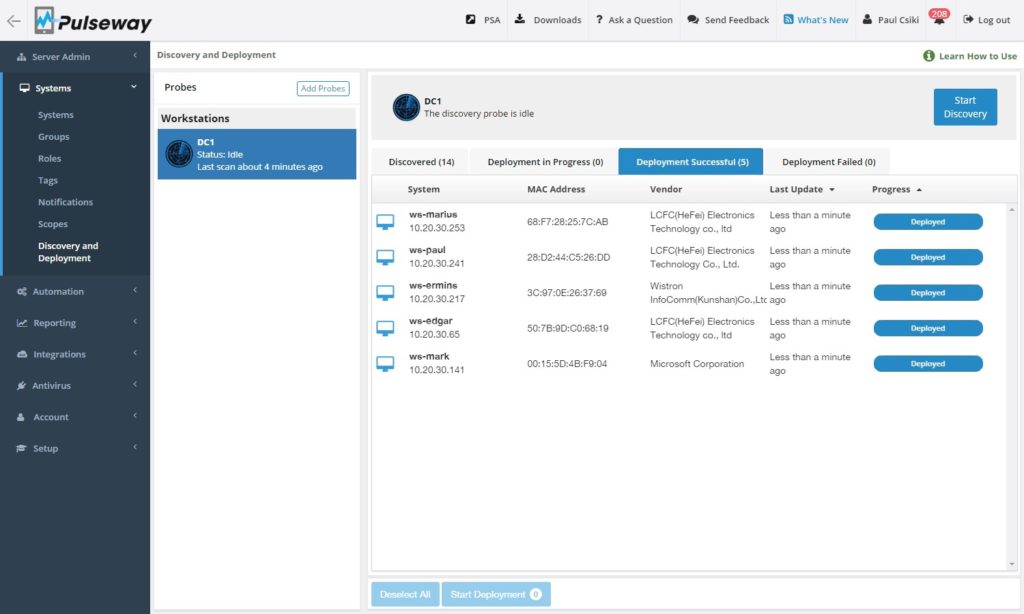
The MMSoft suite of system monitoring software allows IT admins to quickly deploy remote monitoring tools. Quickly installed on Windows, Linux, or Mac systems, MMSoft Pulseway IT management software works across computers, while its API can bring monitoring functionalities to any application.
The software’s monitoring and management capabilities might not set it apart, per se. In many ways, it handles what other management programs do—it reports device status, tracks resource and storage usage, logs active users, and monitors server software like Active Directory and SQL Server. However, it’s extremely useful for two reasons: it bundles with patch management, so business-critical software automatically updates, and it’s supremely convenient. Pulseway runs across platforms, so you aren’t forfeiting control even if you have to step away from your desktop. In fact, the mobile version allows users to complete functionality on the go: from their phones, admins can input terminal commands, adjust running processes, react to urgent situations, and more.
-
ManageEngine OpManager (Free Trial)
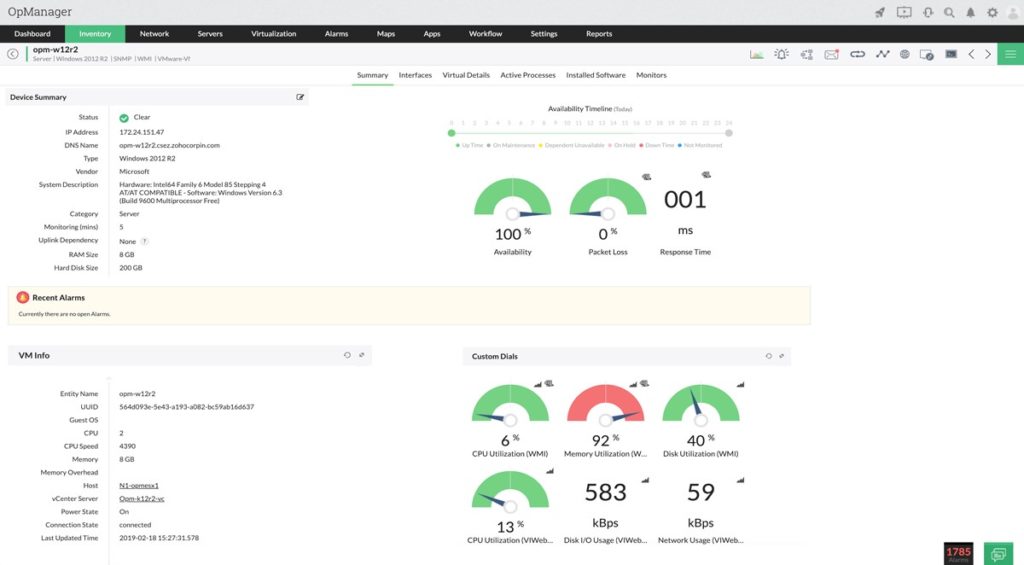
ManageEngine OpManager system monitor fulfills many of the standard SysAdmin requisites discussed above: it allows for configurable alarm settings; it monitors hardware resource utilization and the performance of virtualization environments, and it offers a full spate of metrics (it’s equipped with more than 2,000 network performance monitors).
Still, in a sea of system monitoring tools, where one software can have trouble distinguishing itself from another, OpManager’s features merit a closer look. With multi-level thresholds, it makes it easy to customize alerts of varying priority levels for important performance monitors. Further, the tool is solutions-oriented and detailed when it comes to networking. It monitors jitter, RTT, and packet loss, and it visualizes communications hop-by-hop to identify the site of data packet loss and rectify latency, high traffic, or misconfiguration.
While some MSPs have voiced frustration that OpManager doesn’t currently support third-party data migration, it remains a solid option for IT departments managing a decentralized system.
Choosing a System Monitoring Client
Every system monitor balances a distinct mix of capabilities, and the needs of your IT department depend on the organization it serves. The size of your organization, the complexity and hybridity of the environment, and the security standards of the operation are but a few considerations to determine which software best suits your goals.
However, all things being equal, it’s safe to say SolarWinds System Management Bundle offers the most comprehensive system monitoring capabilities within a single platform with an unmatched and easy-to-use graphical user interface. Whether you’re administering a small business or overseeing a large enterprise, you can tell a difference in how the scalable system monitoring tools within the bundle’s extensive yet select toolbox were designed to work in tandem to collect and analyze data, preempt problems, and support high system performance.