
Issues and delays caused by database performance networks are a time and money drain IT teams can’t afford. With so many performance risk factors at play (memory usage, indexing, etc.), it can be hard to determine where, when, and why a problem is occurring. Implementing SQL tools focused on performance, monitoring, and management is a critical step in maintaining the health of your system.
This post will help you take control of your database by discussing some useful database monitoring tools, but first, we’ll look at some of the voids (problems) filled by the following options. With so many SQL server performance tools out there, it can be hard to sift through the noise. My favorite? SolarWinds Database Performance Analyzer. This software offers a full suite of services and gets to the core of your performance issues, allowing you to address current pain points while preventing these issues in the future.
Common SQL Server Pain Points
An efficiently-running SQL server is a critical IT component for many SMBs and enterprises. If your application takes more than a few seconds to respond, it might as well be down completely. I’ve found in most cases, application performance problems are related to the database, and it takes SQL tools to really drill down and find out what’s going on. The last thing you want is to spend all your hours on diagnosis and tuning. The right SQL monitoring tools should help you check on these common server issues in a much more streamlined way:
- Insufficient Indexing: There are many ways to index and, while there is no one right way, poor index design will directly impact the speed of queries. Index fragmentation is another pain point. When data is modified in any way, the indexing becomes fragmented, impacting the efficiency of your database, and if you don’t stay on top of this fragmentation, it can quickly lead to slowdowns.
- Deadlocks: A deadlock is when at least two processes waiting on the same resource wind up each waiting for the other one to be complete before moving forward. This brings both processes to a halt. It’s important to quickly diagnose deadlocks and understand what happened to the failed processes, so you can maintain your data integrity and avoid these extended wait times.
- Memory Usage: Memory usage directly impacts the pace of your server. Poorly written queries and large tables are leeches when it comes to memory space. Adding more memory to speed up SQL server performance is only a band-aid for the problem and adding extra resources can add expense. Instead, you’ll want to identify which queries and tables are responsible for the slowdown, so you can address the problem at its core.
- Security Breaches: Hackers are more cunning than ever and managing the security of SQL servers has become especially challenging. Once a hacker enters your database, time is of the essence. If an anomaly can signal a security concern, custom scripts with an SQL monitoring tool might be able to help identify and catch it.
Luckily, there are dozens of SQL server tools to help you monitor and protect the health and wellbeing of your database. These SQL server performance tools offer bird’s-eye view dashboards, real-time alerts, and custom reports. The best thing about database performance analyzers? You don’t have to be a database expert to use them. The following list explains some of the top options on the market today.

Database Performance Analyzer
Of all the SQL server performance tuning tools out there, SolarWinds Database Performance Analyzer (DPA) is my favorite. The software’s user-friendly interface, 24/7 real-time monitoring, and customizable alert system allow you to quickly identify when performance issues arise. With DPA, you can optimize databases on AWS, Azure, VMware, and more—the agentless architecture makes scaling (and the development process) easier.
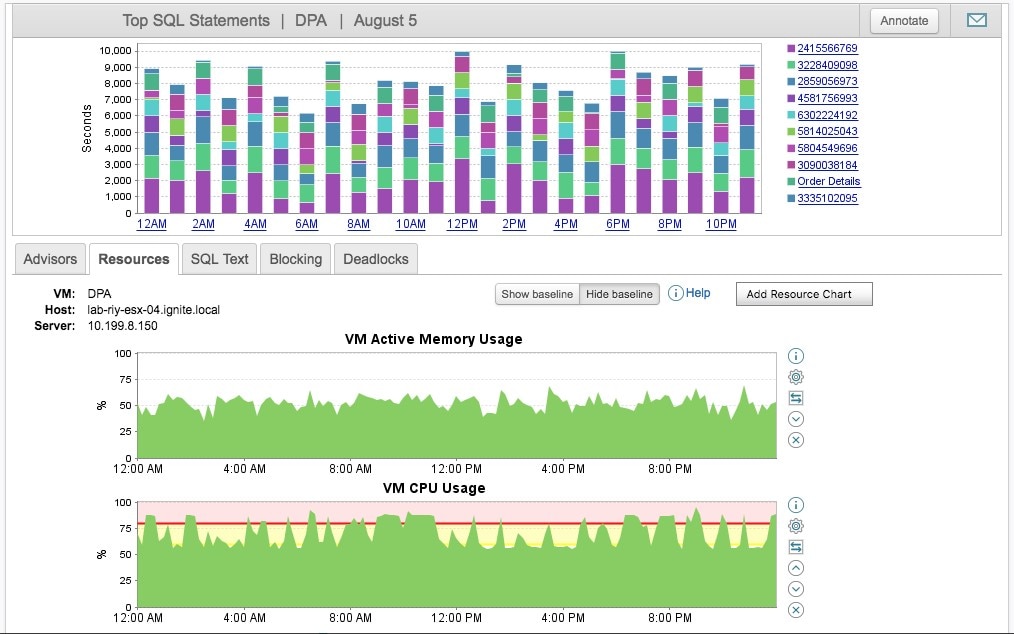
But what really makes Database Performance Analyzer stand out is it doesn’t just show you where bottlenecks are happening. It also correlates activity, wait types, SQL statements, memory usage, and other dimensions to pinpoint their root cause. Their “Response Time Analysis” feature gives you precise, easily comprehensible insights into slowdowns. The software allows you to compare historic data to better identify anomalies and prevent them from reoccurring. The level of full visibility offered here is great for large companies, where database administrators, developers, and engineers must work together to solve problems.
For departments looking to get serious about their SQL performance monitoring, SolarWinds DPA is the way to go. Here are some other notable features:
- Keep everyone from DBAs to operational managers on the same page with a web interface to dashboards
- Uses AI to detect anomalies and keep the database running at peak performance levels
- Pinpoint problems faster with blockage and deadlock analysis
SolarWinds® SQL Sentry
SQL Sentry is a SQL performance tool built to help you quickly find and fix database performance problems and prevent future issues that could otherwise delay delivery or bring business productivity to a halt.
By helping you identify long-running and high-impact queries, SQL Sentry can help you can resolve performance problems faster with the following features:
- Top SQL View – Identify high-impact queries to more easily pinpoint and fix performance bottlenecks
- SQL Sentry Portal – See actionable performance metrics for monitored SQL Server, Azure SQL, and Windows targets in the same interface
- Plan Explorer – Perform query stat analysis, plan recosting, and guided index optimization
- Event Calendar – Stay up to date using an integrated, customizable Outlook-style calendar to track important SQL Server and Windows events
A free 14-day trial of SQL Sentry is available to download.
Idera SQL Diagnostic Manager
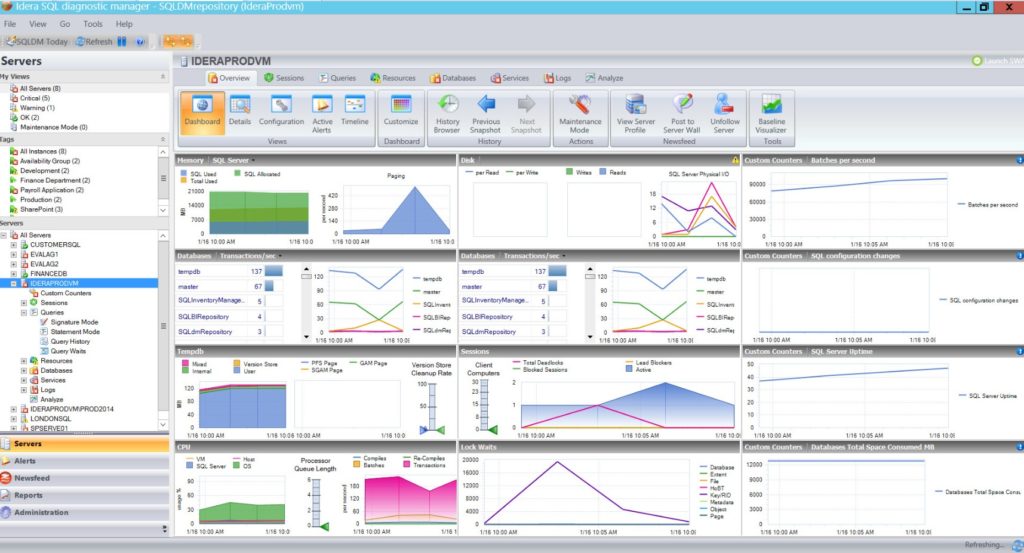
Idera SQL Diagnostic Manager is another popular database monitoring solution on the market. What makes Idera stand out in the crowd is its diversity—it’s designed to monitor databases in both physical and virtual environments. It also reports on a range of metrics, including CPU, memory, network usage, and hard disk usage and space.
In an era where attention spans are fleeting, and everyone is always on the run, users appreciate Idera’s intuitive web-based interface and mobile app. One thing to note—not every function is capable on your mobile phone, but some of the big ones are, including running queries, starting and stopping jobs, and killing processes.
Overall, Idera’s software offers a fairly easy way to hit the ground running and get a nice mix of metrics. Just be warned—it might not give you the kind of in-depth look into performance issues other software can.
Notable features of Idera’s SQL Diagnostic Manager include the following:
- Visualize the queries slowing down your database’s performance
- Configure notifications to key actors when events happen to the database
- Get expert advice for resolving common database errors, making for easy management
SQL Power Tools
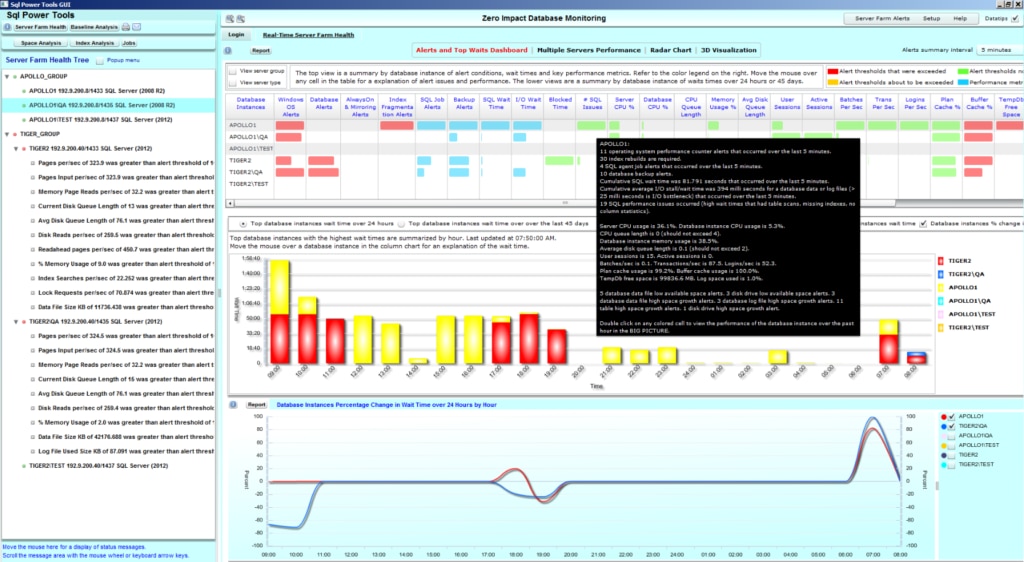
SQL Power Tools started gaining traction in 2000 as a “must-have” tool for SQL server database. It’s known for its ability to identify threats through behavioral analysis efforts, a big plus in a world full of cybersecurity scares.
The software is also big on touting its lightweight monitoring abilities, meaning it requires barely any effort from IT professionals to install and maintain, and involves little to no overhead. This tool relies on making use of the existing information within the IT infrastructure. Think of this as the budget airline of the SQL server monitoring tools out there. You’re going to get the bare minimum, but it will get you where you need to go in terms of affordable, solid monitoring results.
It provides three tiers of database monitoring, with features like:
- SQL Agentless Monitoring—Keeps an eye on your database (or farm) performance from mobile and tablet apps
- Zero-Impact SQL Capture—An omniscient database sniffer that provides around-the-clock analysis of your SQL database and queries running
- Database Cyber Security Guard—Shuts down potential hacking attempts to your SQL database
Paessler PRTG Network Monitor
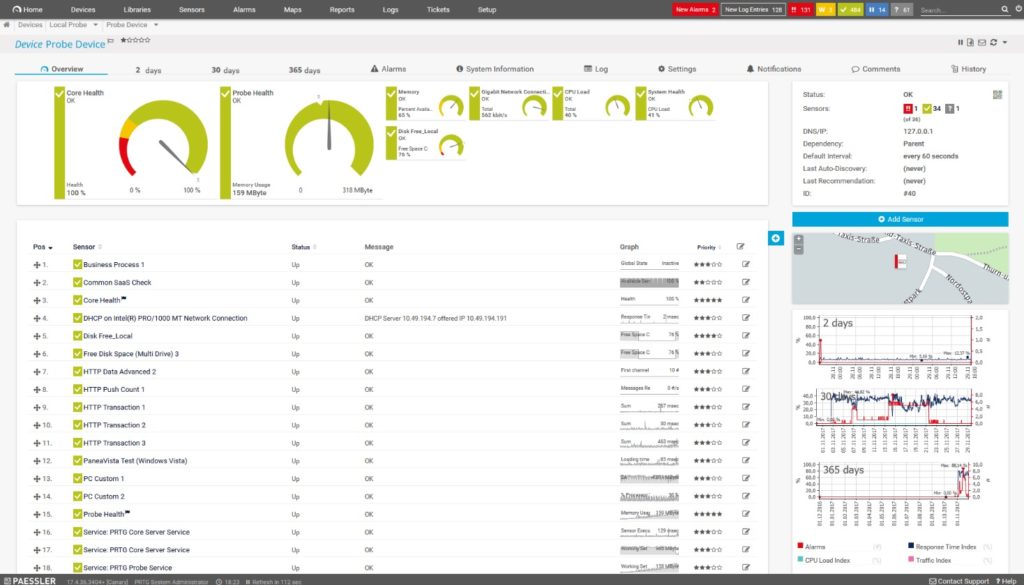
Paessler is your perfect combo package. Decent SQL monitoring? Check. Strong network monitoring capabilities? Check.
Even though it’s primarily a network monitoring tool, it has the ability to monitor the most common databases out there—Microsoft SQL, MySQL, Oracle SQL, etc.—and see how they perform under pressure.
Paessler is perfect for those who value the importance of SQL monitoring tools, but don’t have the budget to back up some of the more robust systems. With their scalable pricing structure, they make it easy to find something that works for your organization’s wallet.
Notable features include:
- You can access information about your database’s performance across all your devices thanks to their desktop and mobile applications
- You can schedule reports and keep project leaders up to detail automatically with notifications
- Cluster failover handling is automated, allowing for a more robust system with fewer outages
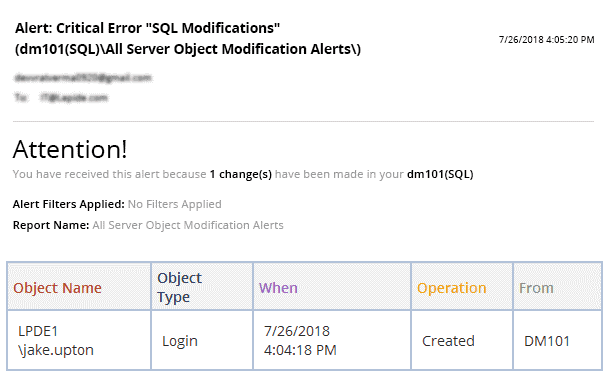
Lepide SQL Server Auditing
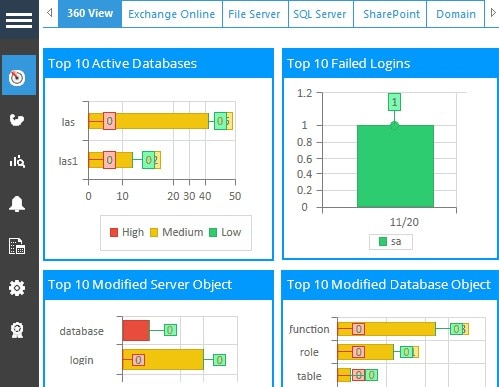
Lepide is a fan favorite for many, and for good reason. Among its suite of services is a SQL monitoring tool often recognized for its ability to protect data. One of the ways they do this is through a trend analyzer designed to identify when a change occurs within the database and who exactly made the change. With their real-time alerts, you’ll get this update instantly and be able to act if something’s awry. This software also has an easy-to-read dashboard that puts your databases into a hierarchical format.
Features include:
- Real-time alerts of database security flags reduce the time it takes for DBAs to figure out threats
- Enhanced SQL server change audits give a good map of every event in a database
- A mobile app—while it doesn’t have all the bells and whistles of the main dashboard, it provides a live feed of activity
Overall, Lepide is a strong choice for those looking to protect against attackers. For those looking to more comprehensively understand system issues, other software may offer more complete packages.
Redgate SQL Monitor
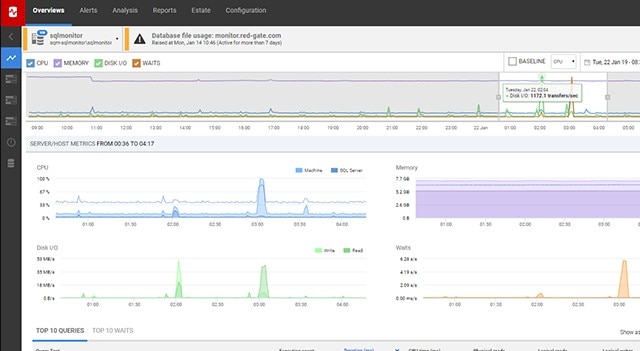
Redgate SQL is another comprehensive offering out there. It provides a deep level of insight and live tracking, so you know what’s going on. Redgate SQL is also known for their proactive development cycle—they’re constantly adding new updates and patches to ensure a highly functioning product.
Many users love that the software comes with 40 pre-configured, customizable alerts. This helps you get up and running quickly. What users don’t love so much is the interface. Despite its bold visuals, many find the dashboard tricky to understand.
Some interesting capabilities of Redgate SQL Monitor include:
- Hybrid database environment monitoring—the same dashboard can monitor data in the cloud and on-premises on the same dashboard
- Timed queries allow you to optimize database performance by uprooting slow ones quickly
Customized reports can be exported to document format
ManageEngine SQL Server Management
This is part of the overall ManageEngine Applications Manager solution, which is an integrated, comprehensive software for tracking performance across servers, applications, databases, and more. Larger businesses may find this range useful. The SQL Server Management system helps monitor and manage SQL database performance with graphs, charts, and is generally intuitive to use. It offers some performance parameters to start, although you’ll want to set your own threshold limits for alerts. While this is a solid tool, some find the platform tricky to customize.
You can enjoy the following features when using ManageEngine SQL Server Management:
- Strong resource usage tracking across multiple instances
- Real-time session monitoring experience
Alerts for when resource utilization levels reach certain thresholds, allowing you to take decisive action in time
Don’t Use SQL? Another Server Performance Monitoring Tool to Consider
SolarWinds Database Performance Monitor
With so many server performance tools out there, it can be hard to sift through the noise, especially when you’re searching for a comprehensive tool to support open-source and NoSQL monitoring. My current favorite that meets this requirement is SolarWinds Database Performance Monitor. This software offers a full suite of services and helps you get to the core of your performance issues, allowing you to address current pain points while preventing these issues in the future.

Some features of SolarWinds DPM include:
- Access to your database’s health status in detail around the clock
- Database monitoring insights to troubleshoot outages and plan for future occurrences
- Based on a scalable SaaS model and supports others NoSQL databases (including MySQL)
Top Choice for SQL Performance Management
There are many SQL management tools to choose from, but if you’re just looking for a reliable, cost-effective option at the SMB or enterprise level, I suggest starting with SolarWinds DPA. See if it offers what you need and experience the benefits of good SQL server performance management. Remember, slow systems and hours wasted on issue detection don’t have to be the norm. The right SQL tools will allow you to quickly and easily address database performance issues.