
SNMP, short for Simple Network Management Protocol, is a widely used protocol and an essential piece of any network management strategy. IT administrators use SNMP monitoring to detect and manage devices, gain insights into performance and availability, and ensure the health of their network. In this guide, I’ll break down everything you need to know about SNMP monitoring, such as what SNMP is, its major components, how it’s used, and how to install it. I also provide a list of the best SNMP monitoring tools currently available on the market ranked by features, including an in-depth review of my top pick: SolarWinds® Network Performance Monitor.
What Is SNMP?
What Is SNMP Used For?
SNMP Versions
Key Components of SNMP Network Monitoring
How Does SNMP Work?
Tools for SNMP Monitoring
Choosing the Best SNMP Monitoring Tool
What Is SNMP?
SNMP is an application-layer protocol for the exchange of information between network devices. SNMP is not a product, but a set of guidelines anyone can access. It’s defined by the Internet Architecture Board and is part of the TCP/IP (Transmission Control Protocol/Internet Protocol) suite. The SNMP definition is managed and maintained by the Internet Engineering Task Force (IETF) and can be downloaded from their website for free.
SNMP is one of the most common protocols for managing and monitoring network components. It has complex but extremely useful functionalities, allowing network administrators to get network devices to communicate with each other regardless of the type of hardware used or the software they run. Without it, network management tools and programs wouldn’t be able to do their jobs. They wouldn’t be able to monitor performance, recognize devices, maintain a record of network changes, or gather real-time data on device statuses.
SNMP is supported on an impressive array of hardware, including wireless access points, routers, switches, gateways, scanners, printers, and even IoT devices. Beyond SNMP hardware monitoring, the protocol can be used to monitor services such as DHCP. SNMP agents are featured on the operating systems of devices you purchase, enabling activities from SNMP switch monitoring to wider SNMP network management.
To account for differences in device hardware or software, SNMP serves as a shared language, meaning devices can communicate within a single, multi-vendor environment. This functionality is applicable to local area networks and wide area networks.
What Is SNMP Used For?
SNMP can be used in any sized network, but it’s best for larger networks, where its benefits are most obvious. With SNMP, administrators of large networks don’t need to waste valuable time and resources manually logging into hundreds, or potentially thousands, of nodes. Combined with a network management system, SNMP lets you view, monitor, and manage the nodes via one interface. This interface usually has batch command and automatic alert functionalities, stripping away the need for grueling, manual tasks.
SNMP Versions
At this time, three SNMP versions have been developed. These are labeled by the IETF with a Request for Comments (RFC) number. The versions are outlined below.
- RFC 1157: This is a refined version of the first SNMP definition, commonly referred to as SNMPv1. Due to its longevity—it’s been around since 1988—this is the version with the most implementations.
- RFC 1901: This second version features improved error-handling functionalities. It evolved from the 1993 definition SNMPv2 and as such is known as SNMPv2c. It’s the most common variant of SNMPv2, the key difference being that it adopts a community-based authentication mode. A user-based authentication model, called SNMPv2u, is available, but isn’t used as often.
- RFC 3410: This is the most recent version of SNMP. Called SNMPv3, it boasts advanced security and enhanced privacy utilities. These extra features make a big difference in terms of overall functionality and usefulness, so network administrators should prioritize this version. SNMPv3 has user-based authentication and can use transport layer protocols—such as SSH and TLS—to establish message encryption.
Though it’s the best of the SNMP versions, SNMPv3 comes with some issues. The main one involves compatibility, which all network managers come up against, no matter their approach. New versions of a protocol, and migrating from an older version, can be a tricky business. In the case of SNMPv3, it defines access levels per user, rather than per device, which isn’t especially supportive or backward compatible with any devices running prior protocol iterations.
Fortunately, this doesn’t need to be too disruptive, as you can install a basic translator to make your devices compatible with SNMPv3. The translator encrypts and converts incoming traps, or alert messages, to SNMPv3 standard.
Though this solves one problem, it creates another. The messages sent through the translator, a remote terminal unit, aren’t secure, and if you have multiple sites, you’ll need a minimum of one translator for each of them.
Key Components of SNMP Network Monitoring
Before we look at how to use SNMP to monitor network activity, let’s look at the key components of its architecture. The foundation of an SNMP network comprises the following essential components:
- Managed devices
- SNMP agents
- Network management system
- SNMP manager
- Management information base
- SNMP messages
I’ll cover each of these in depth below.
Managed Devices
SNMP monitoring applies to network devices, including but not limited to routers, servers, workstations, printers, and switches.
SNMP Agents
Managed devices feature SNMP agents—when enabled, this software will undertake continual monitoring of device status and relay information to the network management system.
The SNMP agent is installed on a device and communicates with an external SNMP manager. When the agent is enabled, it maintains the device’s management information base and ensures the SNMP manager can access it when a query is received.
Agents have several key functionalities. These include collecting management information about the local environment, signaling an event to the manager, storing and retrieving management data, and acting as a proxy in the case of non-SNMP management network nodes.
Network Management System
To control SNMP, you must have a network management system, or NMS, which can be installed on any computer on the network. The NMS navigates and manages the system, compiling, storing, and requesting status information; the SNMP software agents respond to its requests. These agents and NMS communicate via the SNMP common language, which can provide key information on configuration changes and statuses.
SNMP Manager
Within the NMS, the SNMP manager is responsible for establishing communications with the SNMP agents. This reduces the need for the network administrator to communicate directly with each individual device. In large networks, there could be hundreds or even thousands of devices, so this saves time.
The key functions of the SNMP management tool include querying agents, getting replies from agents, establishing variables in agents, and recognizing asynchronous events. The SNMP standard lets you have more than one SNMP manager, though their responsibilities may overlap at times.
Management Information Base
The management information base (MIB) is maintained by the SNMP agent. It defines parameters for the managed device, the SNMP manager uses to inform its requests for certain data. The MIB then translates this data so it can be processed in the NMS. Put simply, the MIB files determine the questions the SNMP manager can ask the agent.
To elaborate, the structure of the MIB determines how the exchange of information in the SNMP system is formatted. Device information is collected by the appropriate agent, then stored locally in a device file. Once a request is received, the stored data serves as the response, displaying the status of the parameter queried by the SNMP manager.
Management information bases are hierarchical databases, since use hierarchical notations to map statuses and conditions of managed objects—objects within a managed device. For example, in the case of a printer, managed objects include the states of the cartridges; in the case of a switch, they might include packet loss rate and traffic. Managed objects are identifiable by object identifiers, or OIDs. The device attributes supplied by the MIB can either be fixed or dynamic, as determined by the relevant SNMP agent for the device.
SNMP Messages
SNMP messages, also known as “protocol data units” (PDUs), are the requests and responses exchanged between the SNMP manager and the SNMP agents. They can take one of seven forms:
- Trap: A trap is an alert message—for example, a trap might alert the SNMP manager to the failure of a device. SNMP trap monitoring is crucial, as it notifies you of issues so you can address them proactively.
- Get: This is a basic information request. A Get message is the main way the SNMP manager gets information from an agent.
- GetNext: As the name implies, a GetNext message sends for the next segment of information.
- GetBulk: This lets the SNMP manager request an array of information via a sequence of GetNext requests, meaning a bigger segment of the MIB can be queried.
- Set: Set messages allow the SNMP manager to give agent instructions regarding changes to settings on a monitored device.
- Response: The response is simply the reply from the agent, acknowledging the request.
- Inform: This is the SNMP manager’s version of the response message, acknowledging receipt of a trap.
How Does SNMP Work?
Activation vs. Installation
On most network devices, SNMP capabilities are pre-installed and ready to use. In instances where this isn’t the case, you can usually turn the SNMP functionalities on and off in the factory settings. Sometimes, by default, these SNMP capabilities are turned off, so check the settings when you first acquire your device.
As I mentioned earlier in this guide, there might be compatibility issues when implementing SNMPv3, which can be addressed by implementing an RTU translator. The same applies to network equipment issues. Say some of your hardware is old and isn’t compatible with SNMP. Installing an RTU establishes SNMP monitoring on the chosen device, enabling the sending of traps in case of errors.
File Storage
Once active, SNMP functionalities are ongoing and uninterrupted, set to fire up as soon as the operating system is turned on. Each operating system will store executable files in a different place, and possibly under a different name, so it’s worth getting familiar with how your operating system does this. Each network server will have multiple .mib files, created when the SNMP software agent is activated. For Windows, these files are under the Windows/System32 directory, while on Linux they’re in /usr/share/snmp/mib.
On-Premises vs. In the Cloud
SNMP managers comprise three key elements: a datastore, a user interface, and a collector. If you’re using a cloud-based network monitor, ensure the collector is installed; however, the datastore and interface software will be located remotely.
Conversely, an on-premises installation entails having the key components installed on a server. You have the choice of establishing your datastore either as a SQL database or as a file.
Initial Request
Once all the agents are active and operating correctly, they can reply to a collector’s Get request. The process of installation is fully complete when the first request is broadcast and picked up by the agents. After that, the interface software will put together an inventory based on the SNMP responses, eradicating the need to manually map your network. Now you’re ready to start monitoring and managing the health of your devices, as well as the overall network.
Tools for SNMP Monitoring
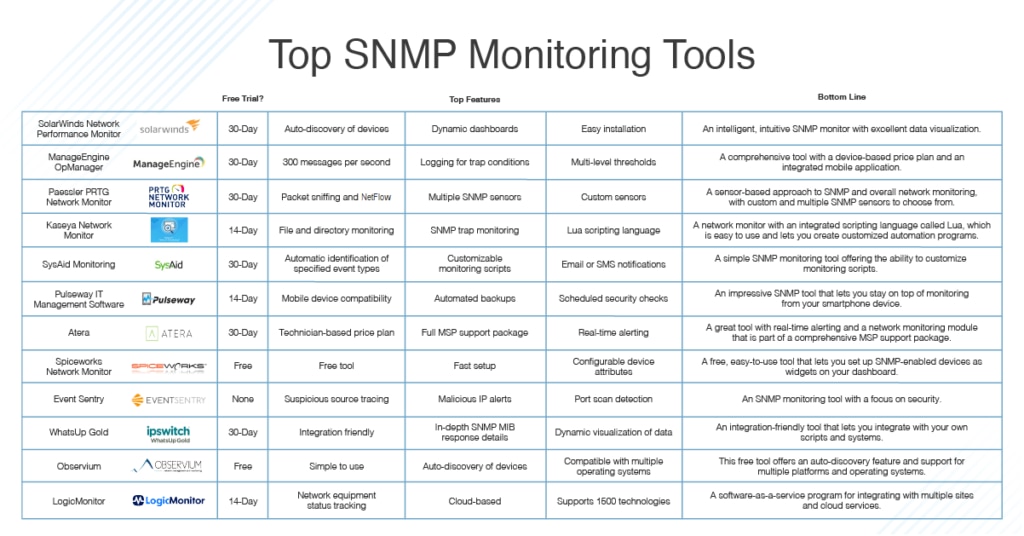
SNMP equips network admins to monitor their managed devices, allowing for the collection, organization, and modification of information related to device behavior. It offers efficiency, granularity, and accuracy in painting a picture of network health and performance. With good SNMP monitoring software, users can leverage the protocol to better monitor key metrics of device performance, receive and configure alerts, and undertake active polling. I’ve compiled a ranked list to help you find the one best suited to the needs of your organization.
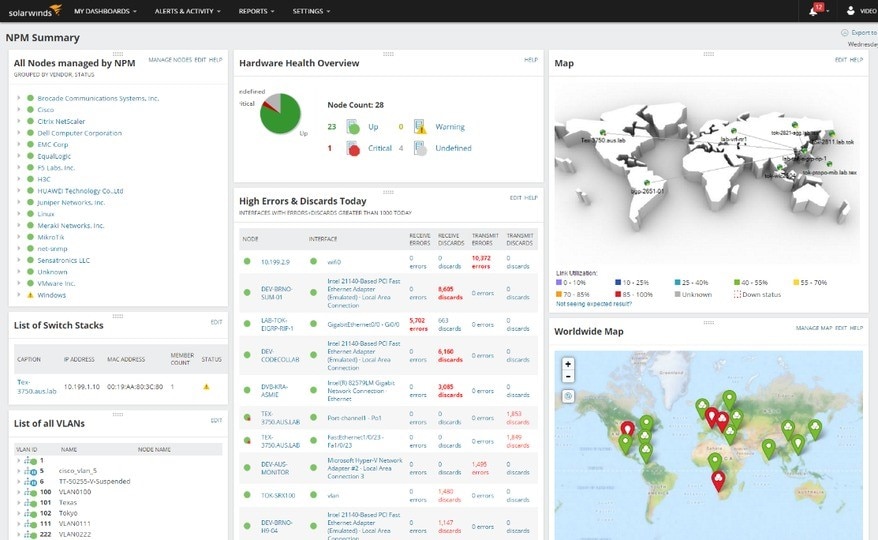
SolarWinds Network Performance Monitor (NPM) tops my list of SNMP managers and SNMP monitoring tools. A few features of SolarWinds NPM push it to first place, including its automatic device discovery tool and interactive, dynamic dashboards. I also found the intelligent mapping feature especially useful, as its intuitive design can make data reading much easier.
I’ll start with the device discovery tool. While some other products include a similar feature, none of them can compete with the efficiency, speed, and ease of NPM. The device discovery tool can locate, map, and configure network nodes automatically once the program is installed, implementing agent software and instructing pre-loaded agents when appropriate. All of this contributes to an easy installation process.
Another strength of SolarWinds NPM is its single-page path analysis. It locates all your important data in one place for comparative and big-picture analyses, giving you a more in-depth and comprehensive view of critical network paths. This negates the common need to ask yourself if it’s the app or the network causing network slowdowns, making troubleshooting easier.
In terms of alerts, NPM features what I consider to be the best SNMP trap receiver available. Most products on the market feature an alerts system of some kind, but few of them—if any—offer the same degree of functionality. Other products’ alerts systems can lead to you feeling inundated with unnecessary alerts. It defeats the point of an alert if you’re getting too many: they start to seem meaningless and eventually, you could start ignoring them because they’re often irrelevant. This can make your network vulnerable.
For this reason, it’s crucial for you to have robust and reliable alerting functionalities. NPM lets you create and customize alerts according to nested trigger conditions, which can be as simple or complex as you like. This means the likelihood of getting irrelevant or uninformative alerts is significantly reduced.
As I mentioned earlier, the dynamic representation of data in NPM is a noteworthy advantage. The way data is visualized can potentially alter its meaning: if the representation is convoluted and difficult to understand, diagnosing issues can be a lengthy or impossible process. NPM features auto-generating network visualization maps, which organize data in a meaningful, intuitive way. This makes it easier to read and interpret data, saving you time by speeding up your troubleshooting processes.
The topology maps report on link utilization through color coding, and are generated automatically, making data visualization extremely simple. The console can also show a close-up of detected device details, offering an in-depth report. I valued NPM’s clean, comprehensible dashboards, which can keep troubleshooting from feeling like searching for a needle in a haystack.
Finally, most networks feature SNMP-enabled devices, but they’re sourced from a range of manufacturers. NPM employs a universal SNMP, so it’s great for multi-vendor networks.
NPM is an excellent SNMP monitoring tool for Windows Server and is also supported by Microsoft SQL Server. A fully functional 30-day free trial is available.
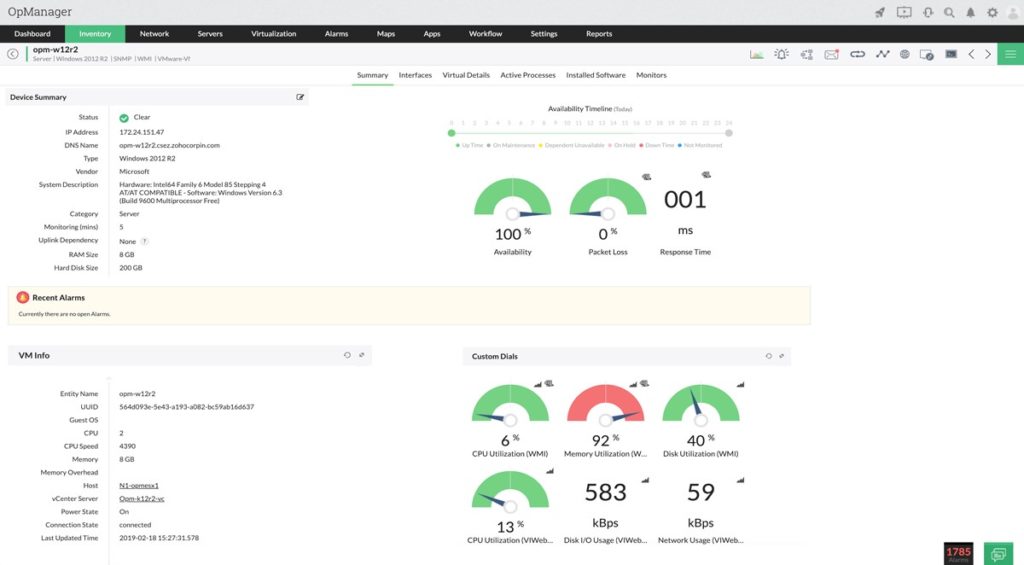
ManageEngine OpManager stands out for its trap receiver features; its processing element can manage 300 messages per second. The user receives collated feedback identifying any potential issues or equipment defects. OpManager’s trap features also include logging functions to take trap conditions into account, giving you a comprehensive overview of trap processes.
This SNMP management software, Windows and Linux compatible, lets you monitor critical metrics, including packet loss, speed, latency, errors, and discards. With OpManager, you can analyze bottlenecks and monitor CPU, disk utilization, and memory. It boasts multi-level thresholds, meaning you can set multiple thresholds for critical performance monitoring, and be alerted of any breaches or violations of those thresholds.
With features extending to network mapping, traffic analysis, network status monitoring, and VoIP traffic management, OpManager serves as a highly comprehensive SNMP tool. With its customizable dashboards, you can choose from and organize more than 200 performance widgets. I also like its integrated mobile app for Android and Apple, which lets you stay on top of real-time monitoring across devices. Via the app, you can perform basic troubleshooting, receive alarms and alerts, and customize your dashboard.
OpManager SNMP software is a fully integrated network management tool and operates on a device-based price plan, which has its advantages and its disadvantages. On the one hand, it makes sense to pay according to the number of devices you employ on your network. On the other hand, the three different editions—Standard, Professional, and Enterprise—increase in price according to the number of devices, so value decreases if users don’t maximize the number of devices allowed within their edition.
Although OpManager also offers a free SNMP monitoring tool, available for up to three devices and two users, it’s limited and basic in its functionality. Instead, I’d opt for the paid editions.
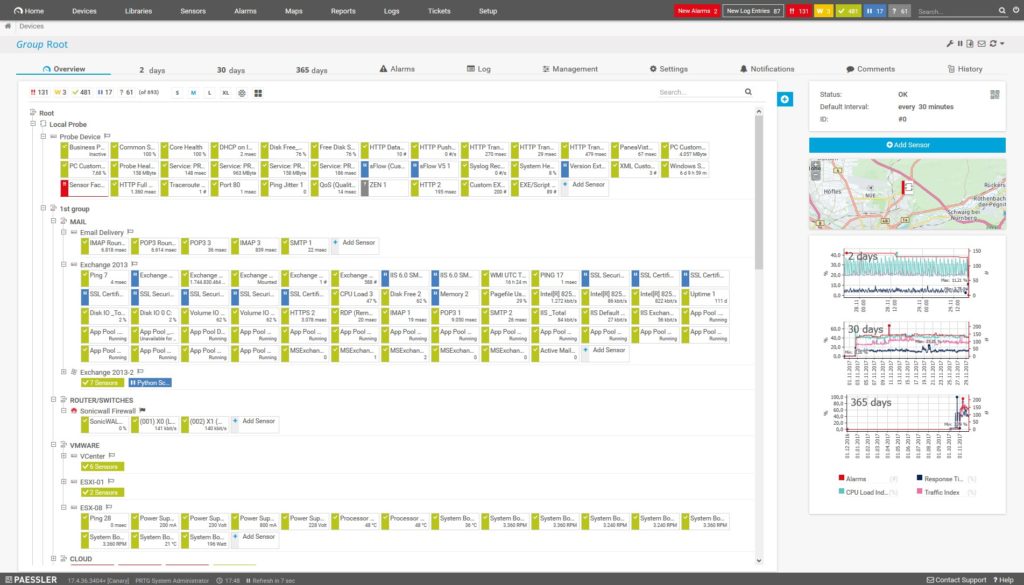
Paessler PRTG is a versatile tool offering three network monitoring methods, of which SNMP monitoring is one. The other two methods are packet sniffing and NetFlow. These are activated when network traffic analysis is undertaken, widening the scope. Used together, these three methodologies provide visibility of a range of network information, giving you a comprehensive overview as well as access to detailed analytical data across the levels.
PRTG differs from other tools on the market in its use of what Paessler calls “sensors.” These sensors are the basic monitoring elements of the tool. One sensor, for example, might monitor the CPU load of a server, while another sensor might monitor disk drive space. PRTG comes with multiple preconfigured SNMP sensors. They’ve even developed sensors specifically for device manufacturers like HP, Synology, Dell, and Cisco. I found the SNMP custom sensor, which lets you monitor devices from a range of manufacturers with SNMP, especially valuable.
I also like the tool’s built-in alerts feature, because it lets you designate your own threshold values. You can also choose how you’re notified of a breach or violation (e.g., via email, free push notification, or SMS). The notification system is user-friendly and can be customized to suit your needs.
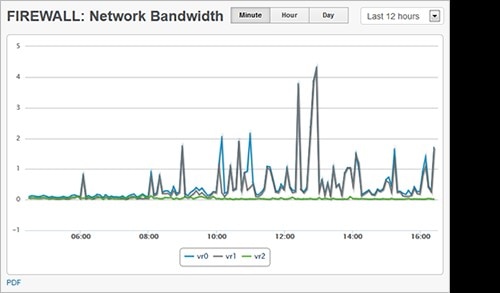
As an SNMP client and monitoring tool, PRTG has several features vying for the spotlight, one of which is the SNMP tester included in the management console. This gives you more detailed information on reported alert conditions by trap message. Lastly, I enjoyed the PRTG dashboard, which gives you a dynamic view of your data in the form of graphs and dials.
The key disadvantage of PRTG is its sensor-based price plan. To keep the cost lower, some companies might be tempted to limit the number of sensors they use, which could potentially affect full network visibility.
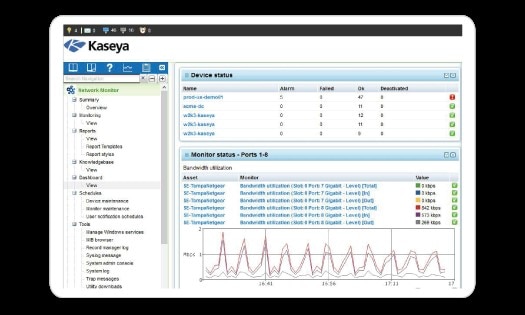
Kaseya Network Monitor is a great SNMP monitor for Windows, offering monitoring of Windows performance registry counters and WMI queries. This agentless platform is integrated with Kaseya VSA, a network and system remote monitoring package. Kaseya VSA can be used to monitor everything from servers and hypervisors to routers and firewalls.
I liked Kaseya’s breadth of monitoring utilities, which include file and directory, log, database, SNMP trap, and mail quality-of-service monitoring. Of these, I found the file and directory monitoring functionality especially useful, because it lets you determine whether a file exists, as well as how many files are in a directory, the size of the directory, and the capacity.
Kaseya Network Monitor integrates a scripting language called Lua, which is simple and easy to use since the integrated development environment helps you assemble scripts. Lua lets you create customized automation programs. Moreover, the standard installation of Kaseya also features pre-established reports, as well as commands and routines, so you can get things going quickly.
Kaseya is available for 24 operating systems, including Windows, Linux, VMware, and Cisco IOS. Overall, Kaseya Network Monitor holds its own against many of its competitors, though it lacks the dynamic and varied visualization features offered by the higher-ranking products on this list. The dashboards aren’t as clean or comprehensive, and don’t offer the same in-depth degree of detail.
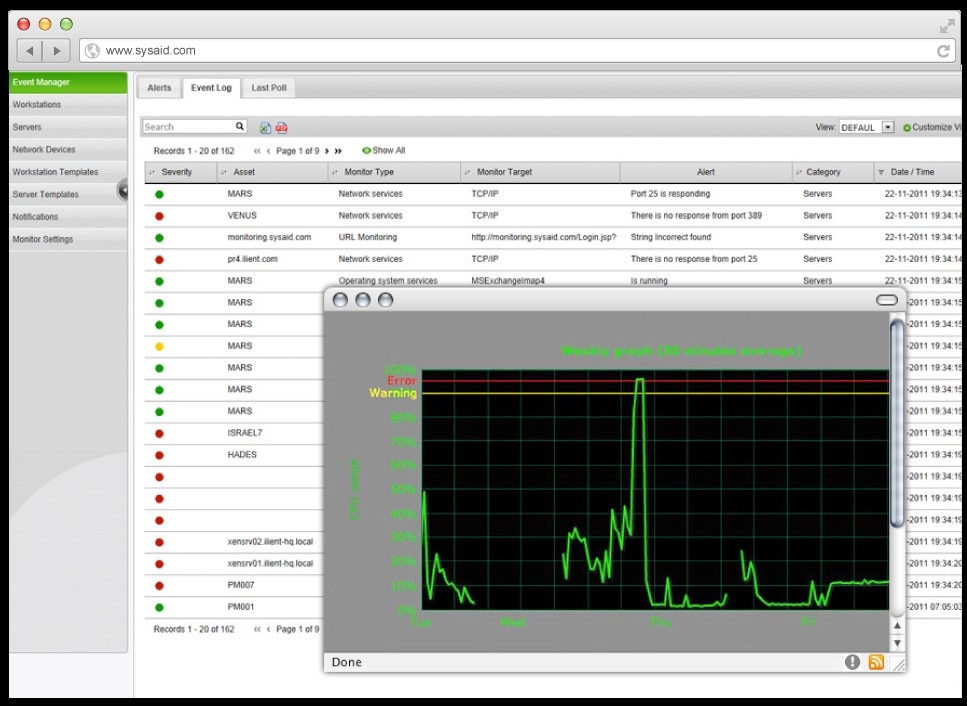
With SysAid, you can proactively monitor your SNMP assets. The SysAid Monitoring module automatically identifies specified event types, notifying the relevant parties if there’s a problem. It monitors services, processes, URL and webpage availability, hardware changes, software changes, critical hardware components, and ports. The program also covers CPU, hard drive usage, and memory, in addition to letting you receive traps from SNMP devices. You can create custom scripts for monitoring, which SysAid will run for you.
The alerts system is limited to notifications via email or SMS. I would’ve appreciated more options for notification, like push notifications to your smartphone. Moreover, SysAid Monitoring is not a standalone product, but is offered as part of the SysAid help desk and IT service management software. This may not be suitable for companies not wanting to adopt the full SysAid software package.
I also found the dashboard more cluttered and overwhelming than most. Though it’s comprehensive, offering visualization of hourly, daily, weekly, and monthly data in graphical form, it’s not necessarily intuitive.
In short, SysAid Monitoring offers some nice functionalities, but is more limited, and at times less user-friendly, than the higher-ranking products on this list.
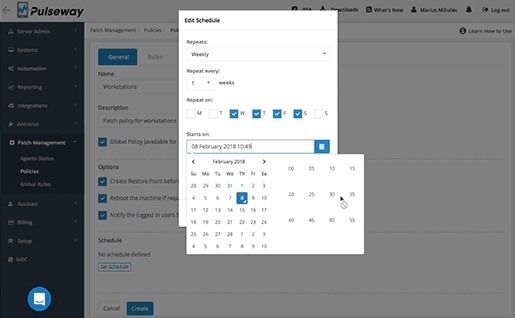
With Pulseway SNMP management software, Windows, Linux, and Mac users gain monitoring capabilities for a wide range of network elements: system resources, network performance, Windows updates, and SNMP-enabled devices, among many others.
One of the reasons I like Pulseway for SNMP monitoring is its compatibility with mobile devices. This utility lets you send on-the-go commands, fixing issues as they occur directly from your mobile device. A lot of mobile applications for monitoring software give you visibility of data, but don’t offer much opportunity to act. With Pulseway, you can run commands in terminal, restart services, manage processes, and apply updates from your mobile device.
I also like the focus on automation. You can create your own customized scripts, which can be used to automate all IT activities—backups, security checks, and more—potentially saving a lot of time. There’s also a rules base, where you can apply and categorize alert thresholds for SNMP trap signals. The response to an alert can be scripted, allowing for automated reporting and resetting of devices.
Although Pulseway has its merits, it doesn’t offer the same degree of sophisticated technologies as some other products on the market. For one thing, its alerts system could be more versatile, offering greater choice as to how notifications are received.
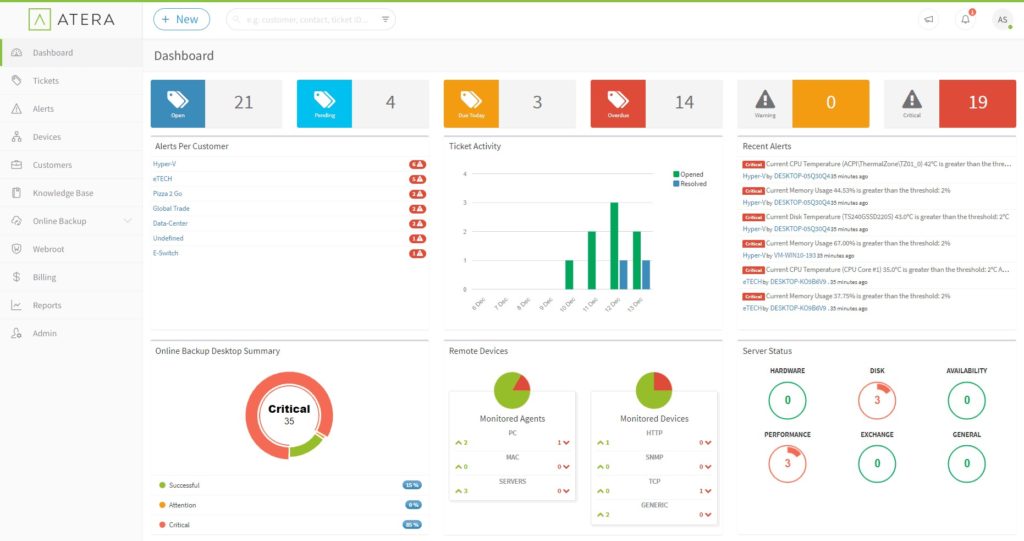
Atera is an SNMP monitoring tool with a great price plan. The pricing model is technician-based, boasting unlimited workstations and servers. You can even add extra customers without paying anything more. As far as paid programs go, this one has an attractive pricing system, giving you transparency and flexibility.
Atera offers a full MSP support package, which includes network monitoring functionalities as well as a help desk system. Atera’s program covers application usage and capacity, as well as generating invoices and log reports based on user activities. SNMP features in the network monitoring module, and SNMP traps are a core part of this.
I appreciated the real-time alerting utility Atera provides, as well as the remote access capacity, which lets you view and interact with your console via your mobile device. Though Atera doesn’t give SNMP monitoring the same amount of focus and attention as other products higher on this list, the price plan is attractive.
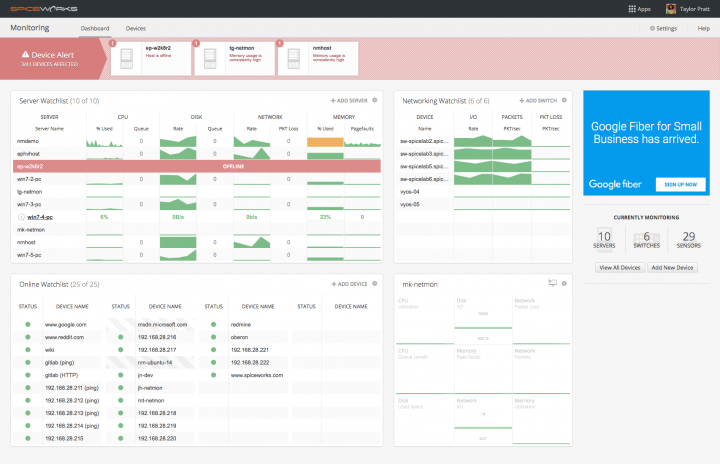
Spiceworks Network Monitor is a free tool specifically designed for SNMP monitoring—in other words, it isn’t just a module in a wider IT software package. Considering it’s free, you can expect a lot from Spiceworks. The dashboard is user-friendly and simple, and you can get the program set up in a few minutes.
You can set up SNMP-enabled devices as widgets on your dashboard, so you have constant visibility into critical device data. You can also configure the attributes shown, such as packet loss, packets, and I/O. This customization feature sets Spiceworks apart from other free SNMP managers on the market.
The alerting system is decent, providing a basic threshold-based approach, both on a global level and at the device level. You won’t have to learn any new programming languages, do any programming yourself, or implement any rules. On-screen and email notifications keep you apprised of any changes. Usefully, SNMP traps are displayed as alerts, which appear as a headline strap on the dashboard, making them difficult to miss.
Real-time performance graphs are a welcome feature, although they can make the dashboard look a bit cluttered. Nevertheless, they give you a wide scope of visibility, so you’re unlikely to overlook any important changes or issues.
While Spiceworks is a useful free tool, it’s best suited to small networks. If you need a sophisticated SNMP monitoring tool for a larger network, I recommend investing in a more comprehensive and robust paid solution. Spiceworks has a learning center and a big community forum, meaning you’ll have ongoing access to free support if you decide to download it.
EventSentry is a resource utilization monitor designed to give you visibility into how software and hardware are being used on your network. This program’s distinguishing feature is its security monitoring capability, which tracks user activity.
EventSentry can be configured to identify several issues, including multiple cross-server logins and any activity indicative of a threat, infection, or virus. It can also be set up to recognize multiple failed sign-in or authentication attempts, which could be a sign a hacking attempt is underway. EventSentry can trace the location of a suspicious source, conducting internet monitoring checks on incoming connection events and integrating details of the source into its activity reports. The threat intelligence capacity is impressive, alerting you to any malicious IPs, detecting and flagging port scans, and letting you view recent threads on your dashboard.
Overall, EventSentry is a useful SNMP monitoring tool for companies with a focus on security. It uses SNMP to monitor network equipment capacity, with SNMP traps collected by the network management console. A range of conditions—including storage capacity and memory availability—are regularly polled.
The latest version of EventSentry enables the use of multiple customized dashboards, as well as a mode to makes the console viewable on TVs. I found this feature especially unique, as it allows you to give your whole IT department full and constant visibility if desired. The web interface can be viewed in nine languages, which could be extremely useful for companies with global offices or multilingual employees.
EventSentry has some interesting Windows-specific features. This includes Windows registry tracking, which lets you track any changes made by a specific program, identify any user changes to the registry, search for registry actions in a comprehensive log, and view before and after values related to any changes.
The emphasis on network security over resource performance might be appealing to some, but for those who want to prioritize performance, I recommend using a different SNMP manager. In terms of the cost, EventSentry’s pricing is license-based. So, the price will vary according to how many licenses—whether for servers or workstations—you need.
This price plan lets you choose add-ons to accompany your package, customizing it to suit your needs. For example, you could choose a NetFlow license add-on, a deployment add-on offering remote training and installation, or an ADMonitor User Objects add-on, which gives you active directory change monitoring capacities. The license you buy has no time limit, no data limit, and requires no subscription.

WhatsUp Gold is a monitoring system developed by Ipswitch. Though this software incorporates infrastructure monitoring capacities, its focus is on network performance monitoring and augmentation. This is an SNMP monitoring tool for Windows, covering Windows Server 2008 R2, 2012, 2012 R2, and 2016.
When you’re getting started with WhatsUp Gold, you’ll appreciate its network discovery tool, which is SNMP driven. The tool is integration friendly on account of its powerful REST API, which means you can integrate it with your own scripts and systems. You can also extract specific data from WhatsUp Gold, letting you automate your workload. Alternatively, you can undertake automation by inputting information from an external system or separate script.
On top of this, current status information can be extracted for use by another system, and devices can be put into maintenance mode before changes are automatically made. These integration utilities make it easy to use WhatsUp Gold alongside other tools, systems, and scripts.
With WhatsUp Gold, SNMP MIB responses provide in-depth information on each device on the network, including device manufacturer, type, firmware version, current status settings, and serial number. Moreover, devices are identifiable by their MAC address, hostname, and IP address. These details enable you to gain granular, comprehensive insights into your network and all its connected devices. All the information collected from the SNMP responses is collated into a database and assembled in the console, with dynamic visualization in the form of graphs and charts. Moreover, the device register is fully searchable, so you can access desired info quickly and efficiently.
My favorite WhatsUp Gold feature is the dashboard, which is colorful, clean, and simple. It doesn’t feel cluttered, and it’s highly user-friendly, with clear tabs at the top letting you navigate between “Discover,” “My Network,” “Analyze,” and “Settings.” Even with its simplicity and ease of use, the dashboard doesn’t lack information by any means, but offers a wide scope of visibility of critical metrics.
Another thing I liked was the mobile phone application, which is available for both Android and iOS. The app lets you monitor network status at a glance, so you can keep on top of changes and issues even when you’re away from your desk.
As an SNMP manager, WhatsUp Gold continuously listens for trap messages sent by device agents, which are then converted into alerts. In addition to being displayed on the dashboard, alerts can be delivered in other ways. You can choose to receive notifications via methods including email, SMS, Slack, IFTTT posts, and web alarms.
The main reason WhatsUp Gold didn’t rank higher on this list, despite its range of features, is setup can be complicated, to the point that you might need support or training.
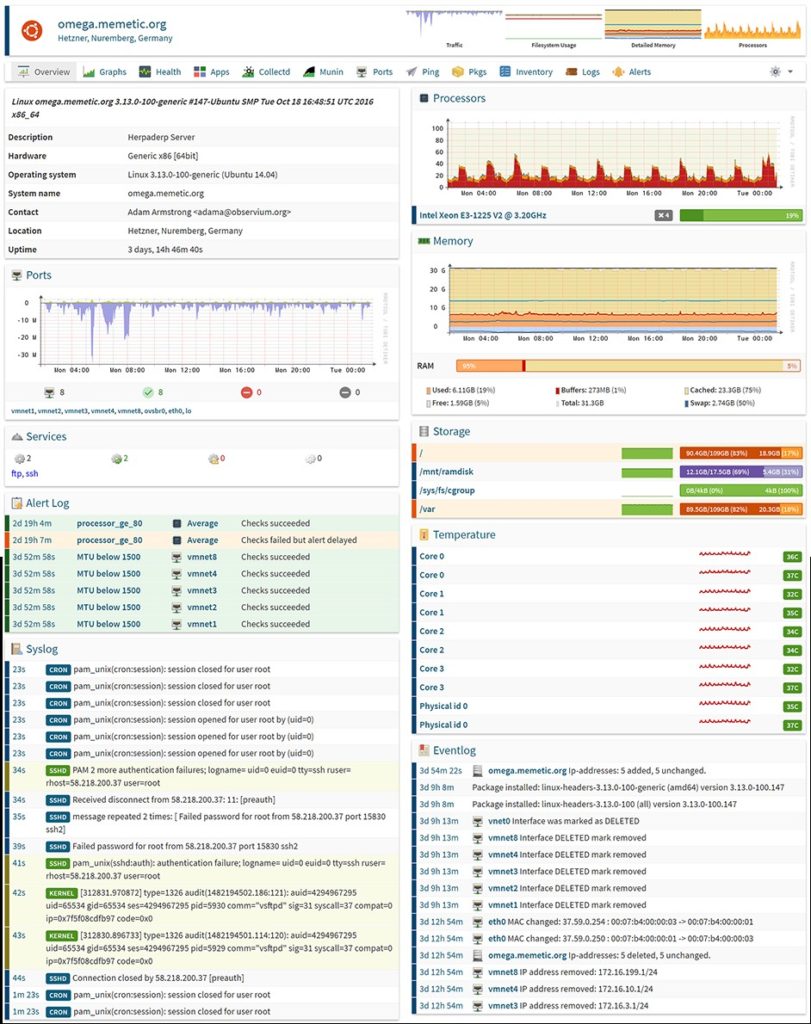
Observium bills itself as a “low-maintenance” platform for network monitoring, which I find to be an accurate description. It offers three open-source editions: Professional, Enterprise, and Community. Community is a free SNMP-based monitoring tool, best suited to home or evaluation use. The Pro and Enterprise editions are priced on a yearly subscription basis. Every edition features an auto-discovery utility to identify all the devices on your network and then report on their status.
Whichever edition you opt for, Observium is simple to use. Just add the devices you’d like to monitor, either using the automatic discovery feature or manually. Once devices have been identified or added, visit the overview page to view the status of each device.
Observium supports a wide range of device types, platforms, and operating systems, including F5, Citrix, Juniper, Linux, and Windows.
LogicMonitor combines NetFlow-sourced data with its SNMP functionalities, offering users a comprehensive view of their network’s performance. The SNMP portion keeps track of network equipment status, as well as which devices are connected, while the NetFlow utility displays traffic flows over links.
LogicMonitor relies on a cloud-based concept, which is useful because it lets you combine and integrate data from multiple sites, as well as from other cloud services. For IT professionals, this is an obvious advantage, considering how many of us use multiple cloud storage providers and managed application servers.
The tool employs a software-as-a-service approach, which means information-collating servers are located offsite. To access this information, you can use your desktop browser, or an app on your smartphone. The benefits to this approach are numerous. Most notably, you can access LogicMonitor from anywhere, meaning you don’t have to be at your desk to be working. With the smartphone application, you can stay up to date even when you don’t have access to your laptop or desktop.
Since responding to changes and issues quickly can be critical, the SaaS orientation of the tool is a feature I highly valued. This cloud-based approach makes integrating multiple sites and cloud services easy. However, there’s a potential drawback to the software-as-a-service design. Many IT professionals have rightly raised the issue of security, arguing cloud-based data is more vulnerable to hacking. This is important for network administrators to consider when looking for an SNMP monitoring tool.
In sum, LogicMonitor has some excellent utilities, but its cloud-based approach isn’t for everyone. Still, it’s an attractive program, offering automatic device and interface discovery, interface metrics, wireless access-point monitoring, and much more. It supports over 1,500 technologies, so it can collect actionable performance data from switches, firewalls, routers, and load balancers, in addition to other networking gear.
Choosing the Best SNMP Monitoring Tool
After trying out a wide range of the tools currently on the market, I have no qualms about ranking SolarWinds Network Performance Monitor as the best SNMP network monitoring software. At the end of the day, this comes down to overall usability, the breadth of SNMP monitoring features it includes, and the sophistication of the technology. The visualization of data, intuitive alerts system, and vast community of support further sets SolarWinds NPM apart from other tools. Try it out before you make your decision: the company offers both a fully functional trial and a hands-on demo free of charge.