With the introduction of cloud services and microservices, applications have become more complicated due to their increased layers of complexity and distributed architecture. While microservices clearly offer speed, they also make things harder for the developers and operations teams. These teams need to plan for the reliable and efficient performance of such applications. To combat these challenges, application performance monitoring (APM) has surfaced as an indispensable discipline.
In this post, we’ll discuss APM, why it matters, and how it differs from similar practices. We’ll also discuss the best practices for implementing APM and the types of tools available to help organizations.
Key takeaways:
- APM is Critical for Managing Complex Modern Applications: As applications move to microservices and cloud-based architectures, their complexity increases. APM plays a vital role in helping development and operations teams ensure reliable performance and smooth user experiences by identifying, diagnosing, and resolving issues before they escalate.
- Monitoring and Management Serve Distinct but Complementary Roles: Monitoring passively collects metrics and alerts on anomalies, while management actively uses that data to optimize performance. Together, they form a full APM strategy that moves from awareness to action.
- Observability Extends Beyond Traditional APM: While APM focuses on known metrics and issues, observability enhances visibility into unknown or emergent problems using logs, metrics, and traces. It’s a necessary complement in modern, distributed environments where unexpected failures are common.
- Best Practices Emphasize Strategy, Testing, and Collaboration: Successful APM implementation depends on setting clear goals, integrating performance testing early in development, and fostering collaboration across teams. APM isn’t just about tools—it’s about making performance a shared, proactive responsibility.
- Unified Tools Offer Greater Efficiency and Insight: Rather than siloing application and infrastructure monitoring, unified APM tools provide end-to-end visibility. This convergence simplifies troubleshooting, accelerates root cause analysis, and supports more informed IT and business decisions.
What is Application Performance Monitoring?
APM is the practice of tracking, measuring, and managing the performance and availability of software applications. Modern APM solutions deliver insights into how applications perform within the real environment, equipping teams to identify, diagnose, and resolve performance issues ahead of user impact.
Some of these core components in comprehensive APM solutions include:
- Continuous tracking of application performance metrics to create a baseline and identify anomalies
- Tracking the journey of user requests from service to application component to identify bottlenecks
- Linking to specific functions or lines of code that lead to performance problems
- Determining how users utilize applications and tracking user experience
- Monitoring the underlying infrastructure components
Why is Application Performance Monitoring Important?
APM has business value far beyond its technical benefits. When organizations deploy APM solutions, they can achieve multiple strategic goals.
APM helps identify and resolve issues before they turn into critical outages. It also improves user experience, protecting and improving the company’s revenue. When applications stall, users may become frustrated and turn to a competitor. APM ensures everything runs at optimal levels for users to achieve their goals.
APM also delivers data-backed IT investment decisions. Performance metrics show which parts need to be upgraded, optimized, or replaced. Using these documents helps you avoid spending money on infrastructure where it isn’t needed while allocating funds to areas that will give better performance optimizations.
Application Performance Management vs. Monitoring
In APM, the terms monitoring and management are often used together, but they are different ways to improve application performance.
- Monitoring: The Passive Approach
Performance monitoring forms the foundational, data-collection-heavy layer of APM. This is a way to collect performance metrics data, display it in dashboards, and send an alert if a set level is reached. These tools can track different things, such as how long it takes to respond, how many errors happen, and how many resources are used. This lets organizations see their applications in nearly real time.
- Management: The Proactive Approach
Performance management incorporates strategic, action-oriented components on top of the monitoring steps. Management is about processing performance data to find areas for improvement, optimizing them, and measuring the effects. This approach converts unrefined performance data into practical insights for continuous improvement.
Application Performance Monitoring vs. Observability
APM and observability offer radically different approaches to detecting and solving problems with application behavior. Let’s understand the differences.
- Traditional Application Performance Monitoring Limitations
Traditional APM tools are used to set limits and keep track of metrics. These systems monitor particular elements of application performance that teams have identified from past projects or the experience of others in the industry. This method works really well to catch known issues and gain structured insight into how the application behaves.
Traditional APM is predictably limited in its approach to known failure modes (Ex. how applications have failed in the past or may be likely to fail in the future). This is a strength for handling recurring issues but also a weakness because it leads to gaps in visibility for unexpected issues that may emerge in complex systems.
- The Observability Paradigm
Like APM, observability focuses on exploring the system to find unknown problems. But observability also takes this directive in a new direction. Observability is concerned not only with metrics but with designing systems whose states can be interrogated and understood from the outside. This idea is built on three pillars:
- Logs: Textual records of events that happened inside the application
- Metrics: Time-agnostic numerical measurements of system performance
- Traces: Timestamps of requests as they go through distributed services
How Does Application Performance Monitoring Work?
It’s no surprise application performance monitoring requires you to collect performance data from your apps. This includes user experience information, data about app interactions and dependencies, the functionality of apps within a virtual ecosystem, and other app-level information. When you’re monitoring dozens or hundreds of applications, it can be quite a task to access all that information.
In today’s highly distributed IT environment, you need to be able to monitor all apps, including virtualized apps and applications in hybrid cloud environments. Virtualized applications can be a challenge to monitor because you must have visibility into not just the application but into the virtual servers (which lie below the application layer) and a hypervisor platform (below the virtual servers).
Application performance monitoring also needs to include several additional factors. All applications rely on lower-layer components to function, so relevant metrics may include network traffic information, syslog, storage, memory, and more. You may need insight into application servers, operating systems, database servers, virtualization management tools, web servers, mail servers, and more.
When it comes to application performance monitoring, you may be trying to answer a variety of questions, including the following:
- Is the application responding correctly, such as in a way allowing it to function?
- Is the user experiencing only an appropriate level of latency?
- Are all backend processes supporting applications in an optimal way?
- What part of the application or network architecture could be causing transaction bottlenecks?
- Is the problem in storage, user access, or connectivity? Is it the resources themselves or their configurations?
- Are there errors in the application code?
How to Measure Application Performance: Essential APM Metrics
Metrics are a crucial aspect of your application performance monitoring system. It’s important to track multiple components of your system and take several different perspectives if you want to be able to accurately and quickly pinpoint the root cause of lags. This requires automated visibility, made possible through a comprehensive application monitoring software program. Although not a complete list, you should consider the following aspects for effective application monitoring:
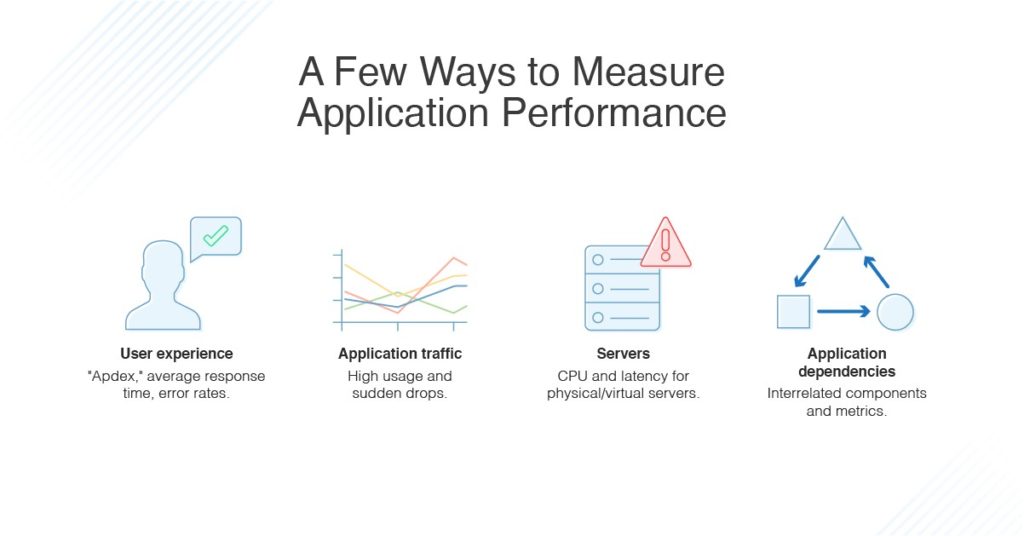
User experience: Focusing on end-user experience provides insight into the actual impact of system issues. The application performance index, or “Apdex” score, uses an equation to calculate satisfaction, based on fast, sluggish, slow, and failed requests. Similarly, average response time and error rates are critical for understanding what your end user is actually experiencing when they use an application.
Application traffic: Understanding request rate, or traffic, can provide insight into performance. Correlate request relates with other metrics to see what happens in periods of high usage (sudden drops can also signal issues). It can help to use an application usage monitor to predict and prepare for traffic spikes possibly overwhelming servers and networks.
Physical and virtual servers: You should monitor the baseline aspects of your system your applications depend on, which means analyzing both physical and virtual servers for excessive CPU load, low storage, virtual resource allocation, and potential hardware issues. For instance, the following are some key metrics for IOPS throughput for the server, which can reveal latency and connectivity issues:
- Logical disk average: disk queuing
- Average and maximum IOPS write/read
- IOPS latency write/read
- IOPS total
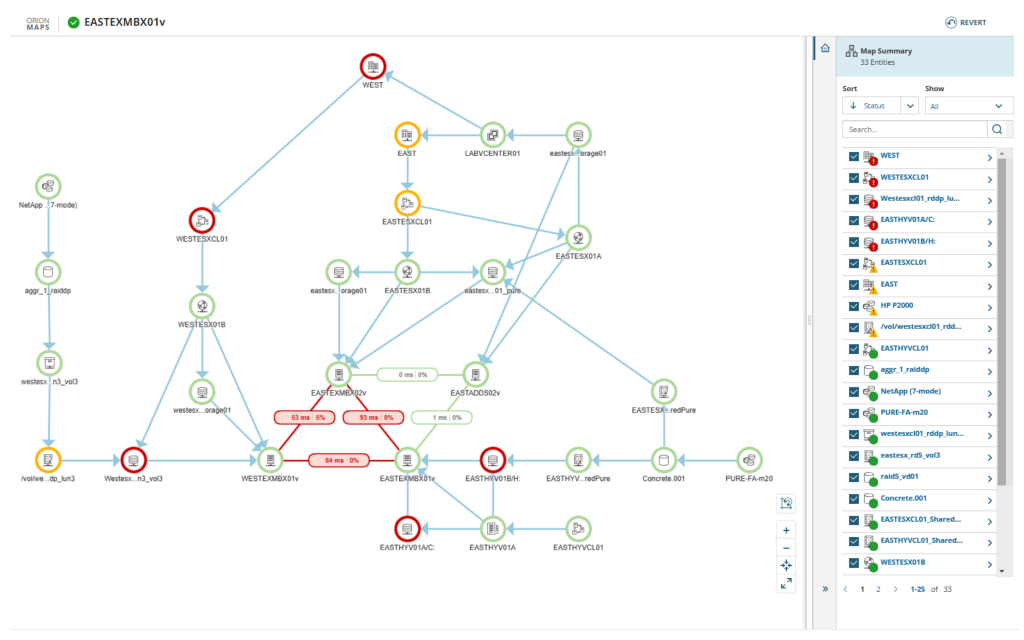
Application dependencies: Understanding dependencies between parts of your system is critical for pinpointing bottlenecks. Dependencies can be revealed through comparing multiple metrics types—like status, events, and statistics—and through analyzing various components at the same time, including nodes, volumes, and applications. It can be especially useful to see timeline visualizations of your chosen elements.
Storage and resource capacity: Storage resources, like hard disks, memory, or CPU, might be the cause of a capacity shortage causing your application to malfunction. It’s useful if you can track not just current storage shortages, but also forecast and prepare for future workload management.
Caching layer metrics. Your caching layer is a storage layer which allows for quick data retrieval, in exchange for temporary data storage. Since caching uses a secondary storage location (aside from your main data bank), when your apps retrieve data they often access it through the caching layer. If your app is having difficulty retrieving data, it’s necessary to understand the time series-based performance metrics of your caching layer, and to diagnose any bottlenecks in data retrieval from your caching layer.
Load balancing metrics. Load balancers can be a helpful tool to distribute network traffic in an optimal way. Load balancers can take many different forms, from virtualized load monitors to hardware to software integrations. The idea behind a load balancer is that it deploys a diverse variety of tactics to direct traffic flow in the smoothest way possible, which can deliver a more streamlined performance for your complex network. A malfunction in the load balancer could cause a glitch traffic flow and affect your application performance.
Beyond these elements, application performance monitoring may also consider aspects like:
- Slow SQL queries: If your database queries aren’t optimized, a lag here could slow down application functioning.
- Transactions: Transaction monitoring helps you see and test the impact of code changes.
- Application availability: If you’re monitoring a web app, use HTTP checks to see if your application is online and available. Ensuring uptime is part of many service level agreements, so this metric can be critical.
APM Best Practices
Implementing APM needs to be strategic, as it requires consideration of technical, organizational, and process factors. Let’s review some best practices.
1. Implementation Strategy
Begin with clear goals for the APM implementation. Success can mean different things for different applications (e.g., minimizing downtime, improving user experience, optimizing resources). These goals will help you choose metrics, tools, and processes.
Start with the most critical applications, then roll out coverage incrementally. This phased approach enables teams to build up knowledge on APM tools and improve their monitoring strategy before expanding.
2. Continuous Performance Testing
Merge performance testing with the development pipeline to identify potential breaks before pushing anything to production. This helps you avoid introducing new performance issues. Plus, it gives early feedback to developers.
Perform load testing on a regular basis to check whether the application is performing well under the anticipated and peak conditions. These tests should reflect the usage and traffic patterns of a normal user to achieve meaningful results.
3. Cross-team Collaboration
APM requires a cross-functional approach that spans development, operations, and business teams. Ensure visibility of the performance metrics so that responsibility for achieving performance targets is shared among all stakeholders. Conduct regular performance reviews where teams review trends, discuss recent incidents, and formulate ways for improvement. This maintains performance as an ongoing, preventative priority—not a reactive crisis.
How APM Improves User Experience and Application Reliability
There are multiple benefits of APM for user experience as well as system reliability.
- Proactive Issue Detection
Contemporary APM tools find outliers and trends that are precursors to outages, so you can catch potential issues before they impact users. APM provides an early warning system that allows teams to solve problems during scheduled maintenance windows instead of responding to outages.
- Enhanced Troubleshooting Capabilities
If something does go wrong, APM accelerates mean time to remediate since it provides information for troubleshooting problems.
Transaction traces indicate which components contribute to a problem, and code-level diagnostics at the function level identify bottlenecks. APM shows exactly what occurred leading up to, during, and after an incident. This data-centric approach can prevent teams from implementing changes based on false assumptions about the underlying problem.
- Continuous Improvement Cycle
APM allows for a continuous cycle of improvement beyond mere reactive troubleshooting. Historical performance data uncovers optimization opportunities teams can prioritize during regular development cycles. The team can find out which parts have failed over time by looking at how they’re doing. They’ll need to change them or replace them.
Do you Need to Use Separate Tools for Application Monitoring and Infrastructure Monitoring?
One of the ongoing debates on both sides of enterprise walls is whether organizations should retain distinct APM and infrastructure monitoring tools or turn to unified solutions.
- The Traditional Siloed Approach
Traditionally, application and infrastructure monitoring have been different specialties, with tools used independently of each other. APM was centered around the performance of code and the user, whereas infrastructure monitoring tracked servers, networks, and storage.
Maintaining application and infrastructure monitoring as separate practices led to a number of challenges. These include longer resolution times and a culture of blame between teams as they struggled to correlate application issues to underlying infrastructure problems. Having multiple disparate monitoring systems also complicates operations and training.
- The Case for Unified Monitoring
With the rise of microservices, containers, and cloud resources, the boundary between application and infrastructure has started to blur. Because performance is an issue that crosses multiple layers, application and infrastructure metrics must be correlated to troubleshoot effectively. Today’s best APM solutions have changed to include features that monitor infrastructure. They recognize that application performance is important to the systems that run it.
Combined monitoring gives teams complete visibility into how infrastructure changes affect application performance and how application performance affects the business. This unified perspective reduces the time to identify the root cause and improves the ability to plan for capacity.
How Do APM Software Tools Work?
Application performance monitoring software offers admins the information they need to catch issues, pinpoint root causes, and quickly resolve the situation. These tools are useful because they automate the process and even provide alerts on incoming data. These performance monitoring tools are typically built on some key functionalities, including the following:
- Protocols. Application performance monitoring tools might use several protocols, including UDP, TCP, SNMP, and WMI to gather real-time information about managed application and infrastructure components. APM monitoring tools typically make “calls” to servers to request key data. SNMP polling data can be useful, although some of the best performance metrics are time series-based, because they offer more granular detail for everything from CPU and memory to response latency and user patterns. A successful monitoring tool will provide insight into your entire application stack across your network’s servers and app containers.
- Syslog. You can detect and diagnose performance issues using these event records. Syslog messages can be live-monitored with app monitoring software analytics tools. There are many sources of log data to help measure app performance—app servers, database servers, hypervisors, firewalls, and more. Understand the components of your systems contributing to app function and analyze their syslog data accordingly.
- Templates. At first, the number of components required for app monitoring might seem overwhelming—how can I identify every single aspect of the server which might affect app usage? How can I know I’m not forgetting anything? Templates are typically designed to pull specific metrics for dozens of the most commonly used business applications. These preset templates offer comprehensive performance monitoring from a centralized control panel.
Selection Criteria of an APM Software
Organizations should take several factors into account when choosing an APM solution.
- You should consider whether you need software as a service (SaaS), on-premises, or a hybrid option based on the data security and compliance requirements
- Scalability and retention capabilities define how a solution will grow with its application and how long historical data will be available for trend analysis. These parameters have direct implications on both performance and cost
- In large environments, machine learning and AIOps features can also significantly decrease the need for manual labor. Assess the tools’ level of automation for anomaly detection, event correlation, and root-cause analysis
Best Application Performance Monitoring Tools
SolarWinds Observability Self-Hosted
SolarWinds offers comprehensive observability tooling with powerful infrastructure monitoring capabilities, detailed transaction tracing, and customizable dashboards that provide visibility across complex environments. Its intuitive interface and broad integration support make it particularly valuable for organizations seeking consolidated monitoring solutions.
With predefined application monitoring templates for over 1,200 systems and apps, SolarWinds Observability Self-Hosted helps you identify which aspects of your multilayered system to monitor. Once you’ve settled on the right targets, it provides continuous app monitoring across your app stack, which means any problem spots can be detected and diagnosed as quickly as possible. The tool also provides out-of-the-box monitoring for multi-vendor apps which might be difficult to monitor otherwise, with the ability to track both real-time and historical metrics you can then use to set custom alerts for instant awareness into trouble spots.
No matter what application you’re running on your stack, chances are good SolarWinds tool can provide seamless monitoring. But, on the chance your server is running an app the tool doesn’t know, it provides a painless setup for monitoring custom applications—whether they’re operating on your server or in the cloud. This allows for a high degree of flexibility in your app monitoring capabilities.
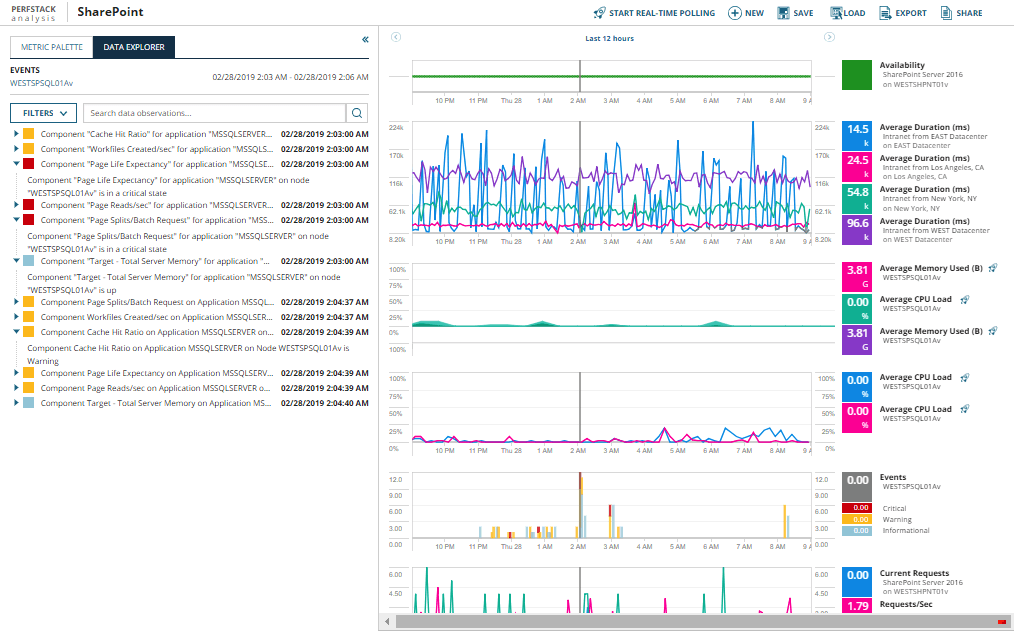
In addition to the above features, SolarWinds offers a proprietary performance analysis dashboard view (PerfStack™) to help you visualize app monitoring from a centralized dashboard. PerfStack includes highly useful features such as troubleshooting, real-time alerts, and automated issue reports. It can even make suggestions on your app solutions based on data-driven analytics.
The best part is you can try out SolarWinds SAM risk-free during a fully-functional, free 30-day trial to see if it is the best application performance monitoring solution for your needs.
New Relic
New Relic provides an end-to-end observability solution that integrates APM with infrastructure, logs, and digital experience monitoring. The free tier can be perpetual, allowing smaller organizations to try it out, and its dimensional data model allows performance data to be queried flexibly.
Splunk Observability Cloud
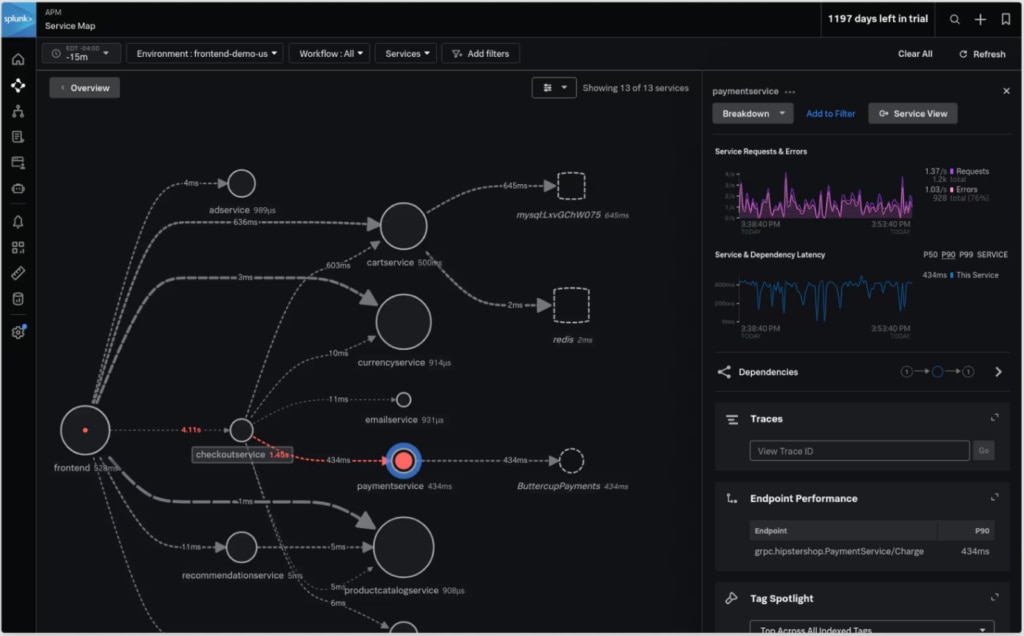
Splunk Observability Cloud helps you spot performance issues fast with real-time analytics and rich visualizations. It brings together your logs, metrics, and traces in one place, making it easier to get to the root of a problem and fix it quickly. Plus, its smart, machine learningalerts cut through the noise so your team can stay focused on what really matters—stopping issues before they impact users.
Open-source AMP tools
A strong open-source option for monitoring is to combine Prometheus and Grafana. Prometheus is fantastic for collecting metrics as well as alerting, and Grafana can visualize this data in several different and flexible ways. More configurable than its mainstream counterparts, this setup allows customization to the fullest.
Elastic APM helps with application performance monitoring. It easily fits with the current ElasticSearch deployments for log management and provides distributed tracing between services.
Cloud-native Solutions
AWS CloudWatch Application Insights is responsible for automatically monitoring applications on AWS resources. It has deep integration with other AWS offerings and gives recommendations specific to the AWS environment.
Google Cloud Operations (previously Stackdriver) provides monitoring, logging, and APM for Google Cloud or hybrid environments. Because this tool is closely linked with Google Cloud services, it gives more transparency for GCP workloads.
Azure offers Azure Monitor Application Insights for applications hosted on its platform. It provides AI-powered analytics to help identify anomalies and diagnose issues, and it offers codeless instrumentation options.
Conclusion
Organizations that rely on dependable, high-performance software need APM as an integral part of their processes. As applications become more complicated and users have higher expectations, tracking, analyzing, and improving performance become a problem of competition. Succeeding with APM means choosing the right tools, using the right metrics, and building the necessity of cross-team collaborations on performance exercises.
Using APM as a continuous discipline instead of a knee-jerk reaction enables you to spend less on operations while also continuing to deliver great experiences reliably. These investments in all-in-one monitoring then pay dividends in the form of happier customers, higher conversion rates, and better allocation of technical resources.
This post was written by Ridhima Goyal. Ridhima is a talented and motivated Software Development Engineer II (SDE2) with a strong passion for development and innovation. She excels in creating efficient and effective software solutions, always striving to push the boundaries of what’s possible in her field. With a keen eye for emerging trends and technologies, Ridhima consistently seeks out opportunities to enhance her skills and contribute to cutting-edge projects. Her enthusiasm for innovation drives her to explore new methodologies and tools, ensuring she remains at the forefront of software development practices. Ridhima’s dedication to her craft and her ability to think outside the box make her a valuable asset to any development team.
