
As monitoring aficionados, our toolbox sports an embarrassment of riches, from configuration management to logging, and from synthetic transaction solutions to application tracing and monitoring. It could be argued that cloud-based application monitoring (or APM) tools are the most plentiful and, to a certain community of IT practitioners, the most essential, providing crucial information to help you ensure service uptime and optimal performance. But with so many tools on the market, which ones should you be using?
After doing a bit of digging, some research, and no small amount of testing, it’s become clear to me that this is less about finding the “best all-around APM tool” as it is figuring out which tool is right for a specific use case, business niche, and budget.
That’s what I’m doing in this post—I’m not going to try to list out each of the open-source, free, freemium, or paid tools that are out there. Instead, I’m going to look at a few of the most common use cases and offer up my best choice in that category. My hope is that this will help give you a leg up on your own process, whether you are just starting to dig into finding an APM tool that meets your needs, or you already have one that you might have outgrown.
- What Is Application Monitoring or Application Performance Monitoring (APM)?
- Use case #1. The All-Around Best Application Monitoring Tool
- Use case #2. Best Application Monitoring Tool for the Cost-Conscious
- Use case #3. Knowing What’s Happening Now
- Use case #4. Staying in the Walled Garden
- Use case #5. Hybrid IT Flexibility
What Is Application Monitoring or Application Performance Monitoring (APM)?
Application monitoring is the process of measuring and analyzing the performance of your software applications to ensure their high availability and satisfactory end-user experience. Application performance monitoring helps to ensure your mission-critical applications are performing smoothly and running at an optimum level. For achieving and maintaining certain levels of service, your applications need to be monitored continuously using advanced application monitoring tools. The tools analyze, detect, and diagnose the complex problems degrading or interrupting your app’s performance and uptime.
In the past few years, APM has become increasingly essential for IT professionals, including IT admins, IT operators, developers, and DevOps teams. Integrating application monitoring capabilities into your existing infrastructure should be an integral part of your IT strategy. APM technology is used to gain actionable insights into application performance metrics and business processes with extending capabilities of IT operations management.
A few examples of application performance monitoring are:
- CPU utilization and server monitoring where your applications are hosted and running
- Analyzing access logs of your webserver to compare the number of user requests received versus the amount of time taken to respond to those requests
- Tracking error rates of your every app
- Network traffic monitoring to detect application downtimes
- Measuring and analyzing key performance metrics against app dependencies on programming languages and services like Redis, Elasticsearch, SQL, etc.
- Web application or website monitoring using an analytics platform (e.g., Google Analytics) to check and identify pages with slow speeds also falls under application monitoring.
An application’s performance is usually monitored and measured with two sets of metrics where the first set measures the performance and experience your app is delivering to end users while the second set of parameters analyzes the resources used by your application for computing purposes.
The first set of metrics include:
Application load time, which is the time an app takes to process the volume of transactions, such as requests per second, transactions per second (TPS), or pages per second. It’s an important performance metric to measure your end-user experience—the less time it takes an app to start up, the more satisfactory the experience. It’s essential to monitor all your applications once they’re running live at the client’s server. Developers usually don’t face performance issues during the development phase as the app doesn’t need to be loaded for processing computer-based demands in systems where it’s being built like calculations, searches, and other transactions. Application monitoring tools allow you to check applications slow to load, indicating system issues, coding errors, resource bottlenecks, etc.
Another critical metric is the response times of your applications, defined by the time each app requires to respond to an end user’s request or action even during overloaded situations.
The second set of performance indicators measure:
Cloud or on-premises resources used by your applications for computation. APM tools monitor apps for load efficiency. They check if an app has sufficient capacity to support loads during different scenarios. These tools also look for potential hotspots or locations where performance bottlenecks are likely to arise.
These metrics are defined to achieve a standard baseline for the application performance and help identify any changes or loopholes in case the app behavior deviates from the baseline. This performance baseline is useful for external event correlation and predictive analysis of your app’s future performance.
Applications failing to comply with the metrics and parameters lose their reliability factor, leading to frustrated users who’ll no longer use your software applications.
Use Case #1: The All-Around Best Application Monitoring Tool
With monitoring tools in general, and APM tools specifically, there’s no such thing as “one size fits all.” However, there is a “one-size-fits-most,” and that would be AppOptics™. Part of my reason is that this application monitoring tool acts as both a telescope and a microscope to your code execution, showing you how it’s operating as it moves through your environment as a whole, and also enabling you to drill all the way down to individual lines of code to tell you which specific function calls are affecting overall performance and user experience.
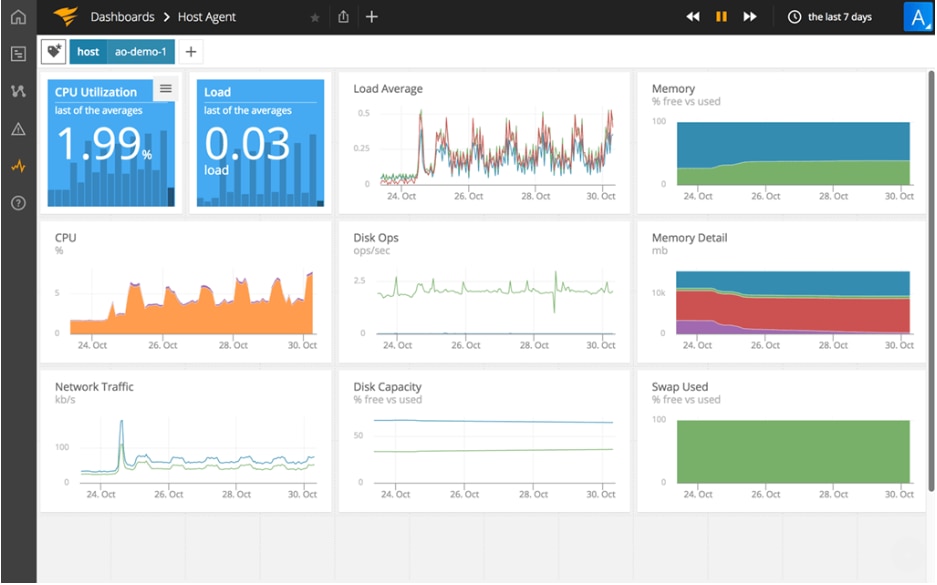
But another reason why this is my go-to APM solution is that it’s part of the SolarWinds ecosystem—a set of solutions that covers everything from pure network and server monitoring to niche functions like storage, IP address, database, and configuration management, to security solutions that run all the way from on-premises into the cloud. For the more bullet-minded among readers, the advantages of AppOptics include:
- Metrics, tracing, and exception tracking
- Broad language support (Java, Go, .Net, PHP, Python, Ruby, Node.js, and Scala)
- Infrastructure monitoring along with application monitoring
- Seamless switching and integration of into other parts of the SolarWinds ecosystem (Pingdom®, Loggly®, Papertrail™, etc.)
You can find out more about AppOptics here.
Use Case #2: Best Application Monitoring Tool for the Cost-Conscious
When the purse strings aren’t just tight—the purse has been sewn up and thrown into a vault—I turn to the open-source mainstay Sysdig. Built with containers, microservices, and cloud in mind from the beginning, Sysdig allows you to capture system state and activity from a running instance, then save, filter, and analyze. This allows you to create rules to watch those data streams and effectively monitor, track, and secure your containerized resources on the fly. Sysdig is scriptable in Lua and lets you work either from the command line or via an interactive UI. Sysdig has been described as “strace plus tcpdump plus htop plus iftop plus lsof plus awesome sauce. With state-of-the-art container visibility on top.”
Check out more on Sysdig here.
Use Case #3: Knowing What’s Happening Now

Like AppOptics, New Relic displays everything from the end-user experience through servers down to the lines of application code. With support for Ruby, PHP, .Net, Java, Python, Node.js, iOS, and Android; and plugins for Oracle DB, MySQL, Microsoft SQL Server, Citrix NetScaler, PostgreSQL, Apache HTTPd, Nginx Web Server, Amazon Web Server—as well as monitoring for mobile platform applications—it covers a lot of ground. It can also perform synthetic transactions, so you can test application behavior even when nobody is on the system. But its shining feature is the ability to capture and report a high level of exceptions per minute per service. However, this all comes at a price. Literally. New Relic is a tool I use when the situation calls for it and the budget can support it. The reason I put this in the use case for “when I need to know NOW” is because of its data retention. The most you’re going to save is eight hours. So, you get a great level of insight, but you need to know going in that the data will not stick around for end-of-month or end-of-year forensic activities.
You can learn more on New Relic here.
Use Case #4: Staying in the Walled Garden
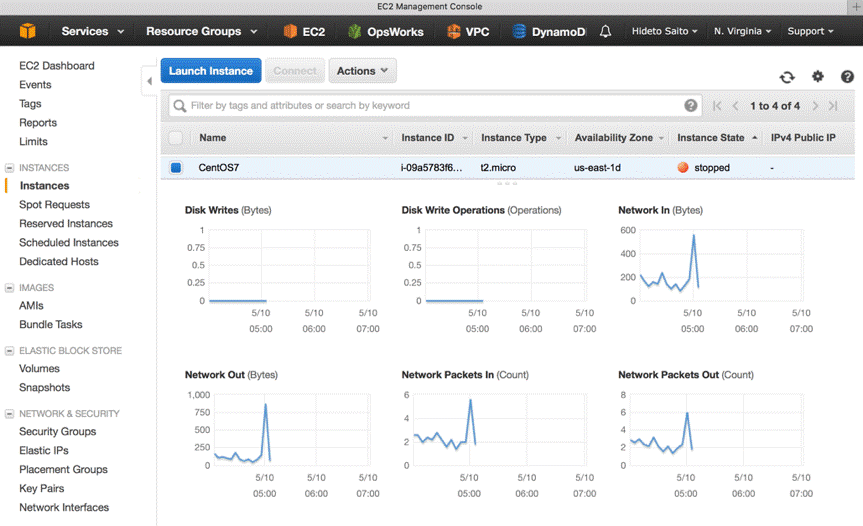
There are times when the situation calls for keeping everything as tightly contained as possible—when you want to minimize outside influence/interactions. In those cases, going with the cloud vendor’s own monitoring options is the best choice. CloudWatch is what AWS offers for monitoring and management, pulling performance data from AWS components and the applications running on the Amazon infrastructure. Basic monitoring is free, with paid tiers to augment that insight to include more detailed monitoring, custom metrics, and more. Obviously, the biggest limitation is that this is only for Amazon infrastructure, so if you have a multi-cloud application, this isn’t going to fit the bill.
Amazon has more information on CloudWatch here.
Use Case #5: Hybrid IT Flexibility
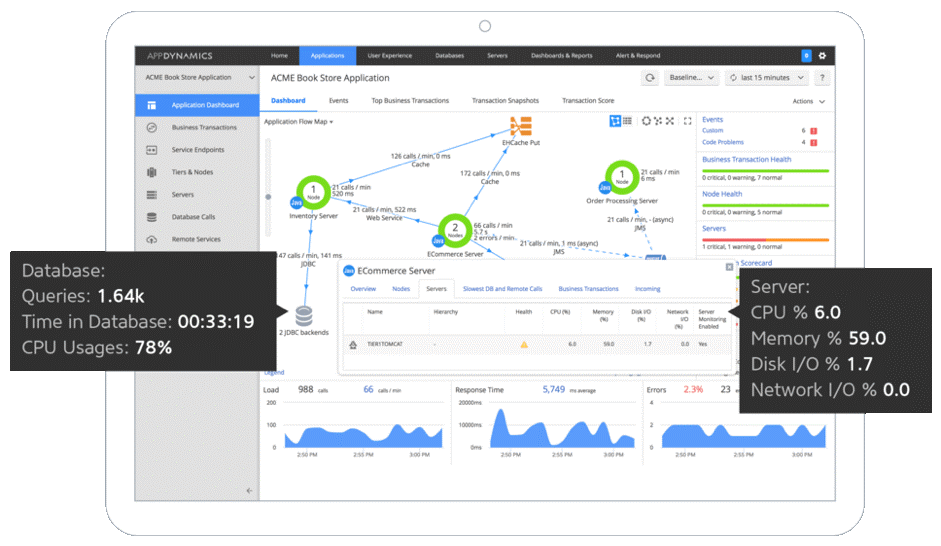
When it comes to application tracing and monitoring, some products are intended to be cloud based, others are provided as software-as-a-service (SaaS), and still others are meant to be installed on-premises. When an application or environment straddles two or three of those areas, it’s considered “hybrid IT” and can present its own challenges from a monitoring standpoint. AppDynamics allows you to install their software in any of those three configurations, and that’s why I use it for this specific use case. With built-in support for applications running on Android, iOS, Browser, Java, NET, PHP, Node.js, SQL, and NoSQL, and modules to provide insight into application performance, end-user experience, infrastructure visibility, and business services, this solution is well-suited to larger enterprises with elements spread across both geographic locations and platform types.
Find out more about AppDynamics here.
The Verdict: Best Application Monitoring Tool
As I hope I have showed in this list of top application monitoring tools available on the market ranked by what issues they best solve, there are tools out there to fit almost any use case. Regardless of whether you just started your search for the right application monitoring tool to solve your pain points or already have a tool but are curious what new or better options are out there, I recommend trying out a well-rounded APM tool like AppOptics for its simplicity and wealth of integration options at an affordable, per host price model.