Wondering how to check logs from your servers, and why? Whether web servers, application servers, file servers, or another type, your servers constantly generate log files based on activities and events, and your ability to review these files is the key to fast, effective troubleshooting. Server log files offer “behind the scenes” views into server activity, so you can get a line-by-line breakdown of what happened and when.
Of course, knowing how to check server logs manually in raw form can be difficult, especially if you’re trying to pinpoint issues within hundreds or thousands of log lines. I suggest using an automated tool, like SolarWinds® Log Analyzer (LA), to collect, analyze, and visualize your server logs, all in real time.
What Are Server Logs and Why Do They Matter?
Your systems and applications, including servers, automatically generate logs as events occur. Any number of services may generate logs. For instance, backup software produces logs that give you insight into the backup process. Servers constantly produce log files admins can check to view unprocessed data about relevant server activity—for example, you might check a web server to learn about site traffic. Server log files can also offer admins the granularity and insight they need to perform effective troubleshooting.
Because log files record a range of activities and events, admins can dig into log files to obtain a complete “behind the scenes” view of what happened before and after a problem occurred. Several log file types can be useful for this kind of troubleshooting. On web servers, for instance, access logs relate to site visitors, agent logs record web client requests, error logs show failed server requests, and referrer logs provide information about what webpages refer traffic to your server.
How to Check Server Logs
If you’re considering how to check server logs when needed, simply opening a server log file is typically a straightforward matter. In some cases, there are bureaucratic difficulties related to accessing server logs, as they may be assigned strict security limitations, but I’ll assume you have the access you need to work with server log files. The more important question is, how to check server logs in the easiest and most efficient way possible?
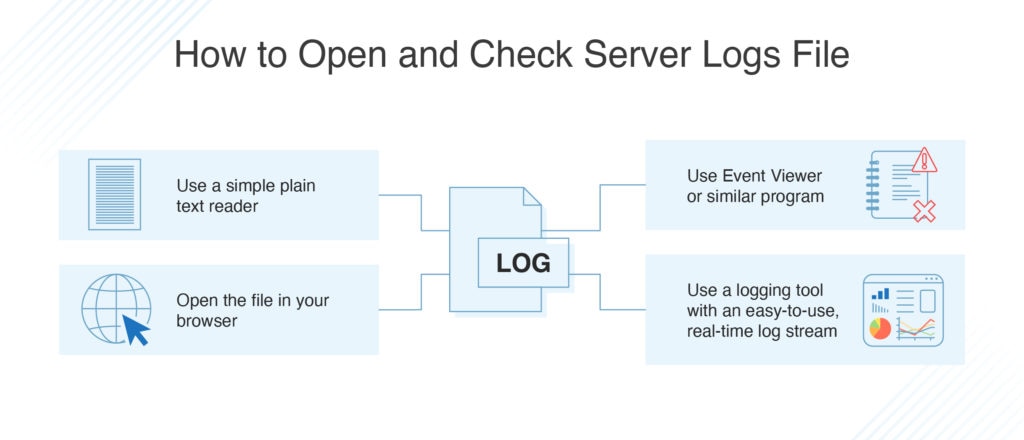
It’s possible to open these files manually using programs you already have on your system. Many log files are recorded in plain-text form, which means you can use a program like Notepad or Microsoft Office to open and view a server log file. Double-click on the log file and it will likely open in a text program by default, or you can choose the program you’d like to use to open the file by using the right-click and “Open With” option. Another option is to use a web browser and open the server log file in HTML. You may need to drag and drop the file into a tab within the browser window.
Another option for reading Windows server log files is through Event Viewer, a utility software with more functionality than the above options. On a Mac computer, you can use the Terminal app, a command-line program (that requires familiarity with Unix commands), or the Console app, which is similar to Event Viewer. Simply locate the appropriate program on your server and open it in administrator mode. From within the interface, you can click through the appropriate folders to find what you’re looking for.
You’ll find an array of information recorded within server logs, which capture events like requests from other computers, server responses, and internal server processes. Typically, you’ll want to look at access logs and error logs first. For instance, check access logs if you want to know about requests made of the web server, including viewed pages, request success, and response time.
Of course, once you open a server log file, the next step is to decipher the file itself. Plain text or common log format (CLF) are common, if not easily readable. A log will typically show the timestamp and include some information about the event, typically in the form of terms, codes, or numbers. For instance, the term “GET” refers to a particular action, while “200” means the task is completed. It takes some research and practice to correctly read raw log lines.
In Event Viewer, reading server logs can be a bit easier, but still requires some digging. Each event has a unique ID you can use to investigate log information further. Within Event Viewer, you’ll also find server log files sorted into a few different categories, including application, system, and security logs. You are also likely to see errors and warnings. These may be minor, as small errors in any system are common, but if you’re troubleshooting a problem, you can use these indications to get to the bottom of the issue.
What your server log files contain, or where they’re located, may depend in part on what server you’re using. For instance, if you’re using Apache, you have some options for how you’d like server logs to display, making the process of how to check logs a bit different. With Apache, you can set specific parameters for logging activity. For instance, you can set severity level guidelines, so only critical logs are sent to a particular file. You can simply check server logs in that file for a faster overview of critical errors. Apache also allows you to control some formatting options, so you can use the LogFormat directive to specify formatting beyond the default CLF. You can choose to include multiple fields, including HTTP status codes, URL paths, client IP address, and more. When you get started with how to check logs, you can ensure the information you need will be within the logs.
With a web server like Apache, you have access to data about your sites, users, and the server itself, and you gain ways to customize log organization, but it can still take some effort to extract data from raw logs. If you’d like a server logging solution designed to streamline the process and makes your life easier, an automated tool for aggregating and analyzing logs is your best bet.
Choosing a Logging Solution for Server Logs
Although it’s possible to open and check server log files manually using a basic program, these are not the most effective or efficient option. An automated logging solution provides much greater functionality, making it simple to not just open server log files, but collect, filter, and analyze them in a way that enables troubleshooting.
SolarWinds Log Analyzer is designed to collect log data from across your system, so you can more easily gain the insights you need. Log Analyzer integrates with other SolarWinds products to enable broad insight in your nodes, and is built to collect an array of log data formats, including syslog, SNMP traps, Windows event, and VMware events.
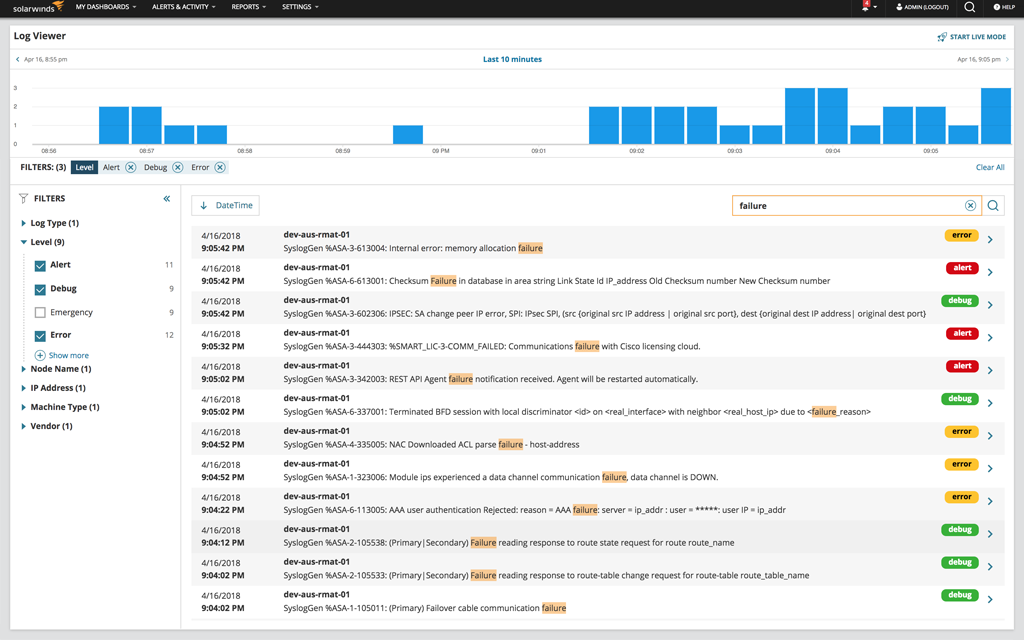
Once the log data is collected, Log Analyzer makes it easy to put it to use. There’s no need to manually open and check server log files individually. Instead, you can enjoy a real-time, interactive log stream to discover the logs you need to see. Log Analyzer also offers interactive charts for quick visualizations of your search results, log volume, and more.
Sorting through many server logs doesn’t have to be difficult. Log Analyzer offers out-of-the-box filters designed to make it easier to sort your data and start your forensic analysis. Use color-coded tags to better filter your log data and quickly pinpoint performance issues.
Log Analyzer speeds troubleshooting by making it easier to view and parse through logs. But it is also built to speed the process by offering built-in alerts. Typically, an admin would need to be proactive in manually sorting through logs and looking for relevant error messages. But with Log Analyzer, you’re notified automatically of potential issues and can act much more quickly.
Make Logging Easier Today
With the above insights, you should have a sense of how to check log files through manual means. But if your business needs ongoing logging capabilities, manual methods won’t get you very far. With a dedicated logging solution, you can gain deeper insights into your logs and achieve faster troubleshooting. There’s no reason to wait to make logging easier—the free trial of SolarWinds Log Analyzer is fully functional for 30 days. You can download the program, discover devices, and enjoy automated log aggregation and handy filtering and tagging tools designed to make it easier to stay on top of server log anomalies and ensure your systems stay operational.