
In 2015, we reviewed the must-have free systems and server monitoring tools, but (as everyone knows) the landscape has changed for monitoring, free tools, and IT in general. So, I think it’s time to review and update those old choices and possibly add a few new tool reviews into the mix.
Just in Case
It’s not always the server’s fault. Sometimes it’s the network. If you’re on the hunt for a free tool that can show you if your packets are passing, your routers are routing, and your NetFlow is flowing, you may want to check out my list of must-have top free network monitoring tools.
Laying the Foundation
To build application infrastructure, you start with an architecture, draw the design, then analyze and choose the platform(s) that best fits. Because most organizations live or die by their applications (whether it’s critical internally or for external customers), having the right set of tools to monitor and manage your server environment is critical. Even so, budgets aren’t infinite, and sometimes management mistakenly thinks they can do without because, “Everything’s running great right now, and we’ll know if it doesn’t, right?”
That’s all great, but how do you pick out the best server monitoring tools in a field of hundreds? Today, there are commercial products, freeware tools, and open-source software to choose from. While the debate about free versus commercial goes on, there are well-recommended, free server and systems monitoring tools that many sysadmins swear by. In this server monitoring tools guide, I’m sharing some of my favorites with you below.
But first…
Open-source monitoring solutions often require significant investments to learn, install, configure, and use. Another thing to consider is security, which may become an issue depending on the tool and your company’s guidelines for security. Finally, many open-source solutions don’t scale past a single server. When you’ve grown past what one polling engine can do, you have to stand up an entire separate solution (complete with a separate database) rather than federating an additional poller into the existing environment.
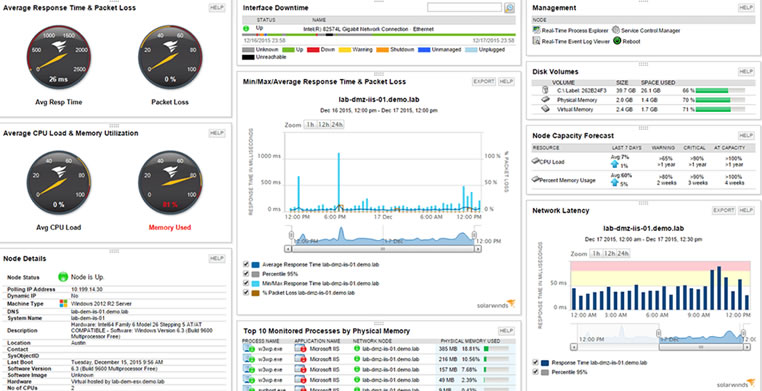
When we need a server monitoring tool that is easy to install, and supports monitoring and reporting out of the box, we like SolarWinds® Server & Application Monitor (SAM). SAM acts as a single pane of glass to provide complete and comprehensive server, application, virtualization, and infrastructure monitoring capabilities that complement some of the essential free tools you may already use.
What’s on my list?
There are many popular, widely used systems and server monitoring tools. Deciding which tool suits you needs best depends on what kind of infrastructure you want to monitor, how much of the stack you want to monitor, and how much time and resources you have to invest in building, integrating, and customizing a free server monitoring tool versus investing in a commercial product.
Open-source tools are sometimes too basic to monitor a system on which a business relies. On the other hand, they can be useful toolkits that a development team can use to build exactly the type of monitoring tool they need. Of course, that team would have to have one or more members willing to manage and maintain the monitoring system they build.
Before spending a significant portion of your IT budget on application and server monitoring tools, consider this list of the best free systems monitoring tools available today for monitoring your IT needs and environment.
✔ Nagios Core
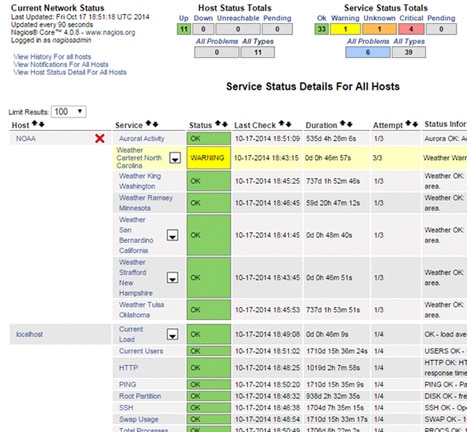
Nagios® is a widely used open source tool for monitoring server and network performance. Many IT pros consider Nagios to be cost-effective and customizable, and appreciate being able to seek support from its user community. However, one of the biggest obstacles is getting past the initial setup phase. Nagios can be complicated to install, set up, and configure. Once this is done, the tool offers metrics to monitor server performance, remediate services, and reporting. Nagios Core provides only limited monitoring capabilities, unlike Nagios XI, which is a commercial tool with added features. If you are comfortable setting up your own custom dashboards, or have time to learn and master everything Nagios has to offer, it can very well be the solution for you.
✔ Ganglia
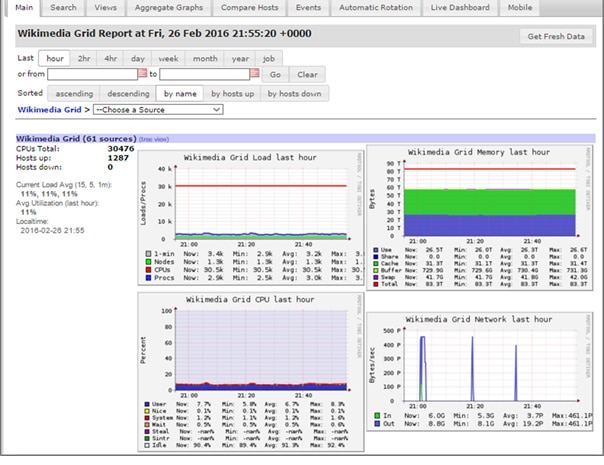
Ganglia is an open-source (BSD license) monitoring system designed especially for high-performance computing systems, such as clusters and grids. It has a scalable and distributed architecture based on a hierarchical design targeted at federations of clusters. It leverages widely used technologies, such as XML for data representation and XDR for data transport. One of its goals is to engineer data structures and algorithms for maximum efficiency, resulting in overheads for each node.
It’s a solid monitoring platform that supports many operating systems and processors. Large clusters around the world use the platform, especially in university settings. This is not surprising given the fact that Ganglia evolved out a project at the University of California, Berkeley and was funded in part by the National Science Foundation.
✔ CollectD
CollectD is a popular open-source daemon, which collects basic system performance statistics over time and stores the data it collects in multiple formats, such as the RRD files that Cacti can use to graph the data.
CollectD is written in C++ and is available for multiple operating systems. There are a number of plug-ins for various systems that allow you to collect data beyond the essential system metrics, such as CPU and memory. CollectD is commonly used to find performance bottlenecks, monitor and predict system load over time, and create alerts.
CollectD is commonly used in DevOps projects as an industry-standard, open-source collection agent. It is usually integrated with a graphing tool, such as Graphite, Grafana, or Cacti.
✔ Spiceworks
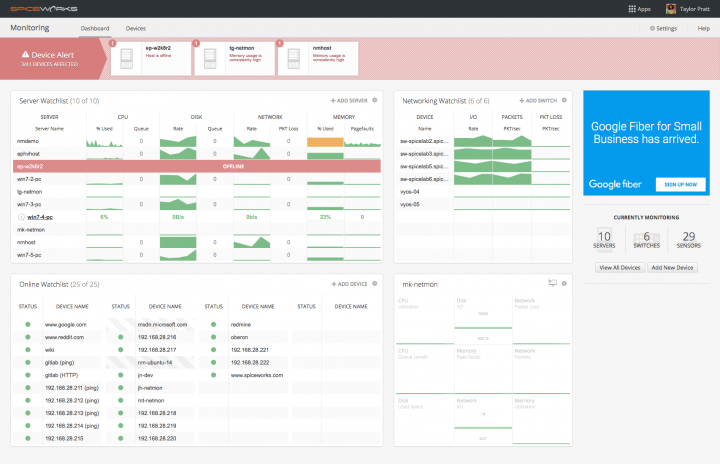
Spiceworks has several free IT tools in addition to the server monitoring solution I’m focusing on here. The Spiceworks free monitoring tool can provide insights to many aspects of your infrastructure, such as servers, switches, SNMP devices, and services.
It is important to note that there are display ads within the free tool that provides revenue to Spiceworks. While that’s a small price to pay, it is something to think about before installing.
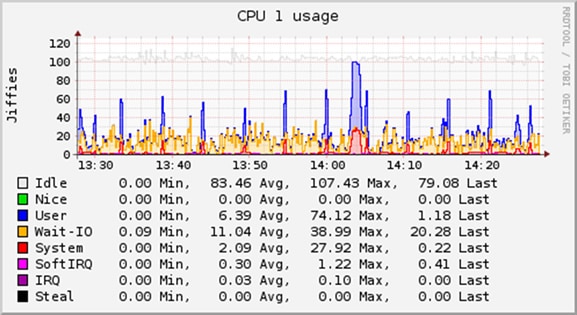
✔ Cacti
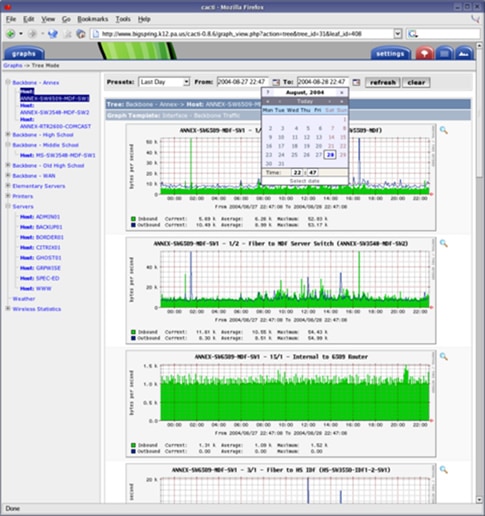
Cacti is mainly a front end graphing tool for system data, but it can also handle data collection. Data gathering happens in a cron job via an external script that feeds metrics, which Cacti stores in a MySQL® database.
Cacti leveraging on RRDTool, an open-source data logging and graphing system for storing polled data, can generate any type of graph for any dataset. You can create all kinds of graphs that can be displayed and organized in a number of different ways by collecting data from almost any infrastructure element, including load balancers and servers. The graphing used in Cacti is the standard used by many open-source and commercial tools. Cacti also works with user permissions, allowing certain users access to specific charts or graphs.
Cacti’s strength lies in its community of developers who have contributed many plug-ins, scripts, and templates that can be used to monitor almost every type of device.
✔ Zabbix
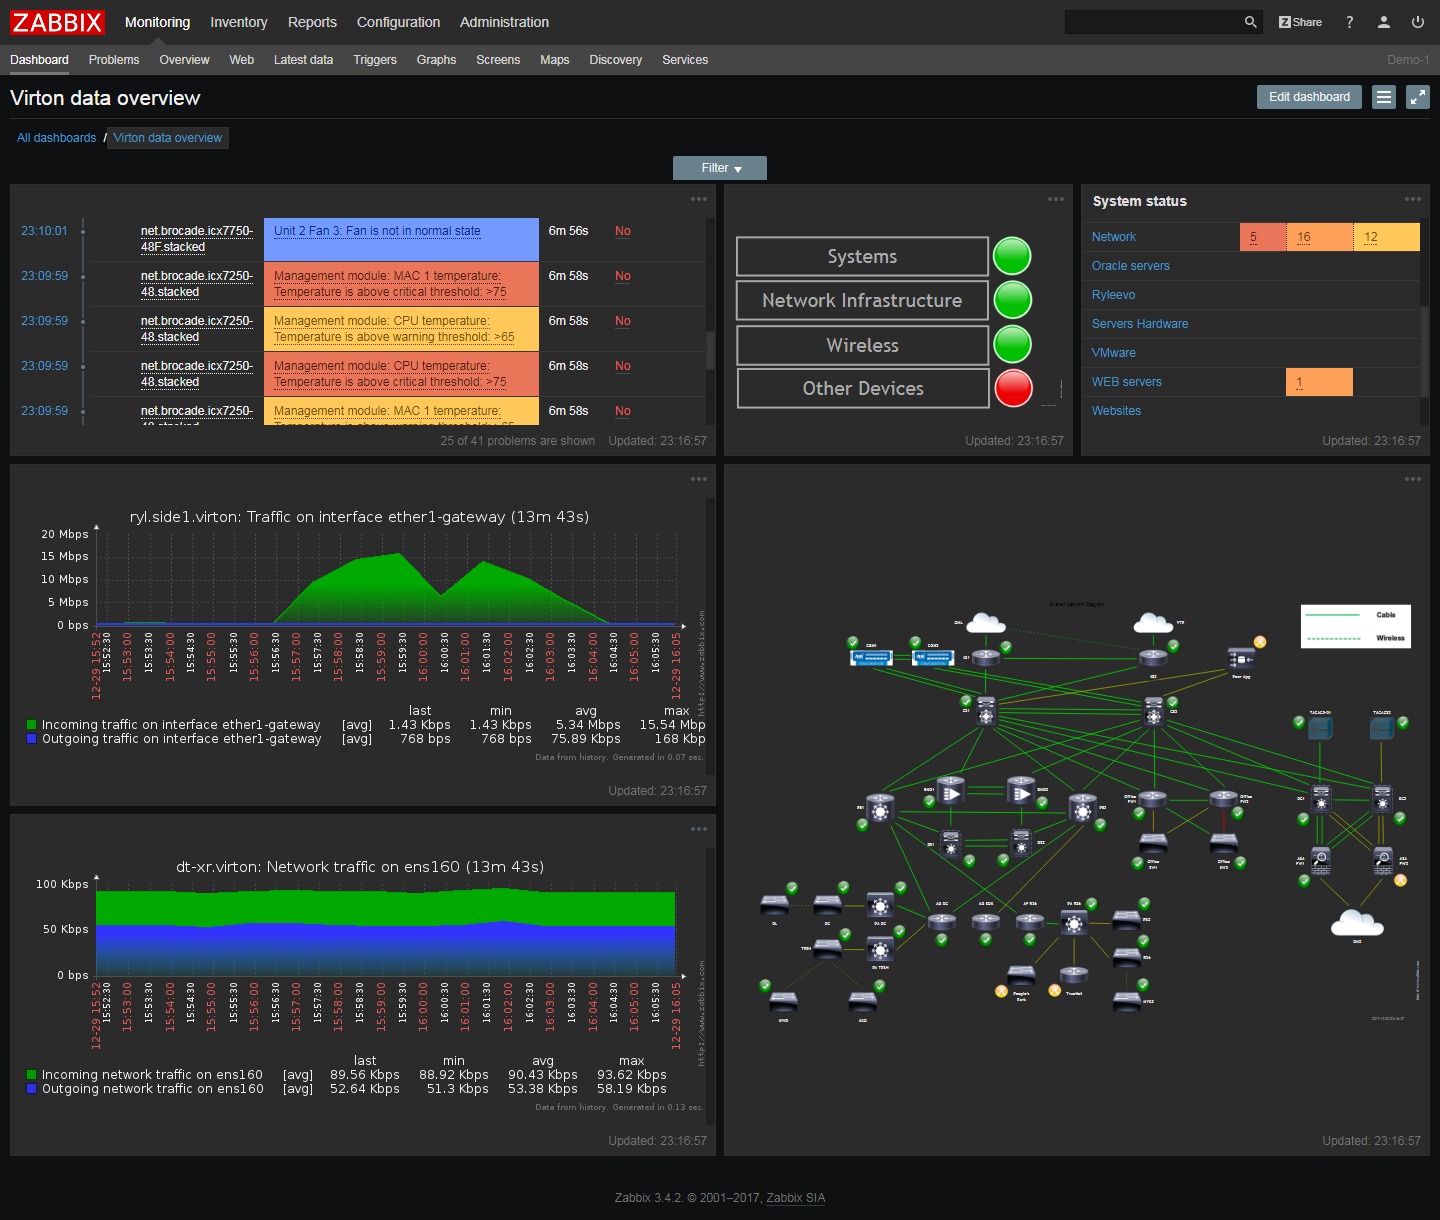
Zabbix is an enterprise class solution that is written in PHP, fully equipped with many useful features, and has an option for (non-free) commercial support.
Zabbix allows users to agentlessly check the uptime and response time of remotely-responding services like SMTP or HTTP. For on-system statistics like CPU, network utilization, and disk space, you use SNMP. For asset and hardware information like temperature, fan speed, etc., there’s an “IPMI” agent that needs to be installed on the target device. Data is stored on MySQL®, PostgreSQL, Oracle®, or SQLite database platforms.
✔ Icinga
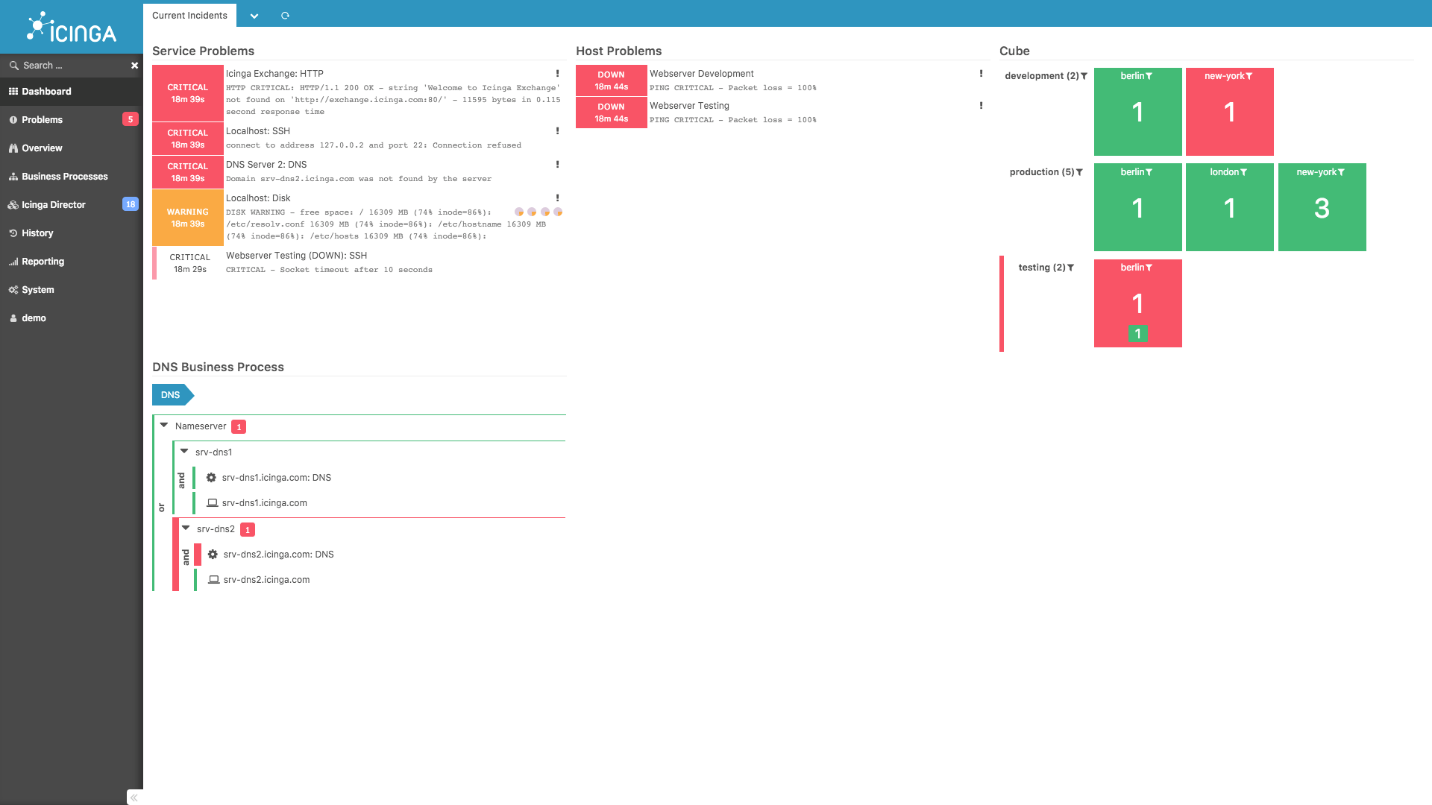
Icinga was originally created as a fork of Nagios, but the tool has added many new features over the years. For example, it offers more database connectors (for MySQL, Oracle, and PostgreSQL), as well as a REST API. Using this new API feature, sysadmins and users can easily integrate numerous extensions without modifying the Icinga core directly.
Using all the usual suspects (SMTP, POP3, HTTP, NNTP, ping, etc.), Icinga can collect data on host resources (like CPU load and disk usage) across a wide range of device types (switches, routers, temperature and humidity sensors, etc.). Alerting options include email, SMS, and user-defined methods that can be scripted on the Icinga server.
✔ OpenNMS
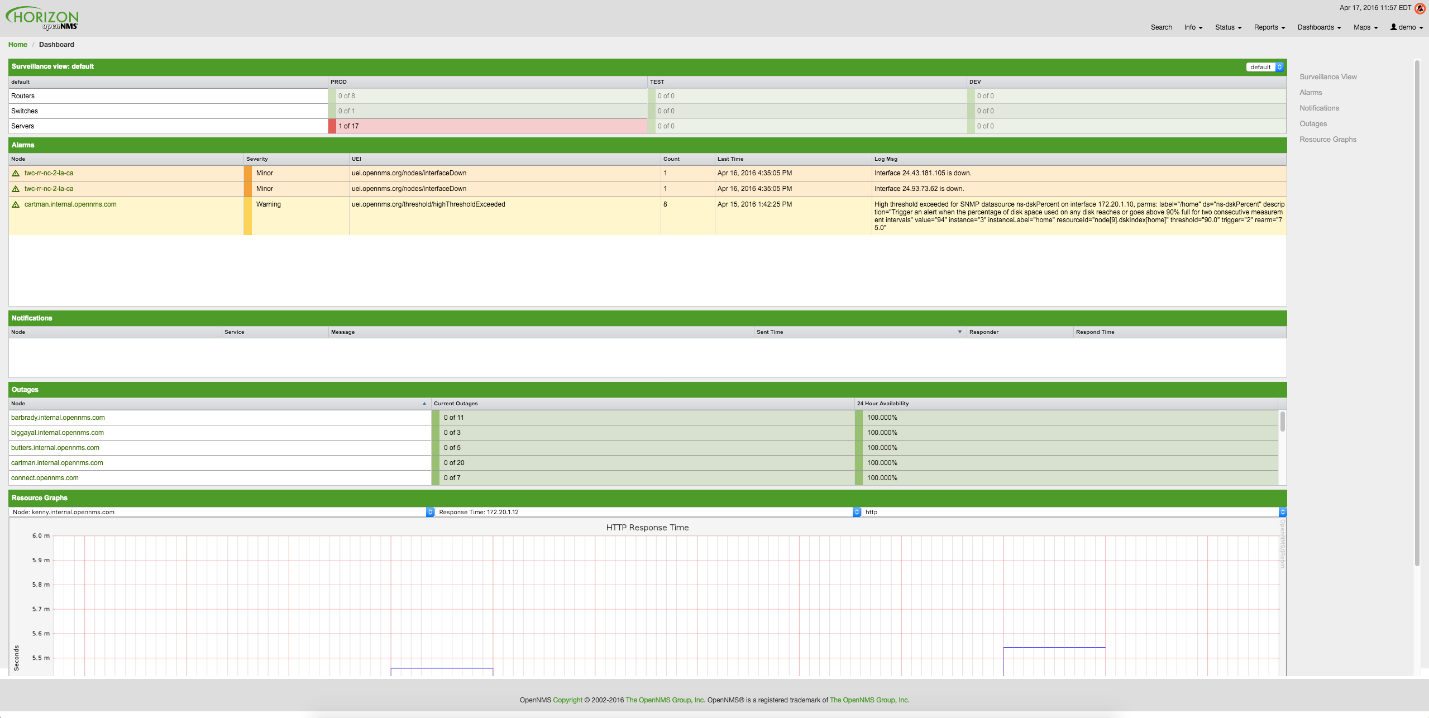
Another “freemium” monitoring option, the free version of OpenNMS is limited to 10 devices, a single user login, and only supports basic server monitoring functionality. That said, OpenNMS lives up to its billing as an enterprise-class solution, with the ability to monitor a wide range of hardware, operating systems (Windows, Linux®, Solaris, and more), and virtualization platforms (VMware®, Hyper-V®, Citrix XenServer).
✔ WhatsUp Gold
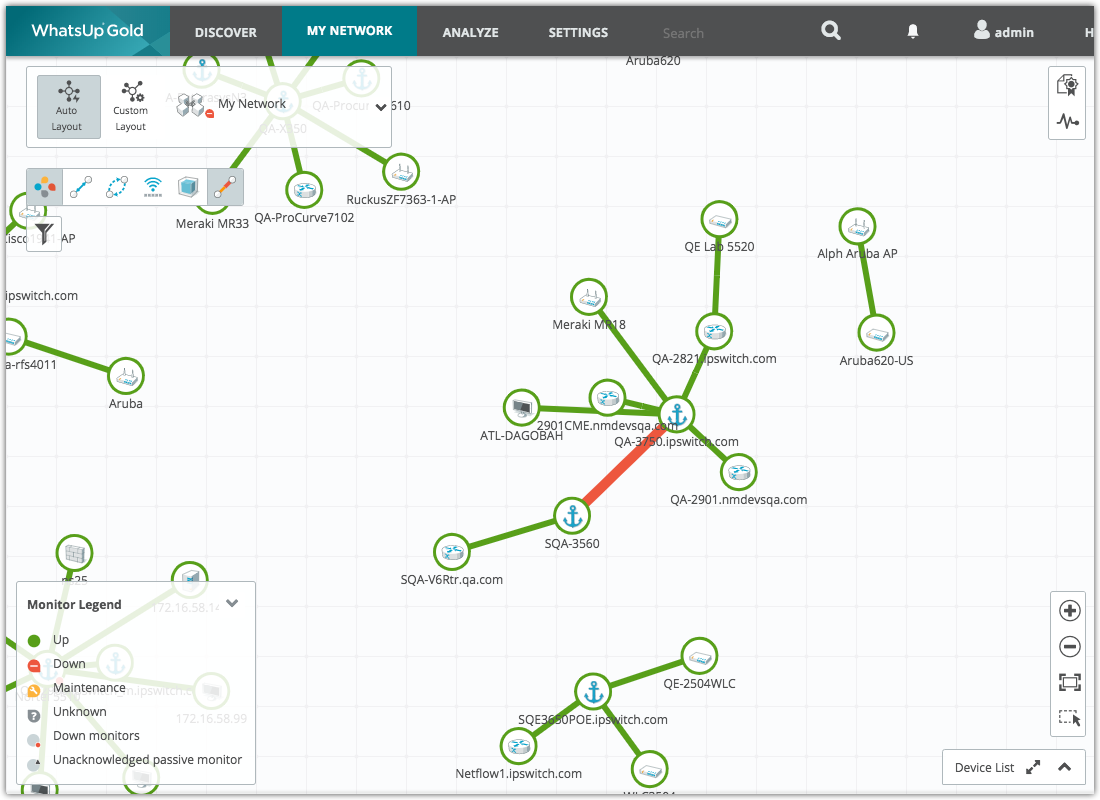
For many IT professionals, their first foray into the world of monitoring begins with this toolset. While many IT pros find that they outgrow the abilities of this tool almost as soon as they get it installed, it’s still a good option to ease into the water. With a clean interface and the ability to discover, map, and display most of the devices that are typical to small and medium-sized businesses, along with some nice-to-have capabilities, such as network device config backups and the use of WMI on top of the usual SNMP and ping for data collection, it’s a good go-to option for teams and departments that aren’t sure where else to turn. One caveat: the free version of WhatsUp Gold only supports five devices.
Free Server Monitoring Tools
“Free as in Beer” – Richard Stallman
While I focused on the most popular sever monitoring tools in this post, up until this point they have been more “freemium” vs free. Freemium means that the tool provides limited features (or support) for free, and any additional features, support, or offerings are available for an added cost.
So, I wanted to make sure I also touched on free serving monitoring tools that are actually “free.” These free tools do a particular task very well at no cost (well, maybe with the exception of some ads during installation).
My list below isn’t meant (or even appear) to be exhaustive. There are many, many useful free server monitoring tools out there. I’m simply listing the ones I find myself using the most often.
✔ SolarWinds Server Health Monitor
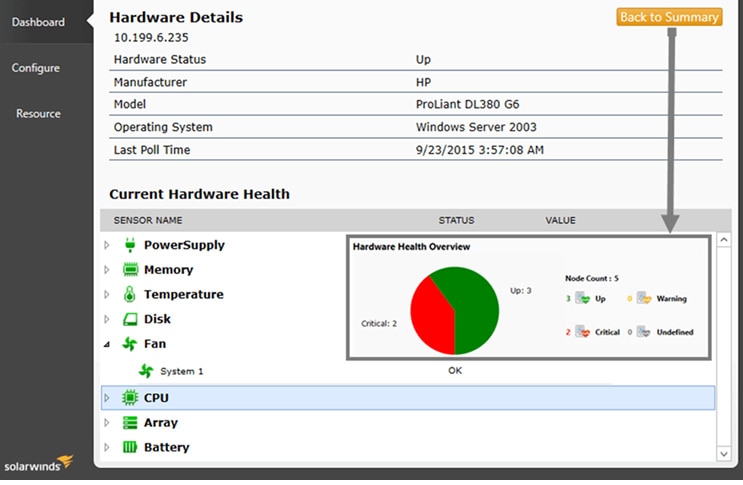
This free monitoring tool tracks the health, status, and availability of server hardware in minutes. It lets you see the status and performance of critical server hardware components, such as fan speed, temperature, power supply, CPU, battery, and more. With it you can quickly identify server hardware issues impacting server and application performance. It lets you monitor the status and hardware health metrics of Dell® PowerEdge™, HP® ProLiant®, IBM® eServer xSeries servers, and VMware ESX/ESXi hypervisor.
✔ Storage Performance Monitor
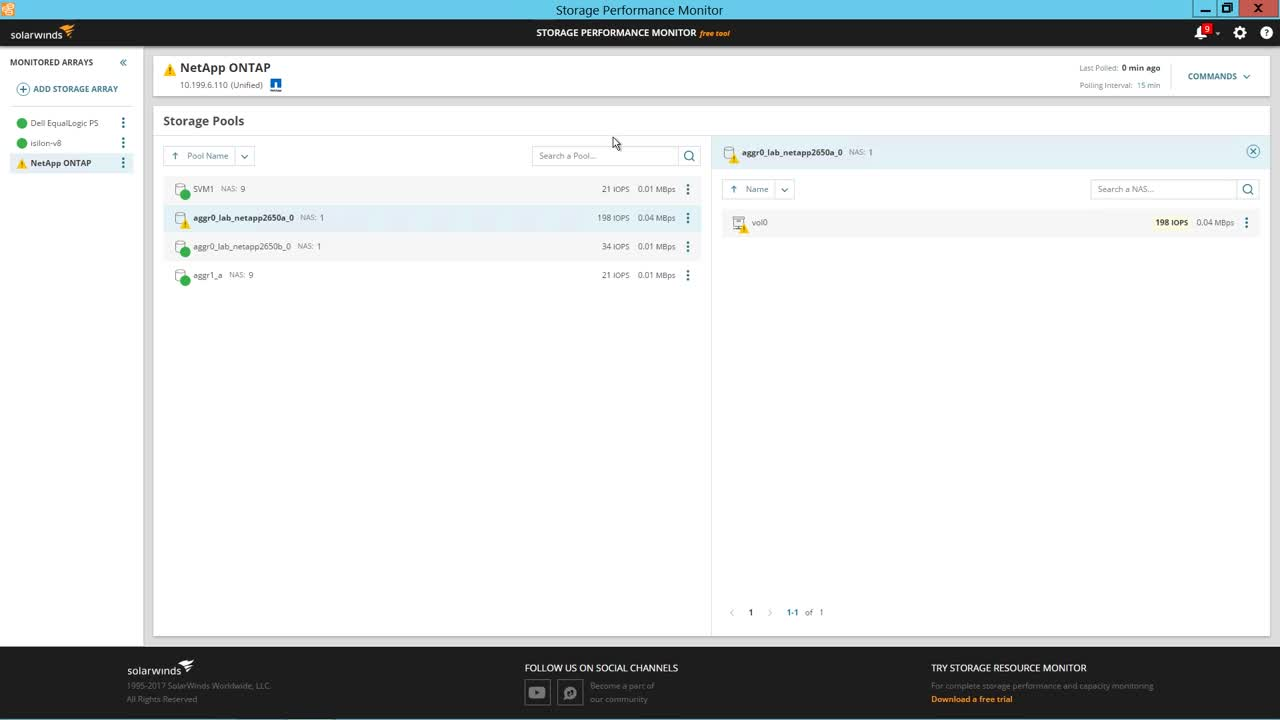
Storage is one of those areas of the infrastructure that touches almost everything else, where an error can have wide-reaching impacts and implications, but which seems like a black hole to many IT pros. This utility gives you quick, simple visibility into storage arrays and helps surface the common errors that can otherwise be confounding to pinpoint and resolve.
✔ Exchange Monitor
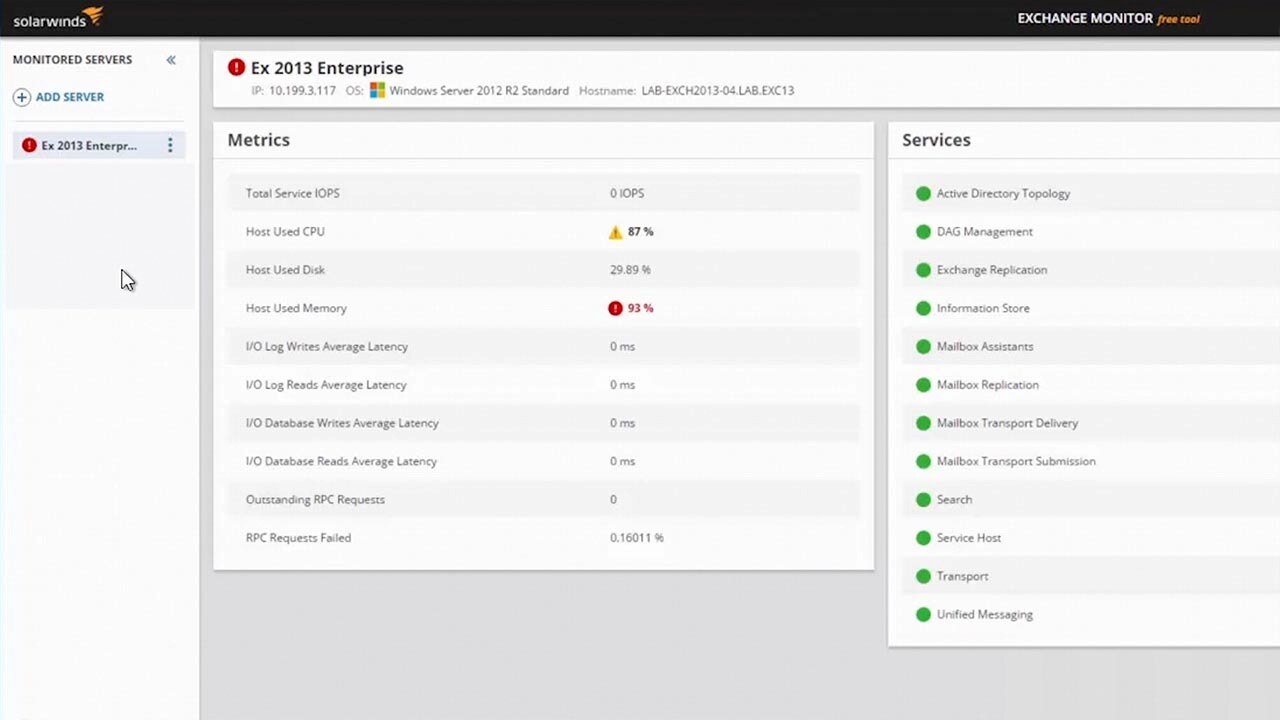
I’ve long said that in every organization, there are a bunch of applications, and two “religions”—applications so important that if they are impacted in any way, all work comes to a halt. One of those “religions” is unique to the business—it might be the CRM tool, the supply chain forecasting system, or the software that runs the production line. The other is always email. And Microsoft® Exchange™ is the nearly ubiquitous platform on which corporate email runs. While many enterprise-class system and application monitoring solutions include support for Exchange, this free utility does the job singularly and without any additional frou-frou.
✔ WMI Monitor
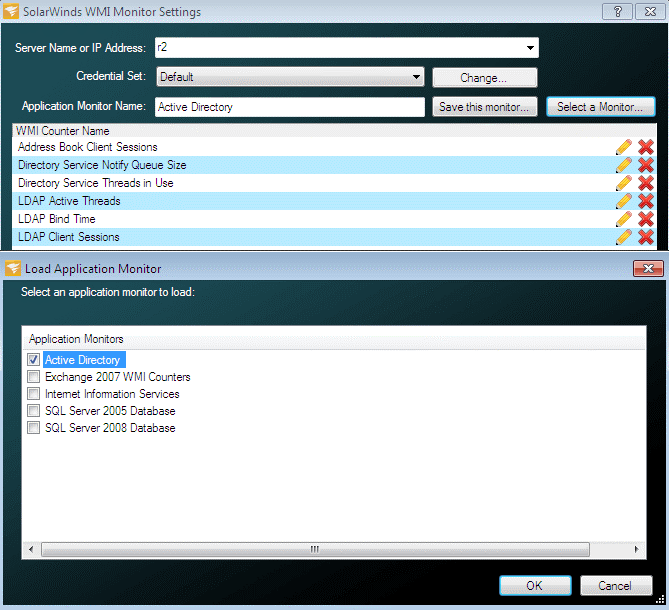
Many of the tools I’ve featured in this post are based on the SNMP protocol for collecting data. But these days, Windows systems are the majority in most organizations and thus a vast swath of data is overlooked unless a tool can also leverage WMI. This utility shows you the power within that humble protocol, and also lets you focus your monitoring investigation with minimal effort.
✔ Free Database Performance Analyzer
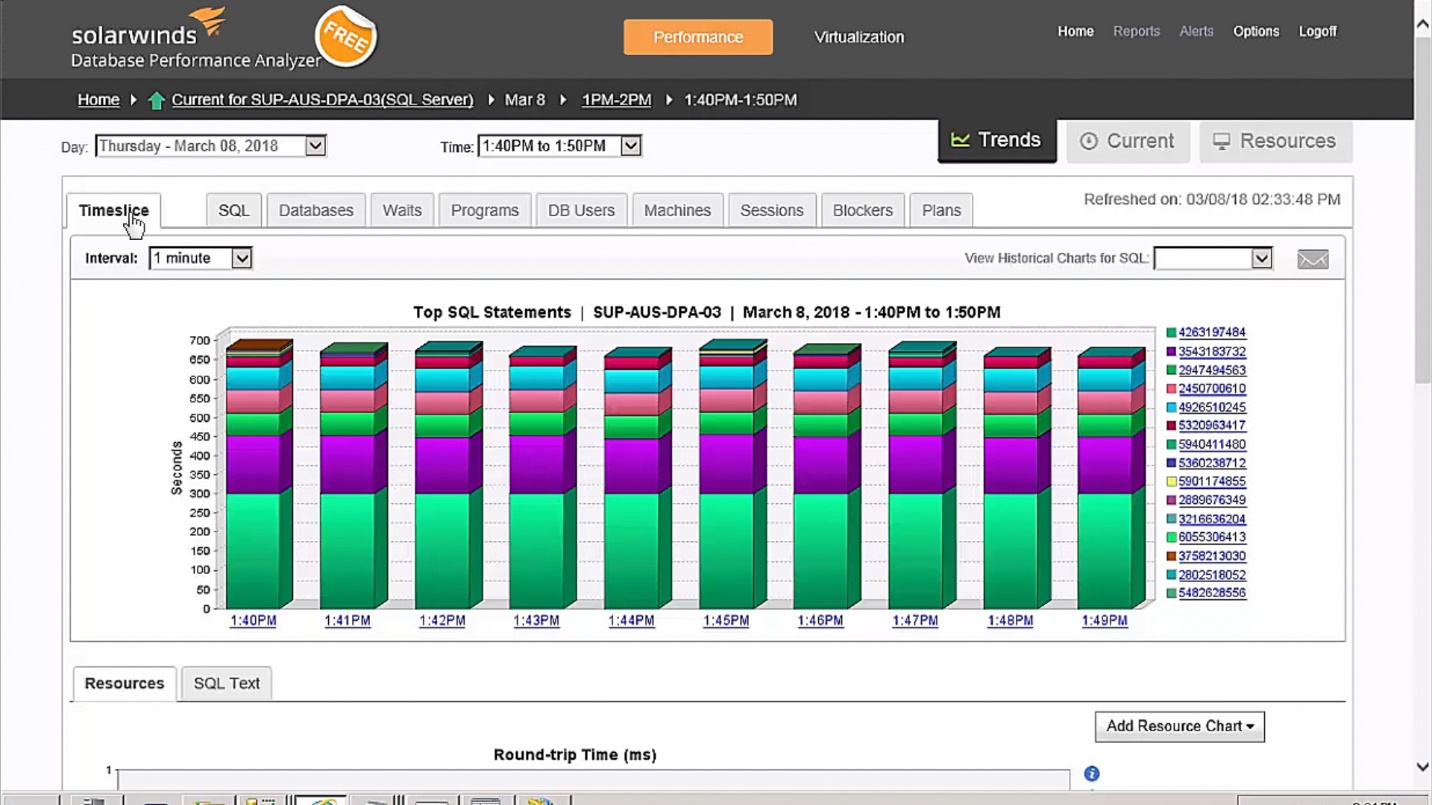
It’s no exaggeration to say that databases sit at the heart of every business-critical enterprise application. And yet, in my time as a monitoring specialist, it’s this area that teams are least comfortable digging into, unless they’re part of the DBA team. This is a pity, because knowing how your application’s database is behaving can reveal important details about how to improve performance and nip problems before they become critical. This utility lets you monitor just about everything that matters for a single database.
What have we learned?
Now more than ever, monitoring professionals have almost too many choices when it comes to free and open-source solutions. And while these free tools aren’t exactly push-button simple to install, maintain, or use, if you find yourself low on cash but with plenty of time to invest, they may work for what you need. Otherwise, I’d still recommend a tool like SolarWinds Server & Application Monitor, which is easy to install and includes out-of-the-box support for monitoring and reporting. Try a demo to see how your infrastructure performance is holding up.