
Oracle performance tuning is a crucial step in ensuring speedy application function and data retrieval. Here’s what you need to know to improve database performance.
All database administrators (DBAs) are familiar with the onerous task of increasing database performance. To accelerate application function, DBAs have to expedite query response time, which means DBAs must have a clear understanding of how their database is organized and how it serves its purpose. That is to say, DBAs must understand not just the database itself but the dedicated computer language that accesses the database to retrieve, manipulate, or delete information.
What is Oracle Performance Tuning
How does Oracle Performance Tuning work?
Steps for effective Oracle Tuning
What Is Oracle Performance Tuning?
Wondering how to do performance tuning in Oracle, specifically? Oracle is a relational database management system (RDBMS), and it utilizes Structured Query Language (SQL) to enable communication between applications and the database. Performance tuning is the process of optimizing Oracle performance by streamlining the execution of SQL statements. In other words, performance tuning simplifies the process of accessing and altering information contained by the database with the intention of improving query response times and application operations.
To break this down further, let’s first analyze the different components at play in a database management system, beginning with the database itself. As mentioned above, Oracle utilizes the relational database model.
What Is a Relational Database?
- A relational database is an information system. That is, it’s a computerized method of storing and using information.
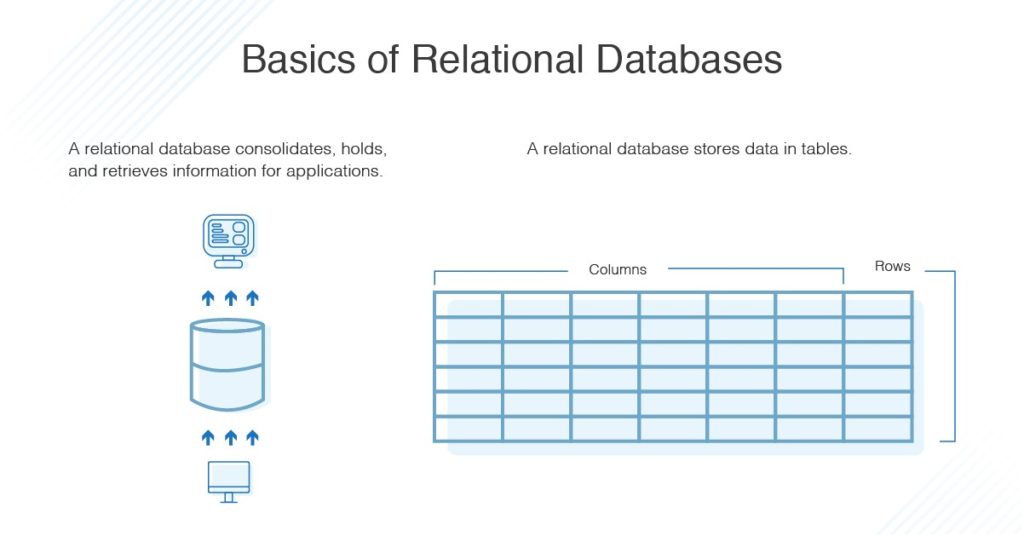
- A relational database exists to consolidate, hold, and retrieve information as needed by applications. Those application will then use that data for some purpose. A company, for example, might use a database to store customers’ personal information. A segmentation app may query the database for the email addresses of buyers who have made a purchase in the last month — personal information the company can use to target a specific customer segment with an email blast.
- A relational database stores data in tables. These tables are called “relations” and are configured much like a spreadsheet: the columns are “fields” that contain different attributes, and the rows are specific entries. A client base information table might have rows 1 to 27, each row corresponding to a different customer record and each column designating an attribute of personal information (name, email address, date of last purchase, etc.). Row 1 might read: “John,” “john@email.com,” “1/1/2019,” etc.
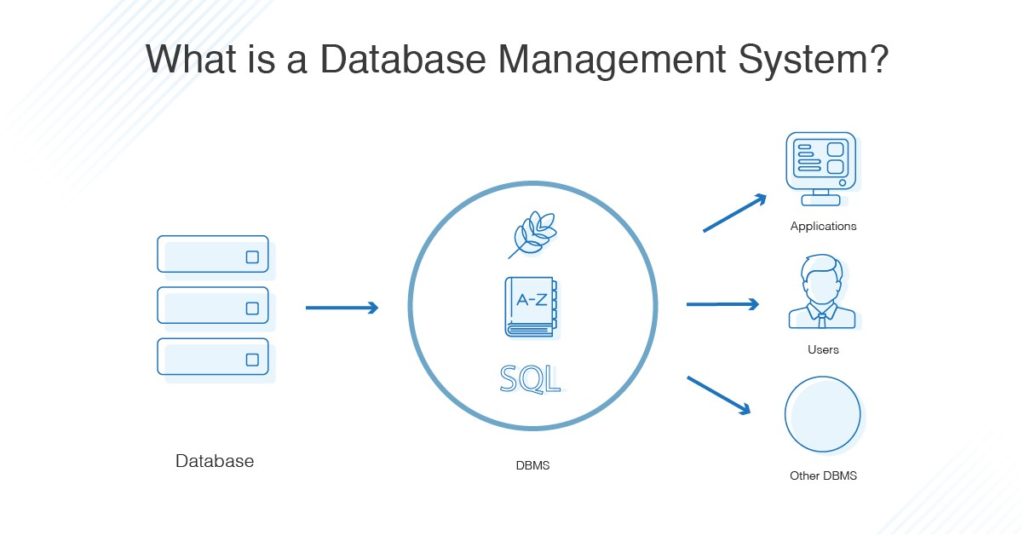
This database model is the foundation of the management system. The management system itself is software that creates relational databases and manages their organization and interaction with applications that use its data. As outlined by Oracle itself, the defining features of a database management system (DBMS) are:
- Kernel code – determines settings and allocates memory and storage for the system.
- A data dictionary – a collection of metadata. This repository offers a read-only overview of the data within the database, showing tables and views in addition to reference information regarding the database itself and its users.
- A specified query language – enables applications to access the database information.
As stated, Oracle uses SQL as its database language. SQL is distinguished by the ability to input, manipulate, retrieve, and delete data in a database. It also allows administrators to assign and revoke access as well as create their own views and functions. SQL is nonprocedural, which means that SQL statements inform the DBMS of what needs to be done, but they do not prescribe a course of action. Basically, the software in the DBMS figures out how to execute a statementby analyzing available options and electing the best sequence of actions. Not only is SQL a quick language to pick up, but users can embed SQL within other host languages.
How Does Oracle Database Performance Tuning Work?
Performance tuning considers the many elements in an RDBMS to troubleshoot the source of performance problems. Often, DBAs are faced with a difficult task—network users report experiencing app delays and slow-loading pages, but administrators cannot pinpoint the source of database bottlenecks. Is it an optimizer issue? The coding of query statements? A problem with the computer itself?
To identify the root cause, performance-tuning administrators must consider the many elements in an RDBMS to troubleshoot database operation lags. Not only can performance tuning be quite time-intensive, but it can be difficult to know where to begin. An intensive performance tuning process takes a systems-level approach and considers RDBMS components from top to bottom.
As many database experts note, tuning SQL statements one by one will have little effect if the administrator hasn’t first performed system-level tuning on the server, instance(s), and objects. I recommend assessing input and output (I/O) measures, optimizer parameters and statistics, and instance settings before tuning individual SQL statements. Otherwise, meticulous SQL tuning may be reversed later by the optimizer as it determines execution protocol contrary to designed execution plans.
10 Steps for Effective Oracle Performance Tuning
Once DBAs have done a systems-level check, they can proceed to SQL query tuning. Generally speaking, SQL tuning seeks to minimize the number of steps—“database touches”—a query entails, thus decreasing time cost and wait time. There are a lot of little SQL quirks and best practices to keep in mind, and while this list is by no means comprehensive or universally applicable, I have found that the following guidelines are helpful pointers in most situations.
Here are my top 10 SQL query performance tuning tips:
- Begin by identifying the most cost-intensive queries to appropriately allocate your tuning efforts. The truth is that SQL query performance tuning is an ongoing process; there’s always room for improvement, there’s always more code to optimize, and there’s always monitoring and upkeep to be done—which can make it feel like it never ends. For this reason, it’s important to isolate the high-impact SQL statements—those that are executed most frequently and require the most database and I/O activity. These statements offer the biggest returns in terms of database performance improvement, so targeting them will optimize the amount of tuning work put in relative to performance improvements.
- Always minimize the amount of data that must be scanned in an operation. Many query statements will prompt the database to perform full-table scans, which incur much more I/O and can degrade performance by slowing down operations and carrying out unnecessarily broad searches. To streamline data retrieval:
- Add indexes to tables if you need to access under 5% of their data, except in the case of fairly small tables (which are more expediently searched in full whether or not you need much data).
- Do not include * in your SELECT statement queries unless necessary to fetch data, as this symbol will load the system.
- Use filters in WHERE clauses to restrict the size of the data set.
- Conversely, in a column-oriented system, only select the columns you need for the query.
- Cull unnecessary tables from query statements. Occasionally developers may forget to remove JOINS that do not serve the query. While this can be innocuous in the testing stage, once the system goes into effect, JOINS to tables that do not contribute to the retrieved data can greatly increase processing time.
- Utilize EXISTS in subqueries. This communicates to Oracle that it can stop the search, rather than complete a full-table scan by default, when it finds the match.
- Do not use indexes to tables that undergo more UPDATE or INSERT operations, as indexes can slow data input. In that same vein, you might consider dropping your indexes when striving for batch updates or insertions. In this case, it might be best to recreate the indexes after a single batch event, or simply avoid indexes on tables frequently experiencing batch data loads to begin with.
- Don’t mix data types, and do not convert numbers to characters. Their comparison can slow operations and impact performance.
- In some scenarios, it may be easier to create a new field than to perform a calculation function on a JOIN or WHERE clause. In this situation, the new field would contain the calculated value, which the statement would SELECT rather than calculate itself. To accomplish this, the person tuning the code would have to have permission to alter the datasets, of course—but this should be no problem for a DBA or other IT administrator.
- More broadly, align your SQL statements and datasets. Basically, comb through SQL syntax to ensure that you’ve written your statements in ways that match up with the data structure and allow easy access.
- Institute protocol by using procedures instead of individual statements. A procedure is a collection of statements, and they downsize the cost of executing a recurring query. For example, if you use an app that requires you to pull data weekly, this query may account for a significant amount of database activity. You could use a procedure to certify that the query executes quickly, and according to your execution plan, because database engines carry out procedures without optimizing them.
- Use global temporary tables (GTT) whenever possible to simplify complication summarization queries. By breaking up the work of work-intensive subqueries, GTT have been shown to improve database performance significantly.
- Use hints. Oracle makes a list of hints available online to help application designers and DBAs. The purpose, as explained by the database itself, is to allow administrators and developers to “alter execution plans” and “force various approaches.” This allows designers who are tuning their SQL statements to take the reins from the optimizer in specific scenarios where the humans know more about the data than the optimizer. In these situations, they can ensure their execution plan gets carried out rather than overwritten by the optimizer, which might choose a data access path that does not optimize speed and performance.
- Finally, make tuning a routine. While you don’t want to have to allot redundant labor to tuning the same queries over and over, performance tuning in SQL does require habitual maintenance to prevent database performance deterioration over time as both datasets and RDBMS software evolve. With this in mind, commit to normalizing and defragmenting the database routinely.
Oracle Performance Tuning Software Recommendations
Of course, all of this Oracle performance monitoring and assessment work is nearly impossible to do manually on an ad hoc basis. Plenty of useful and affordable software exists that can automate database performance tracking and help DBAs identify the source of performance problems. This saves IT departments a good deal of time. Rather than noting a lag and having to root through their code and database set up to find the root cause, they can check their software to drill down into the queries with the highest performance impact.
Here are the Oracle database tools I rate most highly:
SolarWinds® Database Performance Analyzer® (DPA) is one of the most powerful solutions for those wondering how to check SQL query performance in Oracle. The dashboard was designed with the user experience in mind, and it provides comprehensible, informative visualizations breaking down SQL statement activity—data which can be dense and difficult to parse on other platforms.

The dashboard displays a time analysis graph which plots the day against total query response time (the amount of time between a query request and a query response; basically, the cumulative processing time and resource availability wait time). The bar for each individual day is color-coded by query statement, which allows DBAs to easily drill down into metrics for each query simply by clicking.
DPA collates data in real time, so its information is up-to-date from one second to the next, and it shows alerts on the dashboard (or delivers them via mobile notifications or email) when it detects critical issues. This helps DBAs hierarchize their chaotic workload, taking care of potential problems and query wait times that have the biggest impact on system performance before focusing their attention elsewhere.
This function is particularly useful because it focuses performance-tuning work—which can require high investment for low returns when mismanaged—on the priority: wait time. Many tools and even IT departments make the mistake of prioritizing resource utilization during performance tuning, but this can obfuscate the source of a performance problem. It’s guesswork, more than anything—something which is not true a database performance analytics which cross-check specific queries, wait time events, I/O and storage stats, and database activity against one another to determine causality and find performance solutions.
Basically, SolarWinds DPA is unparalleled in the way it consolidates and analyzes data to make it truly actionable. Its graph of worst-performing SQL statements enables users to learn the specific wait types and events that are causing application wait times. If they glean that a wait is due to the CPU, for example, DBAs have a place to start performance tuning: the actual root cause. Fixing this issue will immediately yield a performance boost with tangible benefits for network users and applications. Further, DPA improves group communication and institutional memory. Not only does DPA preserve historical data, but it produces custom reports, alerts, and metrics for DBAs to present internally to colleagues or externally to other departments or even clients.
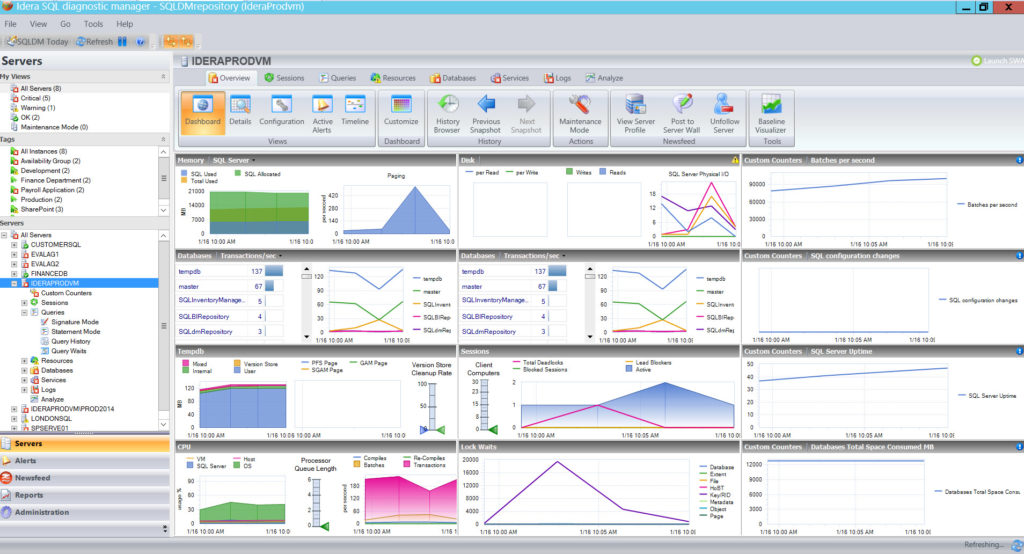
Another excellent tool for those learning how to check Oracle database performance is the Idera SQL Diagnostic Manager. It includes some features similar to the SolarWinds DPA tool, like predictive alerts and customizable monitoring settings for multiple servers.
I found that its main strength are its prescriptive suggestions. That is, if you have a performance problem, the tool will flag the issue and recommend a solution like executable script. This is particularly helpful for IT personnel who are still getting their footing in SQL query performance tuning, although of course they’ll need their own expertise to troubleshoot complex bottlenecks.
In my opinion, the interface is a bit too cluttered, but it’s definitely a good option for Windows users. The only other problem I’d note is that it’s configurable reports and monitoring don’t feel as robust as they could be.