
SQL Server is a relational database management system (RDBMS) developed by Microsoft for Windows and—in recent years—for Linux. Like other RDBMS software, SQL Server uses SQL as its query language. Specifically, it uses an SQL implementation called Transact-SQL, or T-SQL.
SQL is a standard programming language for interacting with relational databases. T-SQL is slightly different from standard SQL, as it adds a set of proprietary programming constructs. T-SQL statements can be written in batches, which SQL Server then aggregates and caches to improve query performance.
SQL Server allows database administrators (DBAs) to configure and optimize resource usage by offering multiple table storage options and control over the distribution of storage, CPU, and memory. Database servers are a crucial part of your business and need to have consistently high availability. With the right SQL Server performance monitor, you can boost the availability and performance of your SQL Server.
This guide explains how you can save SQL Server memory usage and other resources by conducting appropriate SQL Server performance monitoring queries and utilizing SQL Server DBA tools like SolarWinds® Database Performance Analyzer (DPA). It also outlines the metrics capable of giving you increased visibility into SQL Server functionality, including query optimization, data persistence, resource pooling, and indexing. These tips will help you ensure your instances are available and fully optimized so you can make the most of your resources.
How to Check SQL Server Memory Usage
How Does SQL Server Work?
SQL Server Performance Metrics to Monitor
SQL Server Performance Monitoring Tools
Saving SQL Server Memory Through Query Performance Monitoring

How to Check SQL Server Memory Usage
If you’re wondering how to check SQL Server memory usage, this guide can walk you through the process. Simply put, if your memory usage is within typical and acceptable ranges, you should be monitoring SQL Server periodically. If you want to monitor for a low-memory condition, you can use these two object counters: “Memory: Available Bytes” and “Memory: Pages/sec.”
The first object counter, Available Bytes, reveals how many bytes of memory are currently available and able to be used by processes. The Pages/sec counter will tell you how many pages were retrieved from disk due to hard page faults or written to disk to make space available in the working set as a response to page faults.
If the Available Bytes counter shows low values, this may be indicative of a memory shortage on the device, or it may indicate the application isn’t relinquishing memory. For the Pages/sec counter, a high rate might indicate excessive paging. To determine whether the disk activity is caused by paging, monitor the “Memory: Page Faults/sec” counter.
A low paging rate, which indicates page faults, is to be expected, even if the device has lots of memory available. This is because the Microsoft Windows Virtual Memory Manager, otherwise known as VMM, takes pages from SQL Server and other operations while it trims processes’ working set sizes. This activity is likely to create page faults. To figure out whether a process or SQL Server is responsible for excessive paging, monitor this counter for the SQL Server process instance: “Process: Page Faults/sec.”
The Windows operating system documentation provides ample information and advice on resolving excessive paging issues. If you need more specific or extensive information, I’d recommend reviewing this documentation.
If you need to know how to check SQL memory usage with a specific query, inputting the following will return values for the current state of allocated memory:
SELECT
(physical_memory_in_use_kb/1024) AS Memory_usedby_Sqlserver_MB,
(locked_page_allocations_kb/1024) AS Locked_pages_used_Sqlserver_MB,
(total_virtual_address_space_kb/1024) AS Total_VAS_in_MB,
process_physical_memory_low,
process_virtual_memory_low
FROM sys.dm_os_process_memory;
SQL Server alters its memory requirements by default according to the availability of system resources. If SQL Server requires extra memory, it sends a query to the operating system to determine whether the appropriate amount of physical memory space is available. If free physical memory exists, it’s utilized.
Moreover, if SQL Server doesn’t require the amount of memory allocated to it, it releases the memory back to the operating system. It’s possible to override this option by utilizing the “MaxServerMemory” and “MinServerMemory” configuration settings.
To monitor how much memory is being used by SQL Server, you can use the following performance counters:
- SQL Server: Buffer Manager: Database Pages
- SQL Server: Buffer Manager: Buffer Cache Hit Ratio
- SQL Server: Memory Manager: Total Server Memory (KB)
- Process: Working Set
The Buffer Cache Hit Ratio counter is specific to a single application, but a rate of more than 90% is acceptable. If you need to boost this percentage, add more memory, and the value should increase. When the value is greater than 90%, this means more than 90% of all data requests were met.
The Working Set counter displays the amount of memory utilized by a process. If the amount of memory is lower than the values set by the max server memory and min server memory options, SQL Server has been configured to utilize too much memory and this should be adjusted. Lastly, if the Total Server Memory (KB) counter is consistently high when compared with the amount of physical memory on the device, this could indicate more memory is needed.
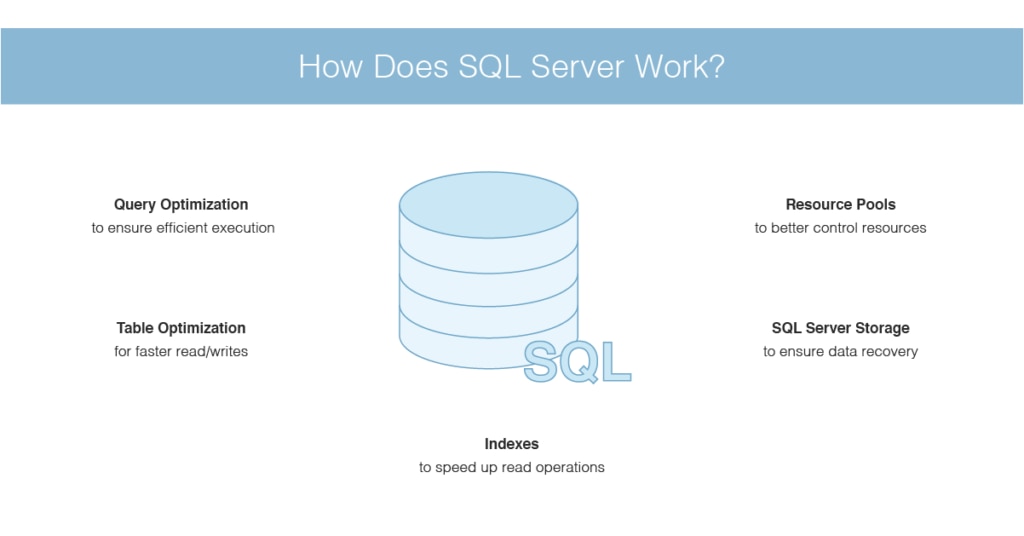
How Does SQL Server Work?
Indexes
Like other relational databases, SQL Server allows you to create indexes. These can potentially speed up read operations because—depending on the nature of the query—index searching is typically faster than searching each table row individually. The SQL Server query optimizer dynamically determines whether time can be saved by using an index before taking appropriate action.
Query Optimization
T-SQL allows you to write in batches, which are sets of multiple statements performing a series of operations on your database. SQL Server can then compile the statements into one query. Fortunately, you’re also able to determine the order of batch statements. You could, for instance, write a batch designed to return a result defined by a SELECT statement. You could then set this result to execute another process. The word “GO” indicates the conclusion of a batch in software querying SQL Server.
Each batch of statements is aggregated and cached in memory in the form of an execution plan. This is a set of data constructs enabling SQL Server to reuse batches in numerous contexts with varying parameters and users. If a user executes a batch of statements, SQL Server will search the cache for the relevant execution plan. If nothing is discovered, SQL Server will create a new one.
When SQL Server aggregates a batch of statements, it also optimizes them. It measures the statistics associated with the batch, including the number of rows, and tweaks the execution plan to reflect this. In SQL Server, a query is simply a batch of one or more T-SQL statements collected and executed as an execution plan.
Table Optimization
You may be able to achieve faster reads and writes by using memory-optimized tables. Tables of this nature store rows in memory instead of on disk and individually instead of within pages. This minimizes the number of bottlenecks occurring in per-page access. Memory-optimized tables eliminate the need for a buffer manager brokering between disk and memory, as reads and writes benefit because accessing data in memory is less time-consuming. SQL Server keeps a copy of memory-optimized tables on disk by default and utilizes the copy to recover the database when necessary. You can configure memory-optimized tables to have zero disk persistence, if appropriate.
SQL Server Storage
SQL Server uses a buffer manager instead of reading and writing directly to disk. This moves data between an in-memory buffer cache and storage. Data is stored within 8KB pages; the buffer manager addresses queries by checking the buffer cache initially and pulling from the disk when necessary. If the buffer manager must write to a page in memory, the page is referred to as “dirty.”
A dirty page is flushed to disk periodically, which means most of the work happens in memory. This process ensures high-cost disk operations occur less regularly. Dirty pages are kept in the buffer cache until they’re flushed to facilitate further writes and reads.
SQL Server creates and maintains checkpoints where dirty pages are flushed to disk. Doing so ensures the database can recover within a short period of time if a failure occurs. This recovery period defaults to zero but can be configured. A recovery interval of zero amounts to a checkpoint approximately every minute. A T-SQL statement can be used to manually generate a checkpoint suited to your specific requirements.
In the interest of tracking data alterations to facilitate recovery, SQL Server keeps a write-ahead transaction log. This is essentially a record of modifications made to data. It also accounts for the points at which checkpoint and transaction operations begin and end. A copy of the write-ahead transaction log is stored in a cache and on disk.
Resource Pools
With resource pools, which have been available since SQL Server 2008, you can exert more control over SQL Server resources than ever before. A resource pool is a virtual instance of SQL Server capable of accessing aspects of its parent’s resources. This includes disk I/O, memory, and CPU. For a single instance, you can declare numerous resource pools.
You can determine which resource pools your SQL Server is able to access by taking advantage of user session classifications called workload groups. A workload group belongs to a specific resource pool and cannot access the resources of any other pool. You can include session policies with your workload groups and assign incoming requests by using a classifier function.
SQL Server Performance Metrics to Monitor
When appropriately monitored, the following metrics can reveal your database’s resource usage and other performance-related insights.
Batch Requests/Sec
This measures the rate of T-SQL batches received per second, affording you a high-level view of the overall usage of your database. Changes in this value may be able to reveal availability problems or sudden demand variations.
Last_Elapsed_Time
This measures the time it took to complete the most recent query plan execution, and it’s measured in microseconds. The processes of compiling T-SQL batches and caching them as execution plans is automatic, so it’s important to ensure they’re performing as intended. By measuring the time it takes for an execution plan to reach completion, you can determine potential performance compilation benefits.
SQL Compilations/Sec
This measures the number of times SQL Server compiles T-SQL queries per second. When a batch is executed for the first time, SQL Server compiles it into an execution plan, which is then cached. Ideally, an execution plan is only compiled once. In some instances, however, plans are reused. Comparing this metric to the rate of batch requests received per second is key to optimizing this process.
SQL Recompilations/Sec
This measures the number of times query recompilations are executed per second. When SQL Server is restarted, execution plans are recompiled. This also happens when the database structure or data has changed enough to make the execution plan largely invalid. Recompilation is sometimes crucial to executing your T-SQL batches, but it can undo execution time savings. Monitor SQL recompilations/sec to see if the results correspond to performance dips. This can tell you whether SQL Server has optimized execution plans for table modifications.
Buffer Cache Hit Ratio
This refers to the percentage of requested pages discovered in the buffer cache. This metric measures how often the buffer manager is able to pull pages from the buffer cache compared with how often it has to read a page stored on disk. If your buffer cache hit ratio is low, it may help to increase the buffer cache size by allocating a greater amount of system memory. The bigger the buffer cache, the easier it is for SQL Server to find the desired pages.
Page Life Expectancy
This measures the time, in seconds, a page is expected to spend in the buffer cache. This metric can indicate how effectively the buffer manager is reading and writing processes within memory. If your page life expectancy is low, it could indicate your buffer cache is undersized. It could also mean overly frequent checkpoints are in use. In the event of the former, you can add physical RAM to your instances to boost page life expectancy.
Checkpoint Pages/Sec
This measures the number of pages written to disk by a checkpoint per second. Monitoring this metric can help you determine the cause of high page turnover. During a checkpoint, all dirty pages are written to disk by the buffer manager. By monitoring the rate of pages being moved to disk from the buffer cache (especially at checkpoints), you may be able to determine whether you need to reconfigure checkpoints or add system resources.
Memory_Used_by_Table_KB
When using memory-optimized tables, this metric refers to the memory used by the table in kilobytes. This is key to determining whether there’s enough space available for your data. With memory-optimized tables, memory is of the same importance as storage. A memory-optimized table can be any size, limited only by your system memory. Memory-optimized tables can accommodate high-throughput and low-latency transactions. If your use case is aligned with this profile, then you can monitor the rate of queries to in-memory tables alongside their resource usage.
Disk Usage
This measures the space used by data or indexes in a given table. This one is self-explanatory. When your server is low on disk space, it’s important for you to be notified early so you can launch a preemptive strike. When you’ve almost reached capacity, you may want to rethink your storage design. Remember, SQL Server allows you to configure how your tables utilize disk space. You could distribute your data files across multiple disks and attribute them to a unit or file group, for example. Changing the structure of your storage can help free it up and improve performance.
Used Memory
This measures the kilobytes of memory used in the resource pool. A SQL Server instance has a limited amount of memory available for use by query execution. In a resource pool, minimum memory and maximum memory percentage values determine the percentage of a SQL Server instance’s memory capable of being used by the pool. Changing these percentages can have a notable impact on resource pool usage. As such, it’s key for your resource pool configurations to be influenced by resource usage, including memory.
CPU Usage %
This measures the percentage of CPU being used within a resource pool by all workload groups. The maximum and minimum values for CPU usage are only applicable when numerous resource pools would otherwise use more CPU between them than what is available to them. If no other resource pools are utilizing CPU, a single pool can exceed the maximum CPU percentage value. It’s crucial to monitor CPU consumption among users so you can determine whether your resources could be optimized with soft or hard limitations.
Disk Read IO/Sec and Disk Write IO/Sec
These two metrics go hand in hand. “Disk read IO/sec” refers to the number of disk read operations in the last second per resource pool. “Disk write IO/sec” refers to the number of disk write operations in the last second per resource pool. You can configure I/O utilization per disk volume within a specific resource pool by setting minimum and maximum I/O operations per second (IOPS) per volume values. This can give you insight into how often your resource pools approach their limits and whether an alternative route might be more appropriate.

SQL Server Performance Monitoring Tools
There are numerous SQL Server performance monitoring queries you can use to monitor specific elements of SQL Server. This can be a time-consuming and resource-intensive process, which is why many administrators choose to use a SQL Server performance monitor. SQL Server performance monitoring tools can streamline and augment the monitoring process, assisting you in optimizing your SQL Server performance without requiring a large investment. If you need to know how to check SQL Server memory usage, SQL Server DBA tools can help.
SolarWinds Database Performance Analyzer (DPA)
SolarWinds DPA allows you to drill down and pinpoint the root cause of poor SQL Server performance. It was designed for IT managers, application developers, and DBAs, offering them a sophisticated database performance monitoring and analysis solution. This tool can help you improve application service, reduce the cost of SQL Server operations, and eradicate performance bottlenecks.
There’s plenty to love about DPA. To start, its analysis capabilities are highly advanced yet easy to use. With the dynamic dashboard, which represents data graphically for ease of interpretation, you can gain at-a-glance insight into your SQL Server performance across multiple dimensions. This includes waits, applications, queries, client machines, users, and much more. With easy context setting and drill-in and a consistent navigational structure, DPA is a simple but versatile tool.
DPA also offers blocking and deadlock analysis, so you can see what’s being blocked and what’s responsible for blocking it. The tool gives you insight into your SQL Server blocking hierarchy, allowing you to view the overall impact blocking has on your database performance and access detailed deadlock resolution reports.
With workload and index recommendations, DPA can help you achieve maximum SQL Server performance monitoring efficiency. You can identify high-impact and inefficient T-SQL (aggregated by tables), which is helpful in finding indexing opportunities. This tool gives you a precise performance analysis view of actual workload.
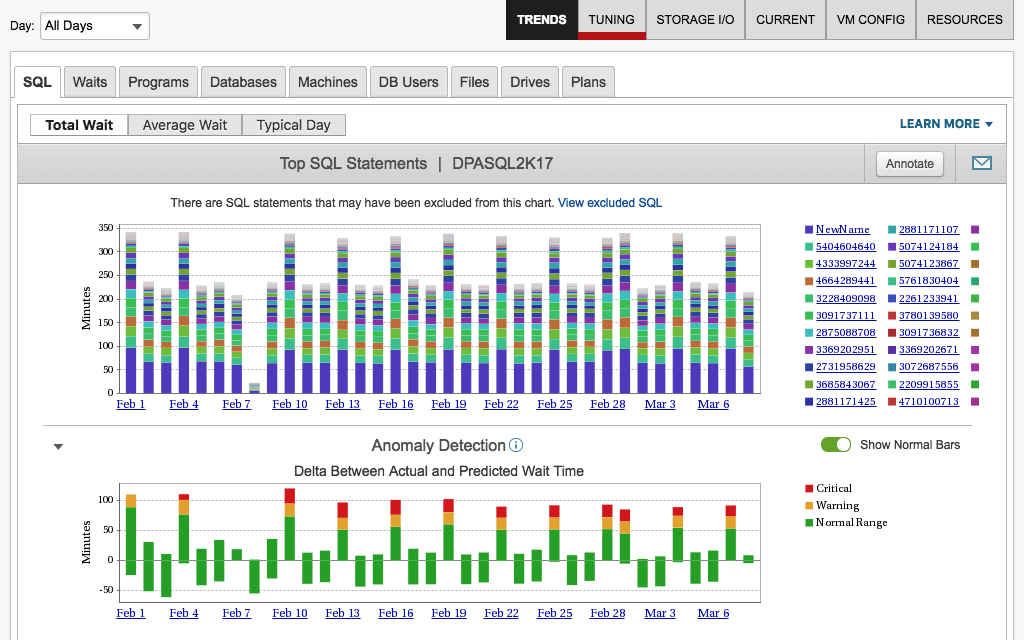
DPA is powered by machine learning, which facilitates advanced anomaly detection. The clever algorithm learns over time, evolving its understanding of your SQL Server wait behavior so it can notify you when something unusual occurs. The SQL Server alerting capabilities are comprehensive and allow you to set baselines to flag outliers. Prebuilt alerts allow you to rely on the tool’s understanding of what information you need to know. Alternatively, you can customize your own alerts from scratch.
DPA users have access to table tuning advisors, which provide clear and actionable advice. Using this feature, you can correlate query wait time with blocking data, resource metrics, statistics, and more. Tuning advisors can help you identify SQL Server issues requiring immediate attention. This support makes DPA extremely easy to use, even in stressful situations.
DPA captures multiple dimensions of server statistics and response time in the data warehouse repository. Unlike many tools, which focus solely on present issues, DPA analyzes repetitive clues capable of explaining why SQL Server is lagging. With a colorful and graphic display, spotting trends and patterns becomes simple.
The powerful management REST API is one of the best features of SolarWinds DPA. It allows you to programmatically manage your environment, giving you control over the ability to license, register, annotate, stop and start monitors, and more.
SolarWinds® SQL Sentry
SolarWinds® SQL Sentry is another tool that can help you quickly find and fix long-running and high-impact queries. Built to provide deeper visibility across Microsoft databases, SQL Sentry can help you more effectively monitor, diagnose, and optimize queries and performance across your database environment.
SQL Sentry includes features to help you with the following scenarios and more:
- Stay on top of SQL Server memory usage by analyzing file space of tempdb data files, objects, activity, and session
- Leverage the Storage Forecasting feature, which applies machine learning to forecast daily storage usage, to manage compute resources proactively
- Use the integrated Plan Explorer tool to analyze queries, plan recosting, and indexes
You can download a free 14-day trial of SQL Sentry.
Saving SQL Server Memory Through Query Performance Monitoring
DBAs can save SQL Server memory usage and other crucial resources by monitoring SQL Server performance queries. This guide has looked at metrics for gaining visibility into the functionality of your SQL Server and optimizing resource use. It also discusses the benefits of implementing a powerful SQL Server performance monitor, focusing on SolarWinds Database Performance Analyzer.
DPA stands out among the best SQL Server query performance monitoring tools. Its comprehensive range of advanced features and scalable design make it suited to small-scale and large-scale businesses alike. If you’re looking for a tool capable of growing with you in a cost-effective way, I highly recommend DPA. You can access a 14-day free trial here.