Database products are available from all the big manufacturers, but two of the most popular are IBM Db2 Database and Oracle Database. As relational database management systems (RDBMS), both are used for managing and indexing the information on your systems.
Relational databases organize information in a “relational” format, in which data is represented in tables with columns and rows. By making it easy to see how data points relate to one another, they allow devices to efficiently search for and find relevant information for running applications and services. The RDBMS manages these kinds of databases.
This guide starts out by comparing the features of Db2 vs. Oracle. It goes on to outline the foundational best practices for troubleshooting your RDBMS and the best tools for managing Oracle and Db2 performance—including my top pick, SolarWinds® Database Performance Analyzer (DPA).

Db2 vs. Oracle
Let’s start with a look at Db2 vs. Oracle. Both were released around the same time (in the early 1980s), and they have some shared features. Both RDBMSs are implemented in C and C++ and support similar server operating systems (AIX, HP-UX, Linux, Solaris, Windows, z/OS). Unlike Db2, Oracle supports servers running OS X, though this isn’t very common in most enterprise settings. In addition, Oracle supports more programming languages.
Both RDBMSs support C, C#, C++, Cobol, Delphi, Fortran, Java, Perl, PHP, Python, Ruby, and Visual Basic, but Oracle Database also supports Clojure, Eiffel, Erlang, Groovy, Haskell, JavaScript, Lisp, Objective C, OCaml, R, Scala, and Tcl.
Another key difference when it comes to Db2 vs. Oracle is IBM provides Db2 when you purchase any of its iSeries hardware or operating systems, while Oracle is only sold independently—in other words, you have to pay for it separately.
Db2 is well known for reliability and scalability, while Oracle Database is more known for its wide range of applications, tools, skills, and partners available. Both are very stable databases, with large amounts of documentation and good support. While some feel Db2 is lacking or has become less modern than Oracle as these two products have developed, shortcomings in Db2 can be easily addressed with third-party applications.
You may also be considering other options, such as Db2 vs. SQL Server. In many cases, the right RDBMS for you will depend on the specifics of your organization. It’s best to familiarize yourself with the top players, check out free trials or demos, and look carefully at the specific features and how they fit with your needs.
Oracle and Db2 Troubleshooting
Follow these basic best practices when troubleshooting Db2 or any other RDBMS:
Be Prepared
You need to ensure your data server is configured correctly ahead of time, so you don’t run into problems when you try to carry out the troubleshooting process. Your server should be configured to leave space for diagnostic data collection. The most important thing is to think of it as controlling, not suppressing, the process of diagnostic data collection. You need to control where you store your diagnostic data, and you need to ensure there’s always enough free space to store it.
Monitor Infrastructure
Next, make sure you regularly monitor both system and query performance. By checking on infrastructure and clearly baselining your infrastructure’s performance, you can better understand the typical workloads your data server processes. You need to be monitoring three key areas: system performance, activities, and data objects. You should also monitor metrics in your infrastructure, including time spent metrics (time spent waiting, I/O time, time spent processing), section explains, and section actuals.
Use Tools
Numerous factors could be behind database issues. For example, has the server actually booted up? Has the Db2 instance started? Is the connection available? If a site failover has occurred, has disaster recovery kicked in?
All this needs to be monitored to maintain a healthy and well-functioning database system. Beyond manual troubleshooting, it’s important to incorporate a high-quality tool to manage optimization and performance, so you don’t leave any issues unresolved.
Oracle and Db2 Tools
A good-quality tool will allow you to keep on top of your RDBMS health, performance, and troubleshooting issues before they become a problem. There are several Oracle and Db2 optimizer solutions on the market, and many tools designed to facilitate troubleshooting and simplify the Db2 check database status process. Here, I recommend three.
SolarWinds Database Performance Analyzer
When it comes to Oracle and Db2 tools, this is my top choice. Database Performance Analyzer (DPA) has some great features and is available for use with SQL Server, SAP ASE, and other engines.
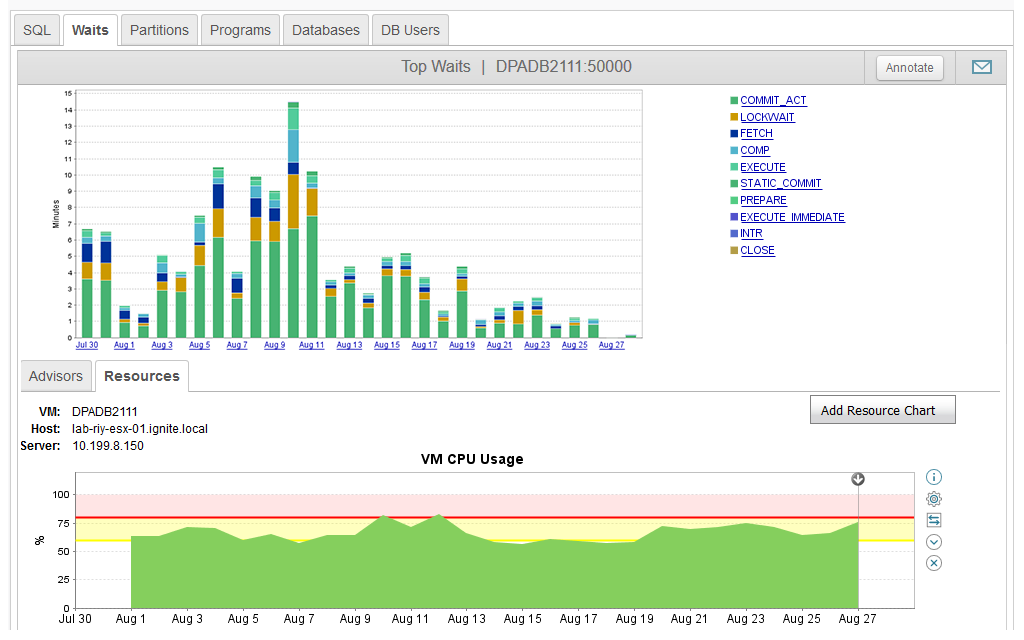
DPA focuses on the measurement of database response time: it measures the time to complete specific operations and breaks this down into steps, so you can see which point along the chain is causing delays—for example, you could look specifically at Db2 views performance. This leads to faster analysis and troubleshooting.
In addition to measuring response times for the database, DPA looks at system health more generally, including wait-based analytics and SQL statements and queries. You can view this information in a centralized location. You can also check on your query status and hardware metrics through any platform, as DPA works with an agentless architecture.
DPA can integrate with other SolarWinds products, such as SolarWinds Network Performance Monitor, through the Orion® Platform. This allows you to check every aspect of your IT environment’s health in one place.
Although there is a free version of DPA, it doesn’t provide the same level of detail as the professional version, and is missing several features. It’s still useful for basic database troubleshooting, but you’ll miss out on historical trend reporting, real-time session monitoring for VMware databases, customer and technical support, and support for RDS, Azure, AWS, and MySQL.
You can access a free trial of the professional version of DPA for up to 14 days. There is also an interactive demo on the SolarWinds website, so you can test out the basic features and interface before you download.
Paessler PRTG Network Monitor
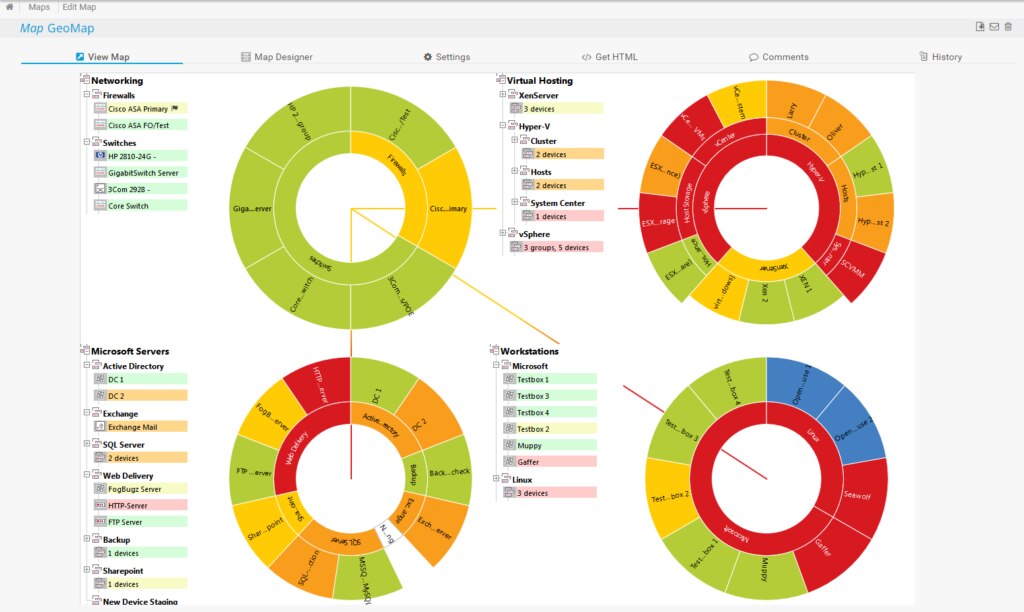
When it comes to Db2 optimization and monitoring tools, Paessler PRTG Network Monitor is another good option. In addition to Db2, it can monitor Oracle SQL, Microsoft SQL, MySQL, and PostgreSQL. Like SolarWinds DPA when integrated with the Orion Platform, it offers a one-stop approach to monitoring. PRTG is primarily a network monitoring tool, but it includes the ability to monitor applications, network traffic, virtual environments, web services, disk usage, and databases and storage servers.
You can view your monitoring data in real time, or look at historical data over a two-day, 30-day, or yearly format. This allows you to clearly baseline behavior, so you can see if there have been any major changes in performance, or whether something has become less optimized. You can also use alarms, logs, and notifications to check on issues for troubleshooting and optimization.
PRTG offers three key graphs to help you keep tabs on your database: Core Health, Probe Health, and System Health. The dashboards are also customizable, so you can change the display to focus more clearly on what’s important to your organization.
You can also customize the sensors in PRTG, which means if you want to only monitor some things and not others, you can do so. If you don’t want to customize anything, you can use preconfigured sensors and the accompanying settings.
The professional version of PRTG is available as a 30-day trial, after which it reverts to the free version.
Nagios
Nagios is used for Oracle and Db2 monitoring alongside other database management systems, including monitoring for PostgreSQL, MySQL, and Microsoft SQL Server. There are two versions of Nagios: Nagios Core and Nagios XI.
Nagios Core is a free open-source tool, and is essentially an event scheduler, event processor, and alert manager. It’s useful for basic monitoring, but not sufficient for an enterprise setting.
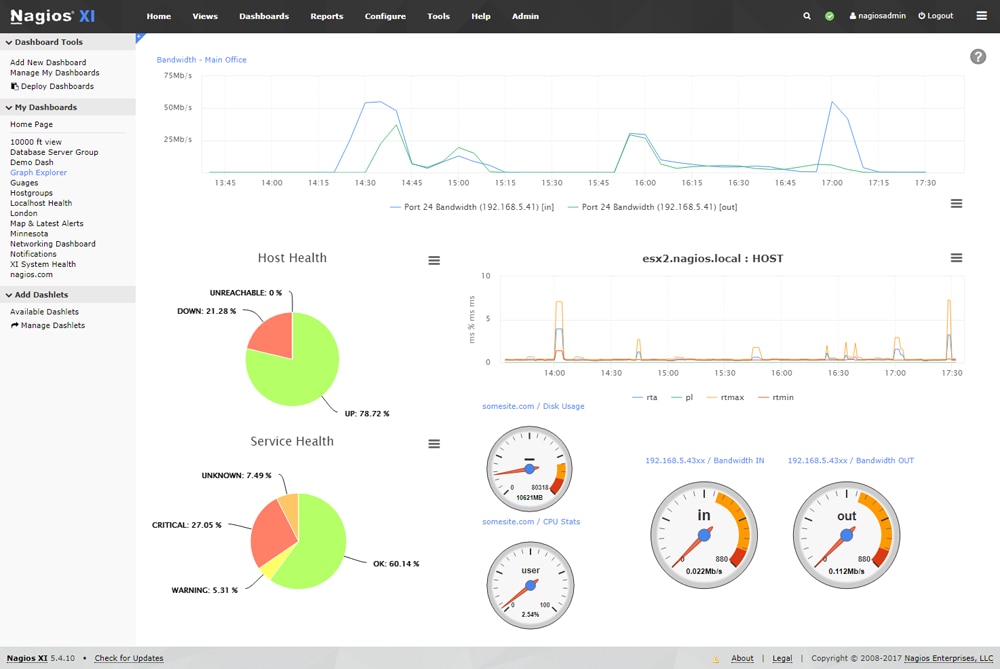
Nagios XI is the professional version, and it provides a complete monitoring tool for database servers and databases. It measures database availability, cache ratios, and database and table sizes, alongside other things. It quickly detects outages, any table corruptions, or any failures. And through predictive analysis, it allows you to find out in advance when your storage is going to run out, or if your index is performing poorly.
Nagios XI includes a customizable, centralized dashboard, to give you a high-level overview of information about your network and servers. This includes information on all your hosts, services, and network devices.
With Nagios, you generally need to rely on plug-ins and add-ons to get a wider range of features. Many of these plugins are developed for open-source access alongside Nagios Core. These custom plugins and community add-ons are good quality but setting them all up and finding the right ones can take a lot of time. On the upside, it can help you customize your solution. Keeping all the plugins and add-ons up to date can become a lot to manage, and the application as a whole becomes less centralized and more complicated.
You can download Nagios XI from the website, or try it free for up to 30 days.
Optimizing Your RDBMS
This guide is intended to help you understand, troubleshoot, and optimize Oracle and IBM Db2. It sets out the main differences in features between Db2 vs. Oracle, followed by a series of troubleshooting best practices. Admins will benefit from the use of a powerful tool for optimizing their RDBMS; my recommendation for companies of any size is SolarWinds DPA, which can be integrated with other tools to create a comprehensive solution.