
The IIS web server is a central element of any Windows IT structure. SharePoint, Outlook, and general web activity all rely on IIS server availability and performance. Maintaining high-quality IIS performance is integral to ensuring uptime, reliability, and security. If there’s a problem with your server, your web presence will be negatively impacted, and end user experience will deteriorate. To attain a high level of performance, you need IIS server monitoring and log analysis tools.

How Does IIS Performance Monitoring Work?
IIS performance monitoring allows you to proactively measure and collect metrics and log data related to web server performance. With real-time insights, you can troubleshoot current issues or make changes to optimize future performance.
For instance, you could use a tool to automatically track response time metrics. A slowdown in your IIS server response time means it will take longer for users to access your websites and web applications. If they’re forced to wait too long, those users will likely either send a help desk ticket or leave the site. With insight into response time, you may be able to remediate the issue before end users feel the impact.
You could also use log data for insight into IIS servers. You can track anomalies that could signal security breaches or vulnerabilities. After all, if the security of your IIS server is compromised, it could have even more serious consequences for your business than a simple reduction in performance. Given how central the server is to the successful functioning of your critical applications, the effects of a security compromise could be devastating.
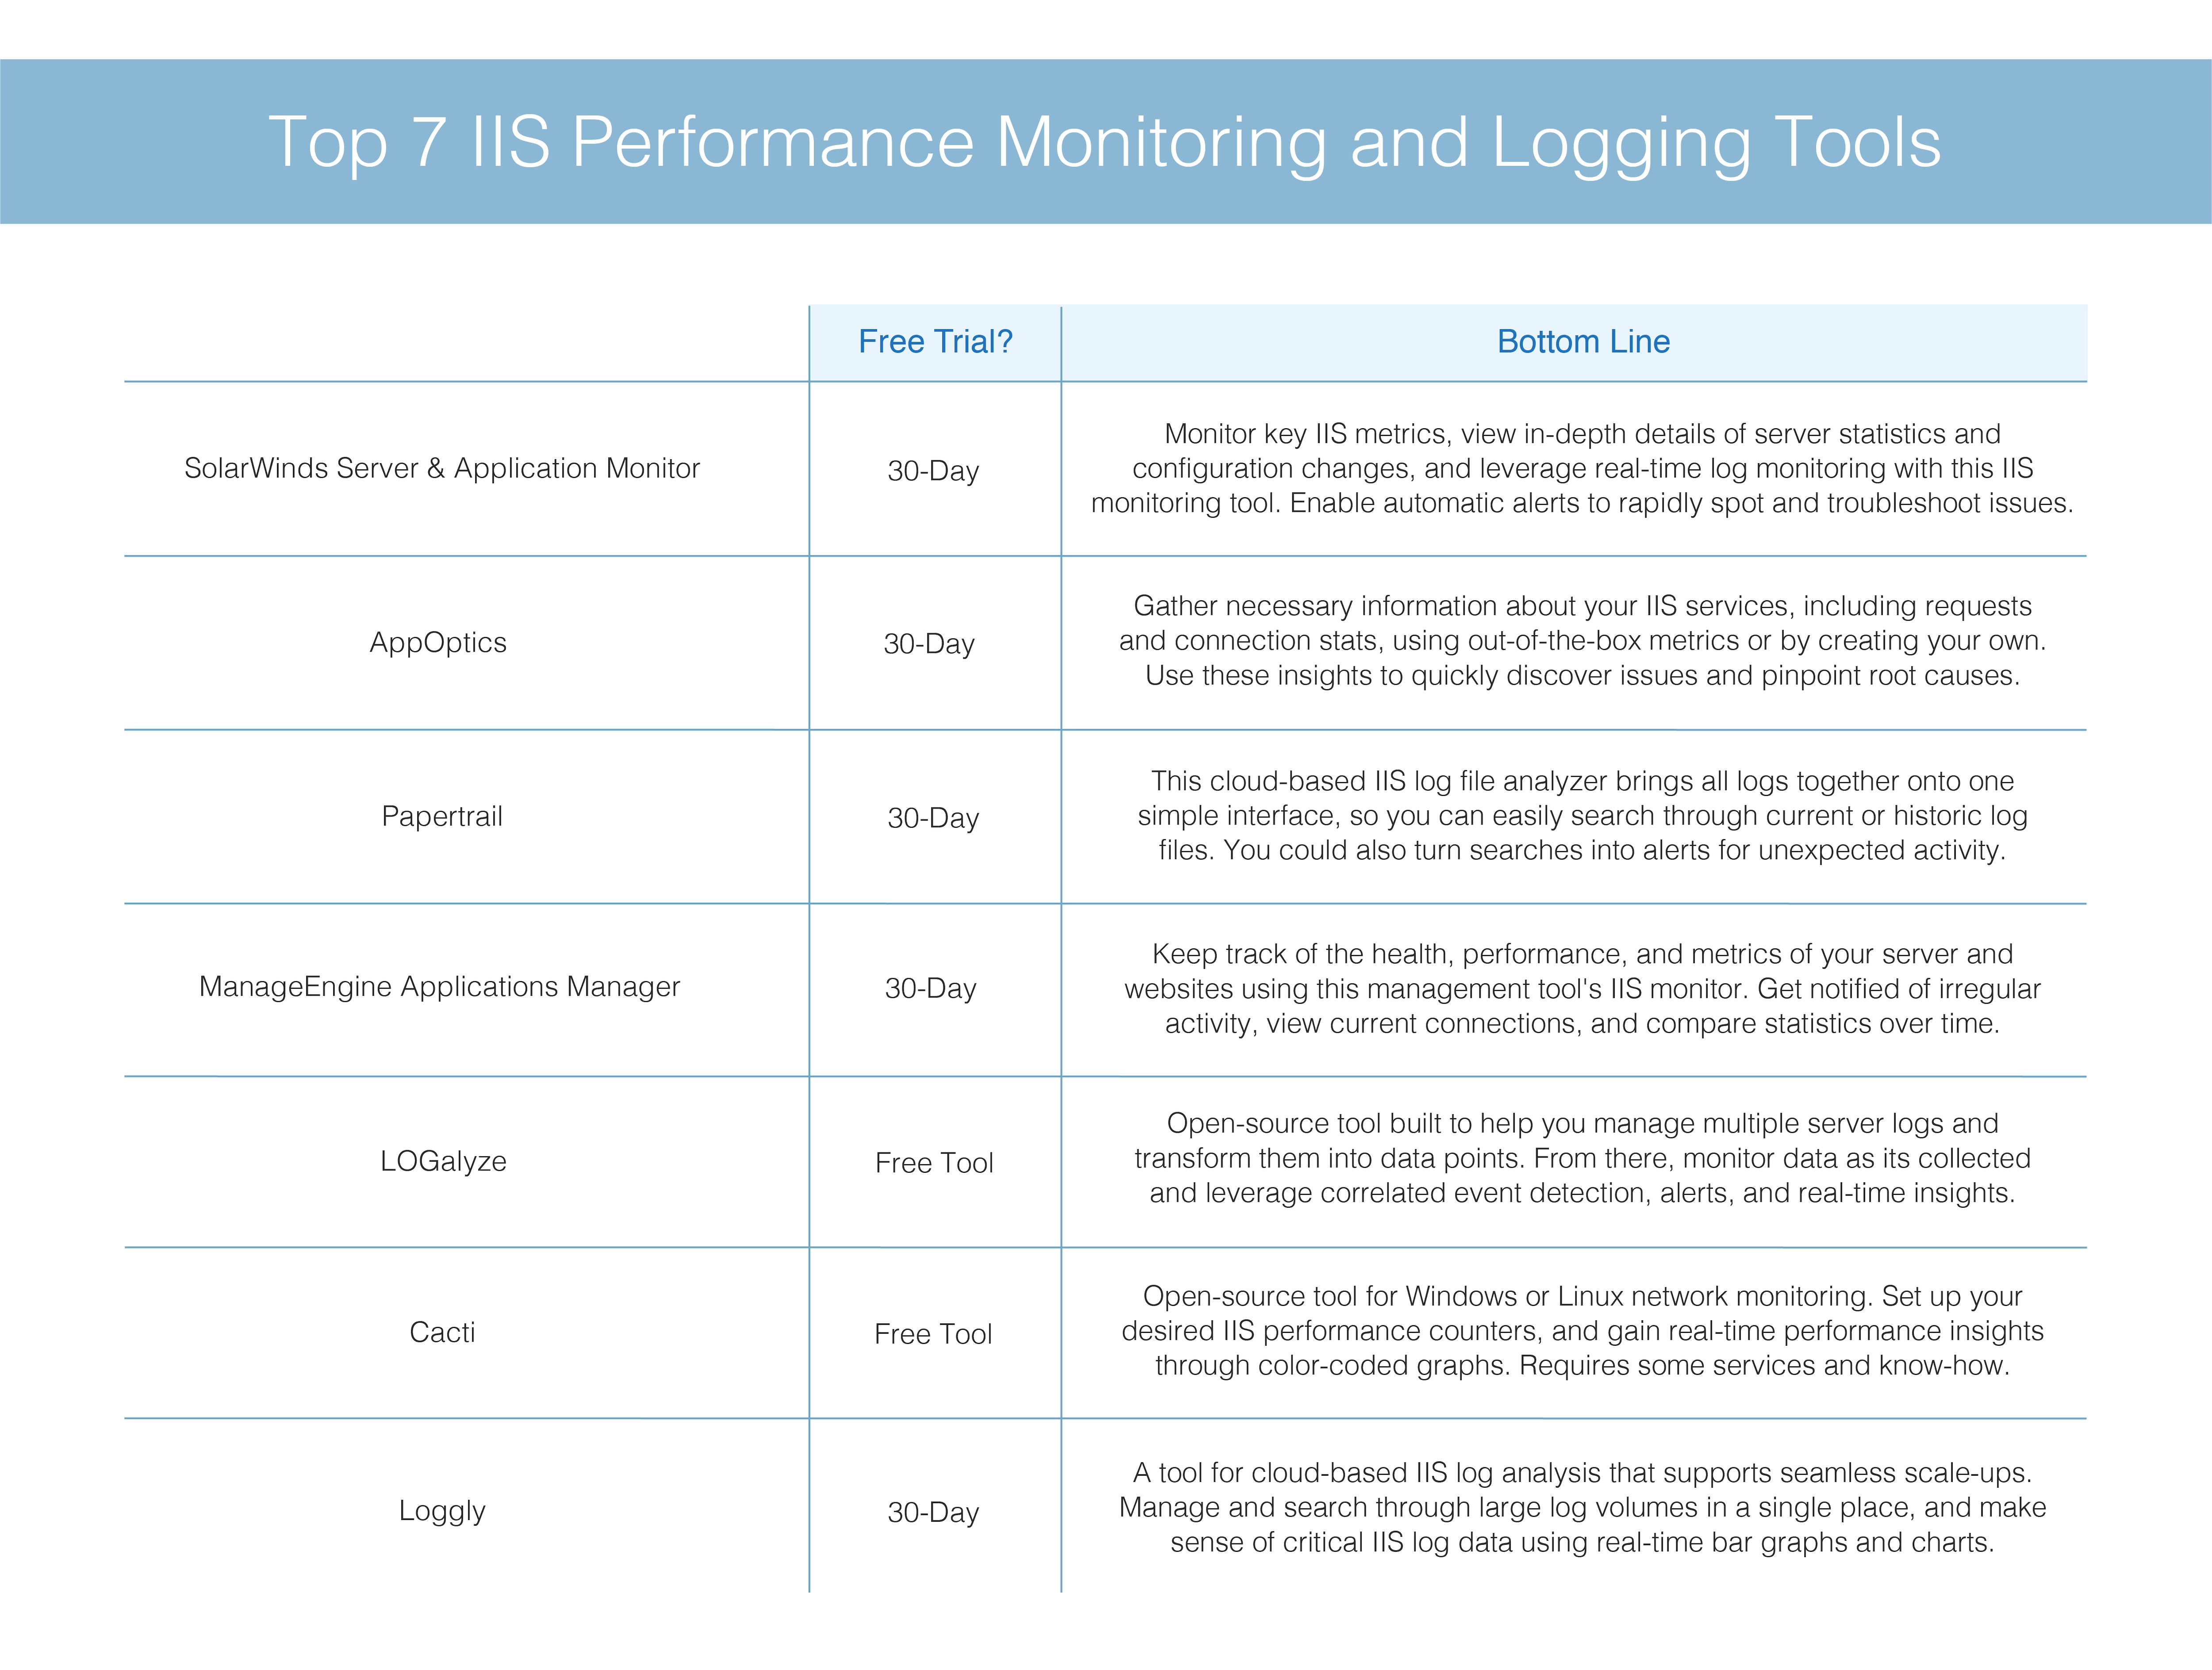
When you monitor IIS performance, you can locate and target problems more quickly—ideally before your end users begin experiencing the impact of those problems. It’s important to invest in effective server monitoring software, so you can rest easy knowing your IIS server is being monitored and your IIS logs are being analyzed. In this article, we will describe:
- SolarWinds® Server & Application Monitor
- AppOptics
- Papertrail
- ManageEngine Applications Manager
- LOGalyze
- Cacti
- Loggly
Top Solutions for IIS Logging and Performance Monitoring
SolarWinds Server & Application Monitor
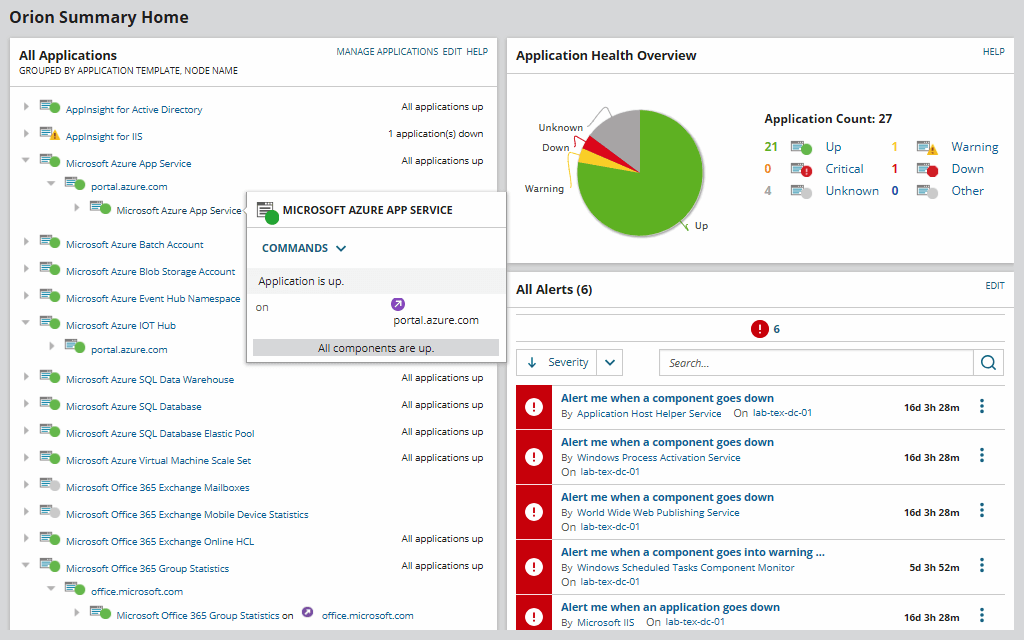
SolarWinds Server & Application Monitor (SAM) is designed to help you monitor IIS, keep track of performance, and make informed decisions about balancing website and server workloads. SAM also enables you to monitor response time, site and application pool performance, key server and website resources, and more to maintain high availability throughout your network.
SAM is also built to display in-depth details of your IIS web server, which can help you spot issues and troubleshoot them before end-users are negatively affected. Proactive, threshold-based SAM notifications could alert you of server or website downtime and perform automatic counter-actions. You can also view details about configuration changes across IIS servers and web files with SAM.
Along with IIS monitoring, SAM can enable you to monitor logs with the Real-Time Event Log Viewer. This built-in tool is designed to filter and monitor real-time events using a component monitor and lets you pause or restart polling. Event logs can be viewed in real-time on SAM and filtered by log type, event source, and severity level.
SolarWinds® AppOptics™
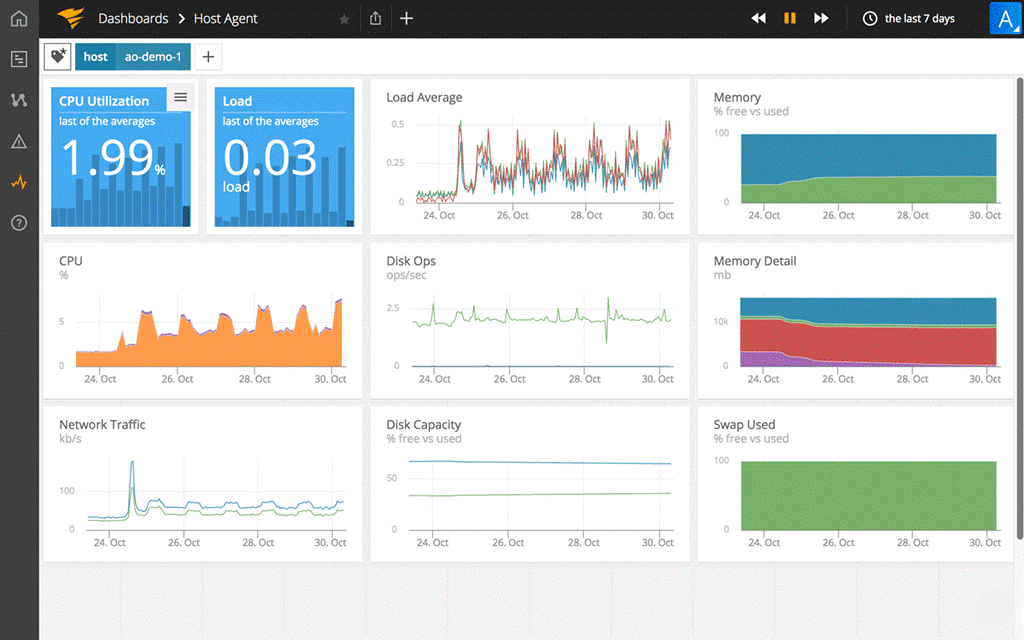
SolarWinds AppOptics is a SaaS solution that monitors important IIS server functions throughout your whole application stack. AppOptics collects and monitors the metrics you need to keep your IIS server performing effectively, offering insights to help you pinpoint the root causes behind performance issues.
When you install AppOptics, you receive more than 100 out-of-the-box metrics designed to give you all the information you need about your IIS services. The tool can gather data on the server’s CPU, memory, network, disk, and more. With the addition of a traffic plugin, the tool can also collect information about requests, connections, memory, and network statistics for your application pools and websites. If the included metrics don’t cover your needs, you can create your own custom or composite metrics. The IIS performance monitor also comes with an intelligent alerting system to inform you whenever a threshold is exceeded, so you can proactively monitor the first signs of trouble.
SolarWinds® Papertrail™
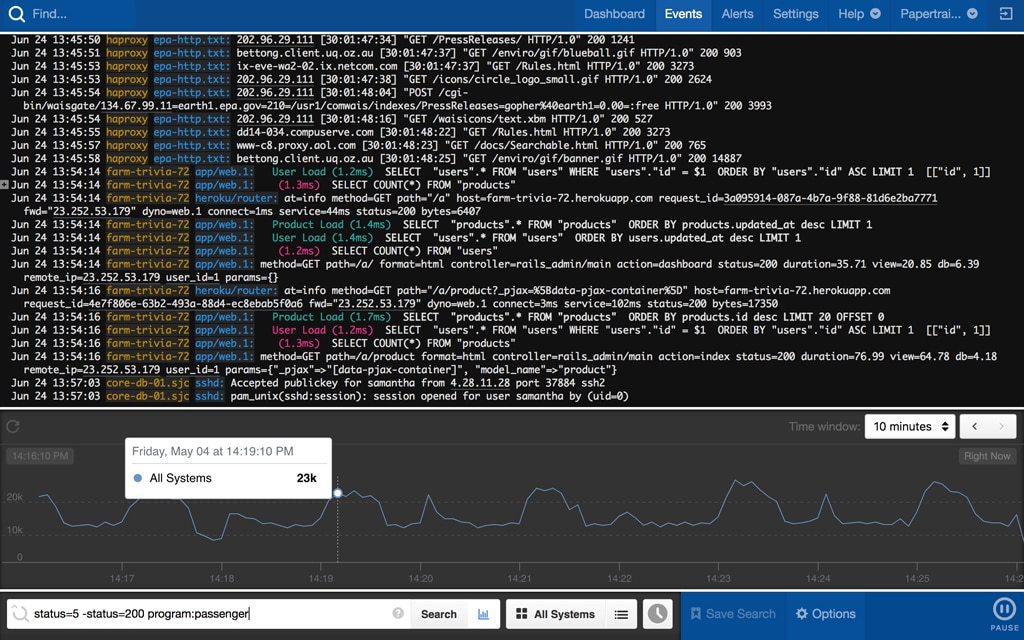
SolarWinds Papertrail is a cloud-based IIS log file analyzer that helps you make the most of your IIS logs. It aggregates, monitors, and analyzes all your IIS logs in one place. With all your logs collected together, it’s much easier to search through them if an issue arises.
Its clear and simple interface lets you discover patterns and trends in the data you can use to make educated decisions about optimization. You can also easily search through error and access logs using the advanced filtering and searching tools in Papertrail, which let you search by date, time, user ID, IP address, and more.
Papertrail provides access to both historic and current log files. By filtering event streams in real time, you can direct your attention to the most important entries, accelerating your troubleshooting process. Exclusion searches can also help you filter out unwanted distractions. At the same time, you can turn saved searches into alerts, so you get notified when an unexpected event happens. Or you can use inactivity alerts to stay informed about when expected events don’t happen.
ManageEngine Applications Manager
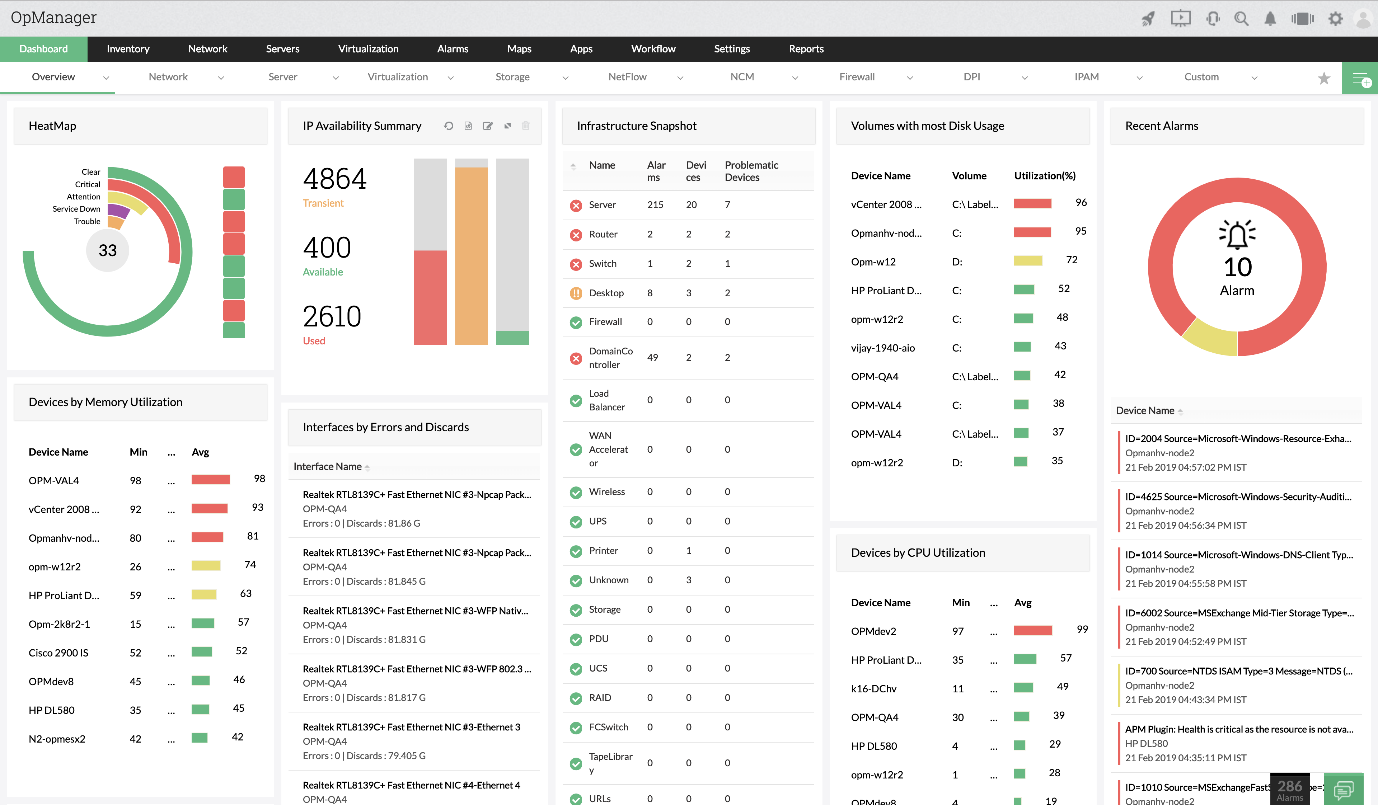
ManageEngine Applications Manager uses an IIS monitor designed to connect to your IIS server and check availability, response time, website status, and application pool statuses at regular intervals. This can help you keep track of the health and performance of your IIS server, compare statistics over time, and spot trends. Applications Manager is also designed to notify you of irregular IIS metrics, so you can detect issues as soon as they arise.
You can enable ManageEngine Applications Manager to monitor current load on websites by capturing bytes and files transferred per second. Access connection statistics through Applications Manager, such as the number of current connections or individual web transactions. This information can help you estimate how many anonymous users are on your websites and narrow down related issues with your IIS server.
LOGalyze
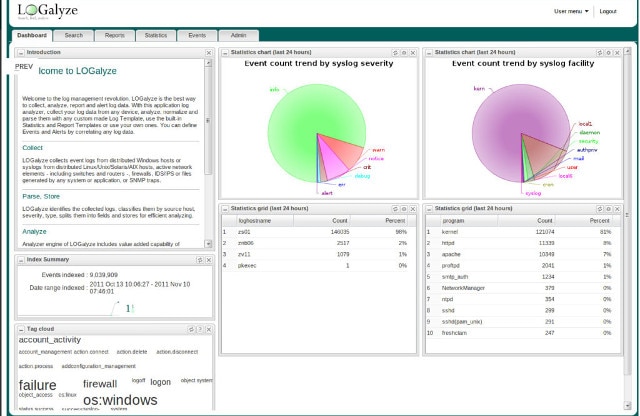
LOGalyze is an open-source product designed for security experts and system administrators. It’s built to help specialists manage their server logs and turn those logs into useful data points. While it comes with the support of an online community, the tool lacks the user-friendly interface and customer support of a paid solution.
LOGalyze uses the Simple Object Access Protocol (SOAP) method to allow multiple network devices, servers, and applications to feed event logs and syslogs into the tool. From there, you can monitor the data as it’s collected. LOGalyze includes an analyzer engine with correlated event detection and real-time insights. You can set up alerts for events matching your assigned criteria. You can also use the LOGalyze web interface to run and export dynamic reports for regulatory compliance.
Cacti
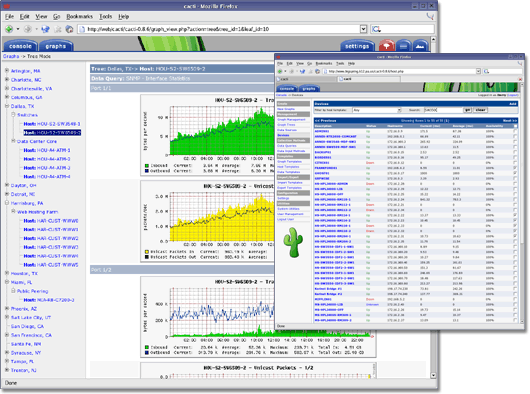
Cacti is an open-source network monitoring tool for Windows or Linux devices. This tool is focused on providing real-time performance insights through color-coded network graphs. Depending on your needs, the interface can display data for small LAN installations or large networks with thousands of devices. As with most open-source tools, using Cacti to monitor your IIS servers requires some specialized knowledge to ensure you set up appropriate IIS performance counters for both your server and web applications.
Cacti requires a webserver that supports PHP—both IIS and Apache are appropriate choices. You will also need MySQL, RRDTool, and net-snmp. Cacti integrates with devices using SNMP, while RRDTool provides Cacti’s graphing functionality.
SolarWinds® Loggly®
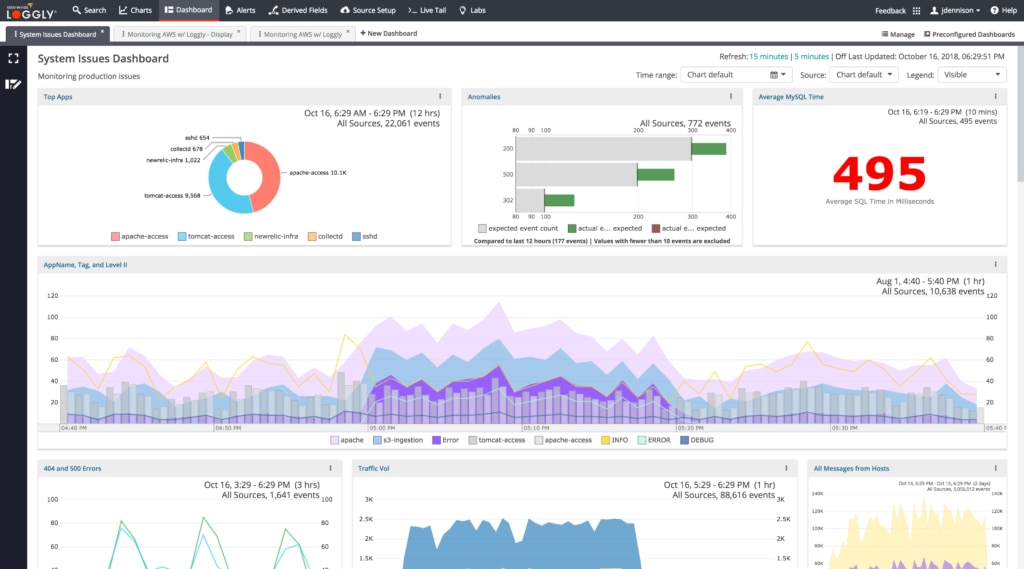
SolarWinds Loggly, a cloud-based SaaS solution, is another option for IIS log analysis. Loggly visualizes, organizes, parses, and indexes your IIS logs. Collect IIS logs and other system logs within a single tool, so there’s no need to jump between multiple tools to understand your system as a whole. Loggly can manage large log volumes and is designed to scale with you as you grow.
Loggly streamlines the process of understanding log data, so you can more quickly act on troubleshooting and optimizing IIS performance. Bar graphs and charts within the Loggy dashboards allow for real-time log visualization. The tool’s Dynamic Field Explorer™ is designed to provide a guided search experience, filtering out the noise and helping you browse the collected log data to find any anomalies or recurring patterns.