
Without SQL monitoring tools, database administrators have to create their own solutions for monitoring SQL database performance. This exhausting and frustrating process distracts from more important work, and these manual SQL monitoring solutions could lead to errors. Luckily, SQL monitoring software offers a faster and more effective solution.
A database performance monitor for various databases, including SQL Server, has to work across many servers and connect all the dots from across an entire IT infrastructure. It allows you to manage your relational database management system (RDBMS) and enables the discovery and simple display of SQL Server database performance metrics, which you can then reference to better understand your SQL Server needs, capabilities, and opportunities for the future.
The Importance of SQL Server Database Performance Monitoring
How to Monitor SQL Server Performance
SQL Server Database Performance Metrics
Recommended Tools for SQL Server Database Performance Monitoring
Final Thoughts on SQL Server Database Performance Monitoring
There are many SQL Server database performance monitoring tools available on the market, but not all have the same capabilities. In this article, I’ll dive into the details of a few remarkable SQL Server performance metric monitors, including SolarWinds® Database Performance Analyzer (DPA) and SolarWinds Server & Application Monitor (SAM). These SQL Server performance metric monitors are designed to help you fully comprehend the database’s health and performance, uncover critical performance issues, determine their root causes, and implement top SQL Server database performance practices.
I feel these will be loved by DBAs who work with large scale database environments as well as small companies who may be using cloud-based SQL databases. I prefer the combination of SolarWinds DPA and SAM based features like:
- Monitoring of SQL database performance metrics on a clear and accessible panel
- Database performance analysis based on anomalies in database performance, which additionally uses machine learning for more efficient problem detection
- A tool for analyzing individual database queries that simplifies performance tuning
- Real-time control of hardware, database servers, and memory with the ability to view how it affects the performance of a SQL database
A 14-day free trial of DPA and a 30-day free trial of SAM are available for download. Both are fully functional during the trial.
The Importance of SQL Server Database Performance Monitoring
Monitoring your SQL Server performance, health, and usage metrics will help you stay informed and up to date on how your SQL Server is functioning. This is crucial to maintaining optimal SQL Server database performance and provides helpful analytics for identifying performance tuning opportunities and other areas for growth.
The metrics found while monitoring your SQL Server database could also be used to discover and diagnose critical performance issues. Within the vast server metrics collected by SQL Server monitoring, it can be difficult to know where, when, and how to investigate a problem to uncover its root source. Many SQL Server performance metrics could indicate resource contention, error conditions, bottlenecks, and other complications.
Collecting these metrics is only the first step in the process of performance issue diagnosis, a critical aspect of SQL Server database performance monitoring. If you can properly organize and comprehend the vast amount of metrics available to you through effective SQL Server performance monitoring, you can solve current SQL performance problems as well as prepare for future SQL performance issues, and stop them from arising at all.
How to Monitor SQL Server Performance
The easiest and most efficient way to perform SQL Server database monitoring is to invest in a SQL Server performance monitoring tool. These applications are designed to collect important SQL Server metrics and display them using accessible visualizations, which in turn allow you to discover ways to improve overall SQL Server performance.
Although SQL Server database performance monitoring tools are certainly powerful, it’s still unwise to sit back and let them do all the work. SQL Server database performance monitors are designed to help you perform effective SQL Server monitoring, not simply do the tasks for you. I’ll list the three main types of performance problems you could encounter while monitoring your SQL Server performance and functionality.
1. Chronic Performance Problems
If your SQL is consistently responding slowly, isn’t improving, or is getting worse over time, you must pinpoint and address the problem as soon as possible. Before jumping to costly conclusions such as increasing your resources, updating system technologies, or “buying more metal” (adding devices to your SQL Server), try to tune your SQL Server using metrics collected through SQL Server database performance monitoring. You’ll be surprised at how a few small fixes of rogue queries could improve SQL Server speed, health, and overall performance.
2. Intermittent Performance Problems
Every database encounters complications, but you don’t want these sporadic issues to spawn into performance crises. It’s easier to solve intermittent SQL performance problems once you determine when, where, and under what conditions an issue occurs. Monitoring your SQL Server database throughout time will present you with historical records of previous metrics and indicators, which you can compare to present-day problems.
3. Acute Performance problems
If you aren’t constantly monitoring SQL Server performance, small problems that go unnoticed could yield big issues. Even tiny delays and complications that never expand to full-blown crises could result in user frustration, especially consistentlyslow SQL Server response times.
Databases can be prone to chronic, intermittent, and acute performance problems. It’s best practice to monitor your SQL Server to ensure optimal performance. A SQL Server database performance monitoring tool will help you gather and make sense of vital performance metrics, enabling you to easily discover root sources of issues and spot areas in need of improvement.
SQL Server Database Performance Metrics
To effectively monitor SQL Server database performance, you should have a basic grasp of certain SQL Server database performance metrics. There are many SQL Server performance metrics you can uncover, and this is by no means an extensive list—however, these metrics are, in my opinion, particularly useful and important to understand.
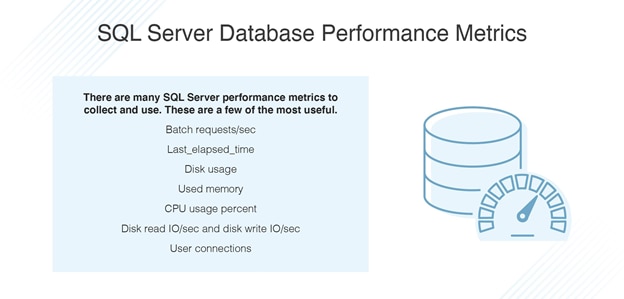
Batch Requests/Sec
The batch requests/second metric measures the rate of batches received per second. SQL query batches consist of two or more SQL statements, or even a single SQL query with the same effect as multiple SQL statements.
Last_elapsed_time
This SQL Server database performance metric demonstrates the time it took, in microseconds, to complete the most recent task or plan execution.
Disk Usage
Use this performance metric to find out how much disk space is being used by data or indexes in a given table. You can custom select which table or tables you’d like to view the disk usage of while performing this metric.
Used Memory
Similar to the above metric, the used memory SQL Server performance metric displays the amount of memory used in a resource pool, measured in kilobytes.
CPU Usage Percent
This SQL Server database performance metric can be deployed to find the percentage of your system’s CPU (Central Processing Unit) used by all workload groups of a given resource pool.
Disk Read IO/Sec and Disk Write IO/Sec
These two performance metrics both measure input and output time. Disk read IO/sec displays the count of disk read operations in the last second per resource pool, while disk write IO/sec displays the count of disk write operations in the last second per resource pool.
User Connections
The user connections SQL Server database performance metric will show you how many users are connected to your SQL Server at the time of measurement.
These SQL Server database performance metrics can allow you to access crucial information you can then analyze to more effectively monitor your SQL Server database. Again, these are just a few examples of useful SQL Server performance metrics—many metrics can offer more information on how to monitor SQL Server performance.
Recommended Tools for SQL Server Database Performance Monitoring
There are lots of options to choose from when it comes to SQL database performance monitors. Each tool comes with its own perks and downfalls, as well as other unique attributes and opportunities. I’ve chosen my top three SQL Server database performance monitoring tools based on their strength, features, and ease of use.
SolarWinds Database Performance Analyzer
My number one recommendation for monitoring your SQL Server performance metrics is SolarWinds Database Performance Analyzer (DPA). DPA enables cross-platform database tuning across a handful of SQL Servers including Oracle, Azure SQL Database, Microsoft SQL Server, MySQL, and PostgreSQL. This makes DPA an incredibly powerful tool, as you can compare metrics across your SQL Servers to best understand how to achieve your SQL Server performance goals.
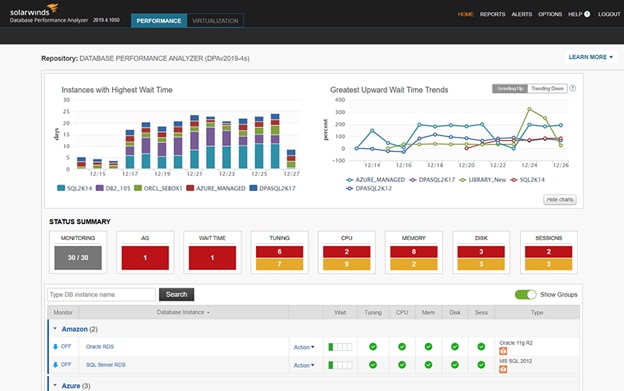
DPA can enable you to pinpoint root sources of poor performance using its multidimensional performance analysis feature, which correlates wait time with events and resources. DPA can also offer response time monitoring for rapid SQL statement analysis, enabling you to identify causes of performance complications. You can search for specific SQL queries or view them in tables with help from DPA, and DPA is designed to use these search functions to identify, diagnose, and resolve SQL blocking issues.
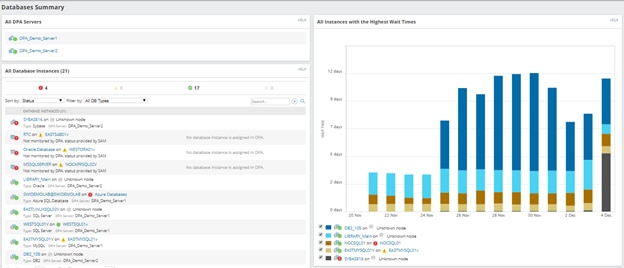
DPA is designed to create multiple dashboards displaying clear, customizable visualizations of SQL Server performance metrics in real time and throughout history. Drill into these details to analyze and compare anomalies, giving you in-depth knowledge of your past, present, and future SQL Server performance. The Top Blocking Sessions Tab dashboard could help highlight post-lock activity in your SQL Server, preventing blocked sessions from releasing locks to complete transactions, which could cause complications like race conditions. DPA also enables alerts notifying me of crucial performance issues and presenting me (with deep details) of the issue in real time. DPA comes with a 14-day free trial as well as an interactive demo, so you can try this powerful tool before purchase.
SolarWinds Server & Application Monitor
SolarWinds Server & Application Monitor is another fantastic SQL Server database performance monitoring software, which enables you to maintain and optimize SQL Server performance, health, speed, and general functionality. SAM is designed to identify blocked SQL queries and drill down into detail, discovering the reason for blocking. This eliminates the need for complicated in-house tools, and helps you quickly diagnose and resolve SQL Server performance issues before users are affected and become frustrated. Customizable alerts also allow you to stay on top of your SQL Server database performance, and SAM could send you these critical alarms along with actionable insights and other best practices.
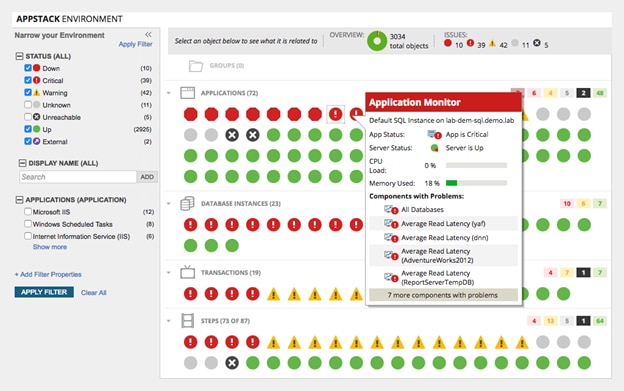
SAM can also enable you to uncover and remediate SQL Server performance problems through intuitive dashboards, which are designed to automatically map complex environments across physical and logical servers. SAM dashboards also support capacity forecasting and automatically gather health and performance metrics to help you understand your SQL Server database performance. You can enable SAM to pinpoint how your SQL Server structure influences overall performance using the AppStack™ management dashboard, guiding you to the right choices in regards to organization and expansion. There’s a 30-day trial of SolarWinds SAM available for download.
SolarWinds® SQL Sentry
SolarWinds SQL Sentry is designed to help you more easily tackle performance issues in SQL clusters. While troubleshooting SQL Server database issues can be difficult, so that’s why SQL Sentry is built to give DBAs fuller visibility across the entire data estate to help them more effectively troubleshoot and resolve problems.
By providing a quick view of real-time and historical events and performance data, SQL Sentry SQL Server database performance monitoring features can show execution plan diagrams, query history, and more to help you more easily find and fix potentially problematic queries.
With SQL Sentry, you can also:- Use the Deadlock Analysis feature to quickly determine the root cause of a deadlock, so you can restore the database to peak performance
- Leverage the integrated Top SQL view to gain detailed query analysis
- Automate incident response and remediation based on specific conditions
You can try SQL Sentry free for 14 days by downloading a free trial.
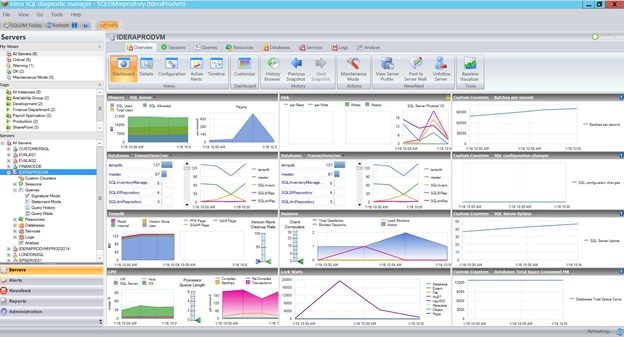
Idera SQL Diagnostic Manager
My final recommendation for a SQL Server database performance monitoring tool is Idera SQL Diagnostic Manager for SQL Server. This program can spot issues fast with SQL Server performance metrics, which are continually monitored. SQL Diagnostic Manager is designed to manage availability groups, job successes and failures, and other SQL Server performance metrics across operating systems. Browse through historical data and examine trends in detail with help from SQL Diagnostic Manager, which supports a sliding scale you can use to zoom in on specifics.
SQL Diagnostic Manager could create comprehensive reports of performance trends, forecast capacity planning, and offer alerts based on best practices. These alerts can be customizable, and SQL Diagnostic Manager enables you to easily put these alerts into place. SQL Diagnostic Manager, like SolarWinds DPA and SAM, can generate baselines to compare current performance issues to complications of the past. You can download a 14-day free trial of Idera SQL Diagnostic Manager.
Final Thoughts on SQL Server Database Performance Monitoring
Monitoring your SQL Server database performance is an essential aspect of maintaining optimal SQL Server health, capacity, and capability. To accurately and efficiently keep track of SQL Server performance metrics, invest in an SQL Server database performance monitoring software. The best SQL Server database performance monitoring tools will enable you to discover and diagnose critical performance problems and properly address latency issues, bottlenecks, resource allocation decisions, and more.
In my opinion, SolarWinds DPA and SAM are excellent options for SQL Server database performance monitoring software. These tools are designed to comprehensively monitor your SQL Server database performance, providing critical details and historical plus real-time insights into SQL Server performance metrics. Download a 14-day free trial of DPA or a 30-day free trial of SAM today and discover how these SQL Server performance monitors can save you time, energy, and money while optimizing the potential of your SQL Server database.