
Oracle tuning is a crucial part of ensuring fast data retrieval and maintaining optimum application performance. Database administrators, otherwise known as DBAs, are responsible for implementing Oracle database tuning best practices and identifying any database issues so that they can be resolved. Successful DBAs will have a robust understanding of how their database is organized, how the database components interact with each other, and how they contribute to achieving your organizational goals.
To do this, DBAs should have extensive knowledge of both the database and the computer language used by the database. The computer language retrieves, deletes, and modifies data stored in the database.
The Oracle database tuning best practices outlined below will help DBAs optimize database performance and solve problems when they arise. This guide will also discuss the advantages of implementing Oracle database tuning tools like SolarWinds Database Performance Analyzer (DPA).
What Is Oracle?
What Is Oracle Database Tuning?
Where to Start with Oracle Database Tuning
6 Oracle Database Tuning Best Practices
Choosing Oracle Database Tuning Tools

What Is Oracle?
Oracle Database is a relational database management system. It uses Structured Query Language, more commonly referred to as SQL, to create communications between applications and the database. This is a very popular database language, because it is highly flexible.
SQL lets you input, modify, access, retrieve, and delete database data, affording you a high level of control. It affords DBAs plenty of power, allowing them to give and remove access to a database. SQL can also be used to create views and functions.
SQL is nonprocedural, which means that instead of defining a course of action, SQL statements inform the database management system as to what should be done. This query language is easy to learn and able to be embedded in alternative host languages, which is a significant contributor to its appeal.
What Is Oracle Database Tuning?
When DBAs perform Oracle database tuning, they are attempting to optimize the database’s performance by making the SQL statement execution operations more efficient and streamlined. The purpose is to speed up and simplify the process of retrieving and modifying data stored in the database. By implementing the Oracle database tuning best practices set out in this guide, you should be able to achieve improved query response times and application processes.
Understanding Oracle tuning starts with developing a robust knowledge of the nature of relational databases. There are three key components that characterize a relational database:
- A way of storing information in tables, which are called “relations,” similar to a typical spreadsheet: columns represent “fields” with individual attributes, while rows represent single entries of data.
- An information system providing a computerized way of using and storing data.
- A method of storing, accessing, and consolidating data on behalf of applications, when necessary.
The relational database model serves as the foundation for a management system, which is used to create and manage relational databases. Oracle identifies three defining features of a database management system:
- Data dictionary: A repository of metadata that provides a read-only view of the data.
- Specified query language: The language for executing queries, which allows applications to access the database data.
- Kernel code: The element responsible for determining system settings and allocating memory.
Oracle Database is portable and available on all major platforms, including Unix and Windows. Learning to use it is relatively easy, because the architecture is quite generalized. It uses logical storage structures, including data blocks, segments, and schema objects. When physical storage space is allocated, it is done as data blocks, logically within the data files.
There are three types of database files:
- Control files: These outline the physical structure of the database, providing relevant details like the database name and time of creation.
- Redo logs: These files keep a record of any modifications that are made to the database. To function correctly, each Oracle database must have a minimum of two redo log files.
- Data files: These files, as their name suggests, store data and represent it as tables or indexes.
Once a database is created and initialized, background operations begin to run. Many of these are essential for normal system operation. Other background processes are responsible for performing maintenance and facilitating recovery operations.
There are two main types of memory structure used by the Oracle database to facilitate the retrieval and storage of data:
- Program Global Area (PGA): The PGA is a collection of memory regions, each of which contains control information for one server process. These memory regions are not shared.
- System Global Area (SGA): The SGA, in contrast, is a memory region that is shared. It holds the database’s data and internal control structures.
Where to Start with Oracle Database Tuning
Oracle tuning is primarily used to troubleshoot database performance issues. In many cases, it is difficult for DBAs to identify the root cause of a problem — for example, when a network user reports application delays or pages that are slow to load. A database bottleneck could be caused by numerous system components: the computer, the query statement coding, the optimizer, or even a combination.
Successfully troubleshooting an issue requires DBAs to consider every component of their database management system. This can be a stressful and labor-intensive process, with tuning operations touching on every single system element. It begins with system-level tuning, which is performed on instances, objects, and servers. Tuning of this nature is very important because without it, SQL statements are made largely redundant.
Before tuning single SQL statements, DBAs should assess instance settings, input and output measures, and optimizer statistics and parameters. If not assessed correctly, the optimizer may reverse SQL tuning later, making it obsolete.
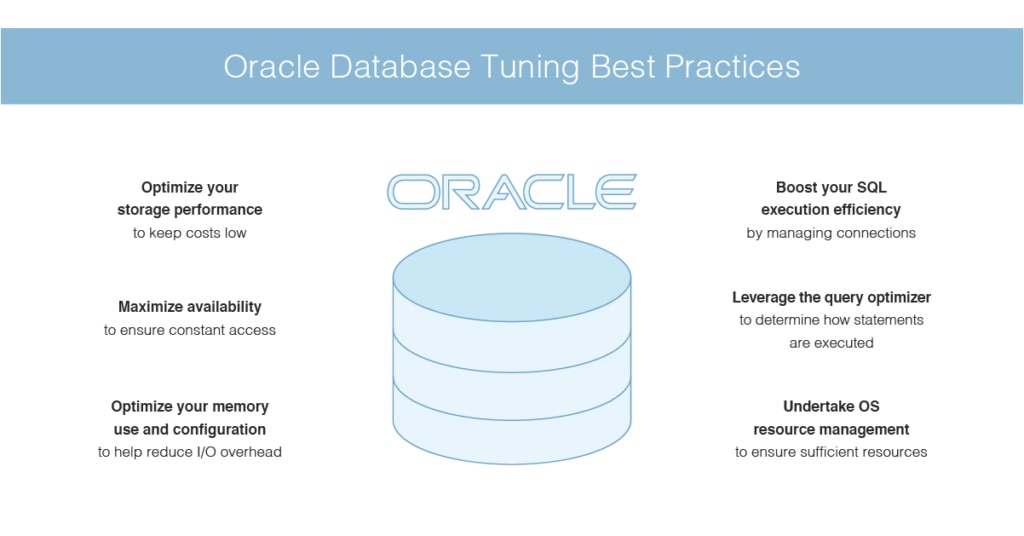
6 Oracle Database Tuning Best Practices
When Oracle database tuning best practices are implemented appropriately, getting to the root of a problem and resolving it can become a much simpler process. The following best practices can help DBAs improve database performance and solve issues.
Best Practice #1: Optimize Your Storage Performance
Your IT team will likely want to minimize the need to source additional storage, in order to keep storage costs low. You can reduce costs by partitioning underneath large databases.
Generally, businesses use two storage tiers. The first, the high-end storage array, is used by mission-critical applications. The second is used by applications that have lower requirements, and it costs less. However, the average database features a mix of active data and passive data. Active data — for example, call records — may only use a small portion of your database storage. Passive data — e.g., orders taken in the previous year — usually takes up significantly more storage space. If you want to optimize your storage performance, you can size your disk storage so that it matches the workload.
Random input/output (I/O) processes are actuated by inserts, deletes, and updates, which are activated by queries scanning the table in batches. A random I/O operation is measured in I/O operations per second. Sequential I/O operations are measured in the number of megabytes that are scanned per second (MB/s). Storage arrays should be sized based on the number of I/O operations per second that they can deliver. To figure out the MB/s and total number of I/O operations per second required for your current databases, check the reports for the workload repository.
Best Practice #2: Maximize Availability
Applications designed for enterprise use should offer maximum availability and deliver almost constant access. Achieving this requires you to implement safeguards that protect your application from unexpected downtime. This usually involves implementing architecture that features redundant components. To this end, Oracle has made available a blueprint, called “Maximum Availability Architecture,” that provides all the elements needed to eliminate datacenter complexity.
The Oracle Maximum Availability Architecture uses redundant elements to maximize production system efficiency. If you want to scale your enterprise applications and safeguard them against server failures, Oracle Real Application Clusters are recommended. With built-in Data Guard technology, the architecture is able to deliver highly effective disaster recovery processes. By using Oracle Active Data Guard, certain processes can be offloaded to standby systems, including reporting and backup activities.
In the Data Guard environment, transferring users between standby and production databases is easy, because the database version variations and operating systems are fully supported. As such, standby databases can be upgraded, and users with earlier versions are not left behind with outdated systems.
Best Practice #3: Optimize Your Memory Use and Configuration
Oracle users are encouraged to employ automatic memory management processes, but you are also given the opportunity to manually modify memory pools. Data is stored in memory caches and on disk, and accessing the former is significantly faster than accessing the latter. This means that disk access can increase the CPU resources that are needed.
To improve performance, you can modify your system settings so that memory manages data requests for objects that are regularly accessed. By optimizing the data access and retrieval process, you can reduce the physical I/O overhead, which is the overall goal.
SGA configuration becomes much simpler when Oracle Automatic Shared Memory Management is established. But to make the most of Automatic Shared Memory Management, you need to set your SGA_TARGET initialization parameter to a value that isn’t zero. Set the SGA_TARGET parameter to the amount of SGA-allocated memory you’d like to establish. The STATISTICS_LEVEL parameter should be set to TYPICAL.
With the appropriate configurations and buffer cache usage, you can make a marked improvement in the performance of your database. For certain operations, like parallel reads and sorting, the Oracle database can bypass the buffer cache. You can use the buffer cache to tune SQL statements for an application.
If parallel queries are being used, you should modify your configuration settings so that the buffer cache is used as an alternative to direct reads being executed into the PGA. This configuration is highly recommended if your server has a big memory capacity.
By using the buffer cache hit ratio or V$DB_CACHE_ADVICE, you are able to analyze your buffer cache activity. When you use V$DB_CACHE_ADVICE, make sure that the DB_CACHE_ADVICE parameter is set to ON. The buffer cache hit ratio is used to calculate how regularly a requested block could be detected from within the buffer cache without the disk needing to be accessed. It should be used to verify the physical I/O.
It is key that redo log buffer configurations not be overlooked. Redo data is generated when a server process modifies data blocks within the buffer cache. The user processes can copy new entries over earlier entries in the memory while the log writer attempts to write all the redo entries into the redo log file (read more about auditing logs here).
Best Practice #4: Boost Your SQL Execution Efficiency
SQL execution efficiency is a key part of system development, which is of the utmost importance during the design phase. Each database connection comes at a price, which is why DBAs aim to use the lowest number of concurrent connections possible. When applications of a multitiered nature are in use, it is recommended that connections be pooled.
User connections should be carefully and appropriately maintained to reduce parsing activity. Parsing is the process of analyzing SQL statements to establish an execution strategy. You can achieve this by loading shared structures, as well as by checking security and syntax. There are two types of parses: hard parses and soft parses.
- A hard parse refers to the process of performing all activities associated with a parse. As such, scaling a hard parse can be challenging. Hard parses tend to be resource-intensive.
- A soft parse requires that security checks be carried out, which can consume system resources.
Either way, parses are not ideal and should be avoided wherever possible. They can be avoided if developers design applications capable of parsing SQL statements a single time and then executing them numerous times. You can use cursors to do this. When opening a cursor, and executing it, developers should ensure that SQL statements are being shared with the shared pool. They can use bind variables, which represent the parts of a query, to achieve this.
Best Practice #5: Leverage the Query Optimizer
The query optimizer is a built-in software component. Its main function is to determine how SQL statements are executed. The optimizer has the option of executing statements in a number of ways, including via index scans, nested loops, full table scans, and hash joins. It analyzes the execution plan and, during this process, acknowledges multiple factors related to the objects and conditions within each query. This is an important part of SQL processing, which can reduce execution time when carried out correctly.
There are three main query optimizer activities:
- Query transformation: Each query portion is also a query block, and the query transformer input is a parsed query that is defined by a set of query blocks. The transformer’s main purpose is to determine whether it would be beneficial to rewrite existing statements into semantically equivalent ones.
- Estimation: The estimator can improve accuracy and is responsible for examining the execution plan cost, using available statistics.
- Plan generation: The plan generator tests various join methods and access paths to examine a range of plans for a query block. It then chooses the lowest-cost plan.
Best Practice #6: Undertake Operating System Resource Management
An issue with your operating system could be caused by a multitude of factors. If you have sufficiently tuned your database instance and discover that performance is still lagging, then you may lower your system time. Be sure that there is enough CPU power, I/O bandwidth, and swap space before doing this.
Many operating systems come with resource managers, which can help mitigate the effect of peak load use patterns. Keep in mind that operating system resource managers are not the same as domains. Domains can generate entirely distinct environments inside an individual system. When partitioned memory resource allocation processes are performing well, Oracle can run within domains and other environments that utilize a less partitioning model. Administrators usually prioritize allocation of resources in a global pool.
If you are using nodes with numerous instances and plan on dividing resources between them, it is important that each instance be attributed to a resource manager group. CPU resource distribution among instances should be managed through instance caging if you intend to run multiple instances within the managed entity. Remember that when CPU resources are managed, the database resource manager will need a set number of CPU resources for every single instance. If you use instance caging, the resource manager will automatically assume that CPU resource availability is equal to the total number of CPUs in the managed entity.
When you suspect that there may be a CPU problem, you should figure out whether enough CPU resources are available. Keep an eye out for resource overconsumption by the system. To facilitate the capture of various workload snapshots, Oracle features Statspack, Automatic Workload Repository, and UTLBSTAT. These three utilities can be very useful.
When identifying CPU utilization, 90% with a 10% waiting time is acceptable during peak times. If your system displays a high utilization value during standard workload levels, this could indicate that there is an issue.

Choosing Oracle Database Tuning Tools
Oracle tuning tools can help you identify the root cause of performance bottlenecks in your database and automate database performance tracking. They make implementing these best practices significantly easier, while reducing the likelihood of errors occurring.
There are a lot of Oracle database tuning tools on the market. One of the most popular and effective is SolarWinds Database Performance Analyzer (DPA). As a tool specifically designed for use with Oracle, it offers a range of capabilities that reflect the requirements of the Oracle database. Although the features are advanced and varied, the user interface is surprisingly simple. There is no initial learning curve, and no experience or training required.
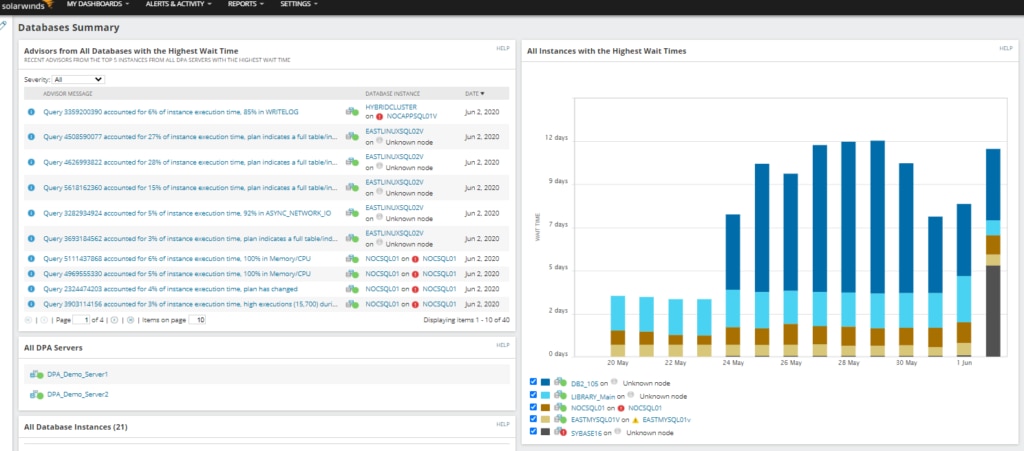
DPA offers users access to response-time analytics, which can help you correlate SQL statements, activity, wait events, and plenty of other dimensions. You are able to drill down into monitoring data, allowing you to rapidly and accurately identify the cause of slowdowns, and gain deep insight into your database.
This tool also affords you an at-a-glance view of your key database dimensions, covering SQL, client machines, waits, users, applications, and more. Data is displayed graphically, where appropriate, in the form of charts and graphs, giving you immediate visibility.
DPA features blocking analysis capabilities, which let you view the blocking hierarchy of your Oracle database. It also provides insight into the overall impact that blocking has on the performance of your database. It uses machine learning to power anomaly detection, helping you identify any unusual activity. The intelligent algorithm, which improves as time passes, gives you a complete understanding of your Oracle database’s wait patterns and behavior.
DPA features highly advanced query analysis functionalities. You can perform SQL and plan analysis as well as correlate query wait time resource metrics, blocking data, statistics, and much more. This tool even gives users access to tuning advisors, a feature designed to help you achieve your Oracle tuning objectives.
Alerts are intelligently designed to prevent your inbox from being overwhelmed by irrelevant or unimportant notifications. You can get started quickly with prebuilt monitoring alerts or, alternatively, customize your own alerts and set thresholds according to your preferences. This keeps noncritical alerts to a minimum.
This Oracle tuning tool is suitable for small and large businesses alike and is designed to grow with you. It is cost-effective in its scalability, so there’s no need to switch tools when your company expands. DPA offers plenty of maintenance support, including index advice, clever dashboard features that streamline the user experience, and custom metrics.
Getting Started with Oracle Tuning
Oracle database performance tuning is a complex and continuous task for DBAs, and when undertaken manually it can feel like an endless process. To save yourself time and stress, I recommend implementing Oracle tuning software. My preferred choice is SolarWinds DPA, a flexible, versatile tool that offers scalability, ease of use, and sophisticated capabilities. A fully functional 14-day free trial is available.