
SQL statements are the primary means through which businesses and organizations retrieve information from the database. However, these statements aren’t always as efficiently composed as they could be, which can lead to slowdowns from the server. That’s why you hear so much about SQL query optimization—it’s a necessary process if you hope to ensure high levels of server performance.
Part of the process of SQL optimization and tuning involves regular calibrations of SQL queries. Different SQL queries can be used to retrieve the same information, but not all queries are efficient—so it’s important to ensure you’re using the right queries to optimize how data is drawn from SQL databases and servers. Luckily, there are tools capable of helping you with this SQL query performance tuning process. In this guide, I highlight why SQL query optimization in important and what tools you can use to improve optimizing SQL query performance like SolarWinds® Database Performance Analyzer.
The Need for SQL Query Optimization
How to Check and Improve Query Performance
SQL Server Optimization Best Practices
Benefits of SQL Server Tuning Tools
Best SQL Query Performance Optimization Tools

The Need for SQL Query Optimization
Slow or failing SQL queries can lead to several problems for companies and organizations. Considering customers expect websites to respond quickly to their searches, significant lags and delays in database response time can lead to them taking their business elsewhere. While a few milliseconds of delay might not seem like much for individual actions or processes, they can quickly compound if spread across an entire company or business.
SQL tuning helps to make code more efficient, which is an important part of keeping database queries performing optimally. However, doing performance optimization and tuning by hand is a drain on the time and resources of database administrators. It’s also prone to human error, as it requires admins have the skills and expertise to not only be able to locate the underperforming queries, but also to know how to correct the code. This requires knowledge of top SQL statements and wait types, as well as blocked queries and an understanding of how indexes work—all of which tuning tools help make easier to manage.
How to Check and Improve Query Performance
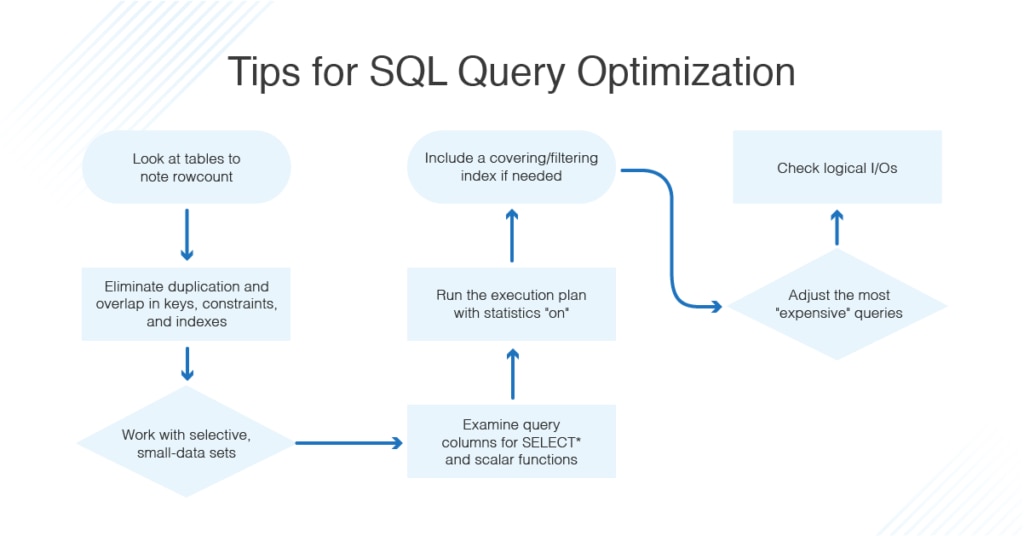
One of the most common questions during this process is about how to check query performance in SQL Server, a common SQL-based database. If you’re wondering how to check database performance in SQL Server, you would do well to start with investigating your queries and improving how they perform. To get started with SQL query optimization in SQL Server, you should consider these basic steps:
- When beginning the process of tuning a database, first make sure you are looking at tables (not views), and then make a note of the rowcount. Next, filter the rowcount by examining the WHERE and JOIN clauses.
- You’ll then want to ensure the tables are as selective as possible when working with smaller data sets.
- Next, examine the query columns for SELECT * and scalar functions that might retrieve more information than the query requires. Consider making the index searchable—this removes the need to perform a full scan on the database.
- Then look at the existing keys, constraints, and indexes to avoid duplication and overlap. Take note of the primary key definition and whether it’s clustered.
- Now you’re ready to run the execution plan. Make sure statistics are on before doing so. Once the plan has been run, examine the logical reads—fewer logical I/Os means the query is running faster—and record the results.
- Adjust the query by focusing on the most expensive operations, then run it again. Compare the results.
- If need be, consider adjusting the indexes to include a covering or filtering index (though you shouldn’t use the latter if you have parameterized statements).
SQL Server Optimization Best Practices
As you optimize SQL database performance, these general query and database optimization tips can help you improve performance on the syntactic level.
Choose SELECT Fields Over SELECT *
One easy way to cut down on the workload each query puts upon a database is to limit the amount of information each query retrieves. In the early process of running queries, many developers will use the SELECT * statement, which will retrieve all the available information stored in a database table. With large tables with multiple fields and rows, using SELECT * statements create a drain on database resources by potentially retrieving large amounts of unnecessary data.
By using SELECT statements with more specifically defined fields, admins can direct queries to retrieve only the necessary information.
Avoid SELECT DISTINCT Statements
While the SELECT DISTINCT state is useful for removing duplicates from a query, it uses a great amount of processing power. To avoid slowing down the query’s performance, you can select more fields to generate unique results.
Define Filters With WHERE Instead of HAVING
The primary goal of SQL tuning is efficiency, and in the SQL Order of Operations, WHERE clauses will be calculated before HAVING statements. This makes them more efficient for defining filters because they’ll limit the number of records retrieved from the database. However, HAVING statements should be used when filtering on aggregated fields.
Keep Wildcards at the End of Phrases
Wildcards are useful for creating extremely wide searches, which also runs the risk of being inefficient. Pairing a leading wildcard with an ending wildcard is especially so, as it will query the database for all records for text matching what’s between the two wildcards. If searching for customer names, for instance, %Son% would retrieve both “Sonia” and “Richardson,” whereas Son% would only return “Sonia.”
Use LIMIT to Sample Query Results
Using a LIMIT statement prior to running a query will allow database administrators to quickly survey a specified number of results to determine whether the query needs further refinement. Queries potentially returning a large number of results are taxing to run on databases and using a LIMIT statement streamlines the process of testing adjustments made to a query.
Use INNER JOIN Rather Than WHERE for Joins
While some SQL developers prefer to use WHERE clauses when making joins, this runs the risk of creating what’s known as a Cartesian Join. Also called Cartesian Products or CROSS JOINs, these joins generate all possible combinations of the variables listed in the SQL statement. This can quickly cause issues with large databases because all possible combinations from two data-rich tables could easily generate billions—if not trillions—of results. The INNER JOIN clause largely avoids this issue.
Benefits of SQL Server Tuning Tools
While SQL query tuning can be done manually, it’s a complicated and time-consuming process, which is why using SQL tuning tools can allow database administrators to more efficiently maximize the performance of their servers and databases. SQL query performance tuning tools are an essential part of comprehensive monitoring for SQL Server, which in turn frees up admins and technology support staff to devote their attention to resolving more mission-critical issues.
The best SQL query optimization tools will include three primary functions:
- SQL tuning: This refers to the tool’s ability to rewrite the code of SQL statement to improve the performance of servers and databases.
- Monitoring of cloud-based databases: With the shift toward cloud-based computing and networking, many SQL tuning applications now include the ability to monitor databases regardless of where they’re housed.
- Online optimization: The ability to remotely access and optimize queries from mobile devices and web browsers—rather than needing to do so from a dedicated workstation in a certain physical location—makes the process of SQL statement tuning much more convenient to navigate.
Tuning tools provide added functionality and ease of use for SQL query optimization. SQL Server tuning applications monitor database performance and will often provide user interfaces with graphic representations of query performance and wait times, which can help administrators identify resource bottlenecks with greater speed and accuracy. By creating a historical log of performance metrics, these monitoring tools are an invaluable part of making sure all current SQL queries are working as efficiently as possible.
Many tools assisting with query optimization in SQL Server come with built-in customizable alerting and notification systems to automatically identify and remediate queries performing poorly. Because this removes the need for a database administrator to approve or implement suggested changes, SQL Server tuning tools can cut down on response time when resolving server issues as they arise. By proactively managing and monitoring SQL queries, database admins can ensure SQL queries continue to operate efficiently going forward, while potentially staving off issues before they happen.

Best SQL Query Performance Optimization Tools
While it’s definitely helpful to know some of the nitty-gritty of how to manually tune SQL queries, part of the appeal of SQL query optimization tools is their ability to streamline the tuning process and can even offer advice on clauses and statements where efficiency can be improved. Here are three of my favorites for you to check out.
SolarWinds Database Performance Analyzer
This SQL query performance tuning application is designed for both performance monitoring and query tuning. I favor Database Performance Analyzer for a lot of the same reasons I like other SolarWinds programs—specifically because it comes laden with several customizable features, including intuitive dashboards allowing you to easily track the performance of SQL queries and client machines and to quickly detect patterns over time with color-coded metrics.
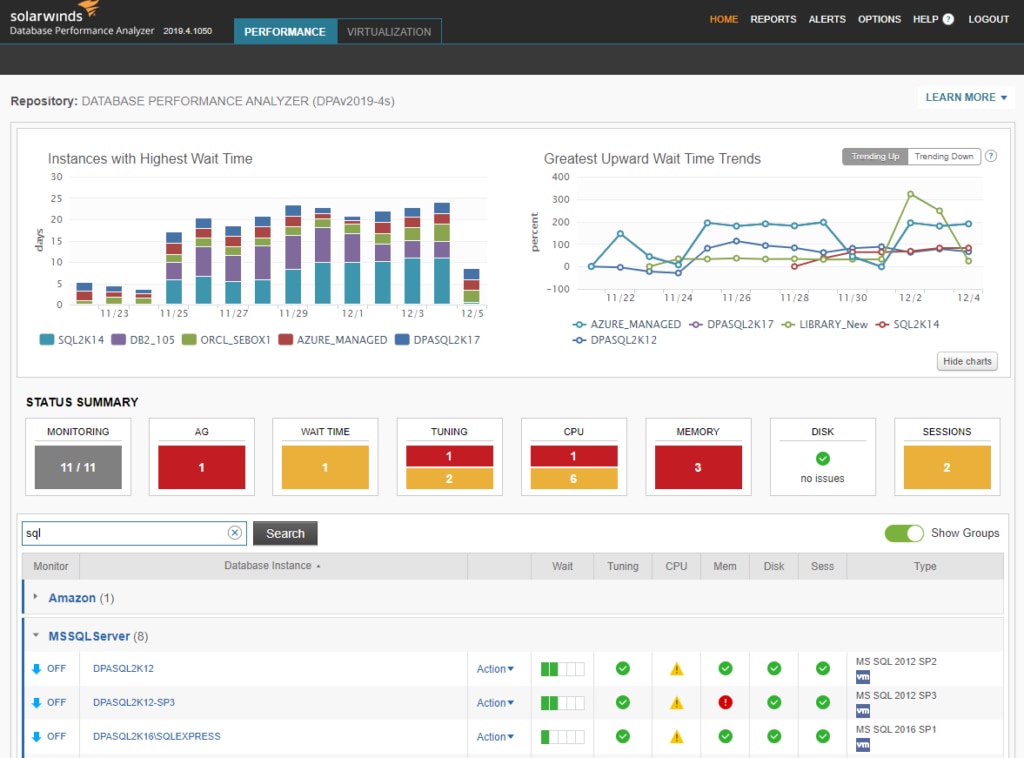
Database Performance Analyzer provides round-the-clock monitoring for databases and uses anomaly-based detection protocols to identify underperforming queries. The approachable user interface provides both big-picture views on holistic network performance and granular detail like the Top Waits for SQL, which allows admins to swiftly identify the queries in most need of attention.
Database Performance Analyzer creates a historical performance record, synthesizing almost-real-time data with historical and current metrics to create bar charts that, when paired with customizable alerts and notifications, can quickly keep admins informed of potential issues. Tuning advisors also offer suggestions about queries needing immediate attention.
All in all, it’s an excellent and comprehensive option fully compatible with other SolarWinds products. If you’re looking to try before you buy, I encourage you to check out their free 14-day product trial.
SolarWinds SQL Sentry
© 2023 SolarWinds Worldwide, LLC. All rights reserved.
This SQL query performance tuning and database management application can also be used for tuning SQL queries. SQL Sentry allows database admins to establish performance benchmark protocols to be applied to SQL servers and databases to spot resource bottlenecks and underperforming SQL queries.
SQ features a block detection functionality displaying blocking processes in a graphical interface similar to SolarWinds Database Performance Analyzer. SQL Sentry also tracks the processes resulting in deadlocks and provides advice on what changes to implement when tuning queries.
SQL Sentry automates a large portion of the monitoring process as well and includes more than 100 built-in alert conditions to keep database admins informed of performance issues as they occur. SQL Sentry can also be customized to automatically respond when one of the threshold conditions has been met. By automating the majority of SQL query optimization and management, its alerting system frees up admins for more pressing tasks.
A free trial of SQL Sentry is available to try for 14 days.
Paessler PRTG Network Monitor
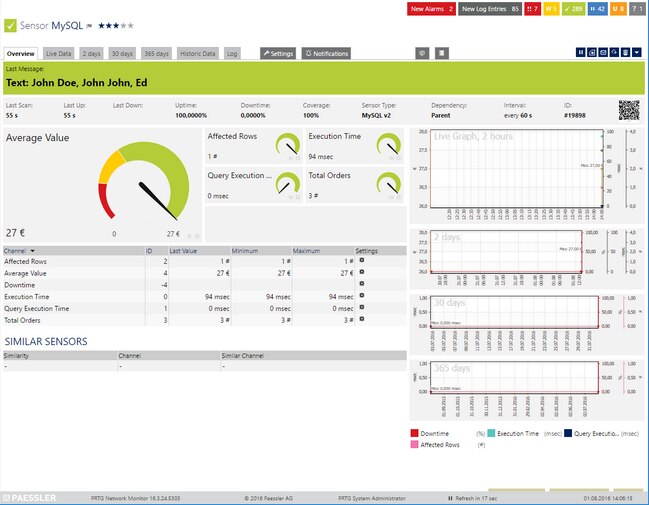
Another strong contender for SQL query performance tuning is Paessler’s PRTG Network Monitor. This network monitoring tool can be used to track performance metrics for several SQL database varieties—including Microsoft SQL Server, MySQL, Oracle SQL, and PostgreSQL—which it does through individual database sensors. The sensors are quickly configured during start-up and do not require additional maintenance once active.
For SQL query optimization in SQL Server, PRTG Network Monitor tracks SQL queries at every phase of the request and displays execution times in a dashboard interface for quick assessment of performance issues. The application’s broad network monitoring capabilities also provide visibility into wider network issues potentially affecting the performance of your servers and databases. The breadth of information the tool tracks makes for a streamlined SQL query performance tuning experience.
Like the other two options here, PRTG Network Monitor features an alerting system working to keep all key players informed should potential performance issues arise. The alerts can also be customized, but PRTG Network Monitor includes an added API functionality allowing admins to write notification scripts tailored precisely to the specifications of their networks, servers, and databases.