
SQL stands for Structured Query Language, and it’s generally considered the standard language for relational database management systems. SQL is basically the database communicator, while SQL statements encompass what’s being communicated. Statements are used to execute tasks, like updating or retrieving data.
Thankfully, the SQL language is simple and user-friendly, on account of the syntax being familiar. This is one of the reasons SQL is used by so many popular relational database management systems, including Microsoft SQL Server, Access, Ingres, Oracle, and Sybase. The standard SQL commands (like Select, Update, Delete, Insert, Create, and Drop) can be used to execute almost any task, making SQL a versatile language.
Just because SQL is user-friendly doesn’t mean SQL Server optimization is easy. In fact, the approach varies significantly between databases, because the SQL command is subject to the unique functions associated with the database. Before I go into SQL Server optimization tools, I’ll run through the various ways SQL databases can be optimized.
- SQL Server Database Optimization Strategies
- When to Stop SQL Server Database Optimization
- Best SQL Server Optimization Tools List

SQL Server Database Optimization Strategies
There are six main ways to conduct SQL Server optimization:
- Proper indexing.
- Eliminating correlated subqueries.
- Avoiding coding loops.
- Retrieving relevant data.
- Avoiding or using temporary tables.
- Using execution plans.

Proper Indexing
An index is essentially a data structure, which makes retrieving data much faster. A “unique index” divides data into columns that don’t overlap. Proper indexing requires balance: If you go overboard and index excessively, it’ll make the update and insert triggers pointless. If you don’t do enough indexing, or don’t index at all, then processing will be extremely slow.
Eliminating Correlated Subqueries
A correlated subquery, a type of SQL query, uses the values given to it by the parent query. Correlated subqueries run on a row-by-row basis, running once for every row returned by the outer/parent query. This negatively impacts SQL query performance, so you should avoid correlated subqueries wherever possible. To do so, use the INNER JOIN command, instead of the correlated subquery. Remember, however, correlated subqueries are sometimes necessary.
Avoiding Coding Loops
Avoiding coding loops is an important part of SQL Server database optimization, because coding loops slow down sequences. To keep from using coding loops, use the UPDATE or INSERT commands for individual roles. You’ll also need to ensure the WHERE command doesn’t update stored data, to prevent it from matching with existing data.
Retrieving Relevant Data
To make sure the data you’re retrieving is relevant, you need to be specific about the data you require. Instead of using the SELECT * command, try using * and LIMIT. The asterisk (*) command lets you specify data from columns, while the LIMIT command helps with retrieving data from a specific number of rows, instead of the entire bunch. This lets you fine-tune what you retrieve.
Specifying in this way is especially useful when you’re accessing data from a large source, and the process can save you time and resources. I recommend being sparing during your selections, as this can help prevent unnecessary system errors in the future. Moreover, by limiting the data you retrieve, you reduce the amount of SQL Server database optimization you need to do in the future.
Avoiding or Using Temporary Tables
Keep it simple. If code can be simplified, then you should always do so. Don’t complicate it unnecessarily with temporary tables. In certain situations, temporary tables are essential—for example, if you need to establish a specific procedure with multiple queries. But unnecessary temporary tables can be counterproductive to SQL Server database optimization.
Using Execution Plans
Execution plans are a key part of SQL Server optimization, because they contribute to the creation of proper indexes and graphically display the full range of ways data can be retrieved. These plans help in creating necessary indexes and are integral to the overall SQL Server optimization process. They essentially facilitate optimization, so they shouldn’t be overlooked.

These are just six of the many approaches to SQL Server database optimization. Optimization pathways should be combined to achieve optimal SQL Server performance. But staying on top of all these methods at once can be time-consuming and resource intensive. Having SQL Server optimization tools at your disposal will take the pressure off.
When to Stop SQL Server Database Optimization
This is an important question. The idea of “optimizing” can seem indefinite—after all, continuous improvement is a key part of any business model. If you wanted to, you could pursue SQL Server database optimization of individual queries forever. Knowing when to stop is key.
To achieve optimal performance of a query, you need to consider how much it costs, how much time is being spent on optimization, and whether it’s worth it. If you continue to optimize until the benefits of optimization no longer justify the cost, then you’ve gone too far.
The following checkpoints are useful to refer to in determining when to stop:
- The query now performs in a satisfactory way.
- The resources needed to continue to optimize are too expensive and unjustifiable.
- Further optimization would result in diminishing returns.
- A different solution has been discovered, rendering further optimization unnecessary.
Though knowing when to stop optimizing a query is important, big-picture SQL Server database optimization is limitless, because the database itself is constantly changing. Many SQL Server optimization tools handle the process for you, so you don’t have to spend valuable time and resources figuring out when to stop.

Best SQL Server Optimization Tools List
Now that you have a better idea of what SQL Server optimization is and how to do it, it’s time to look at my favorite SQL Server diagnostic tools. Of all the SQL Server diagnostic tools on the market, SolarWinds®Database Performance Analyzer ranks the highest. It is user friendly and feature rich, with advanced utilities.
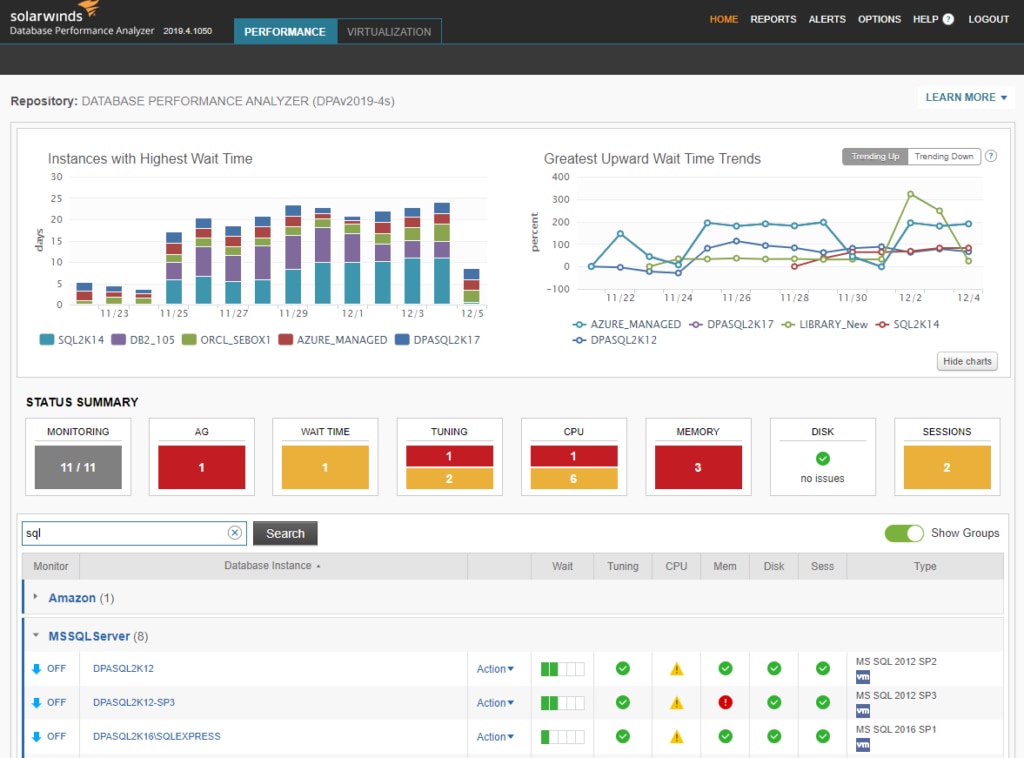
SolarWinds Database Performance Analyzer (DPA) covers SQL query analysis, tuning, and performance monitoring. It uses a methodology called response time analysis, which focuses on the time between a query request being issued and the corresponding response being received.
By analyzing wait times and events, SolarWinds DPA makes the process of identifying bottlenecks much simpler. This is a unique approach to SQL Server query optimization, and as such sets DPA apart from its competitors.
DPA also boasts some fantastic troubleshooting utilities. Like all SolarWinds products, it includes an impressive and easy-to-use interface. Data is presented in a dynamic and graphic way, meaning data can be interpreted at a glance. You can view information on wait times, query advice, database instances, CPU, disk, memory, and sessions from within the dashboard. You can also drill down into the data to access more details, which keeps your dashboard from being cluttered with information.
DPA allows you to monitor and measure query and execution time and provides tuning advice. It’s an extremely dependable product and can be integrated with other SolarWinds tools, if you want to expand your solution. A 14-day free trial is available.
SQL Sentry is designed to give DBAs visibility across the entire data estate. With a quick view of real-time and historical events and performance data, SQL Sentry shows execution plan diagrams, query history, and more to support SQL Server optimization and your ability to find and fix potentially problematic queries quickly.
With SQL Sentry, you can:
• Monitor IO at multiple levels, such as storage, OS, and database levels
• Use Top SQL View, which provides detailed analysis to help optimize queries
• Set up alerts designed to help users fix issues
The query analysis capabilities in SQL Sentry are designed to go far beyond what you’ll find in SQL Server Management Studio (SSMS), giving you the information you need to quickly resolve problems.
Try SQL Sentry for free for 14 days.
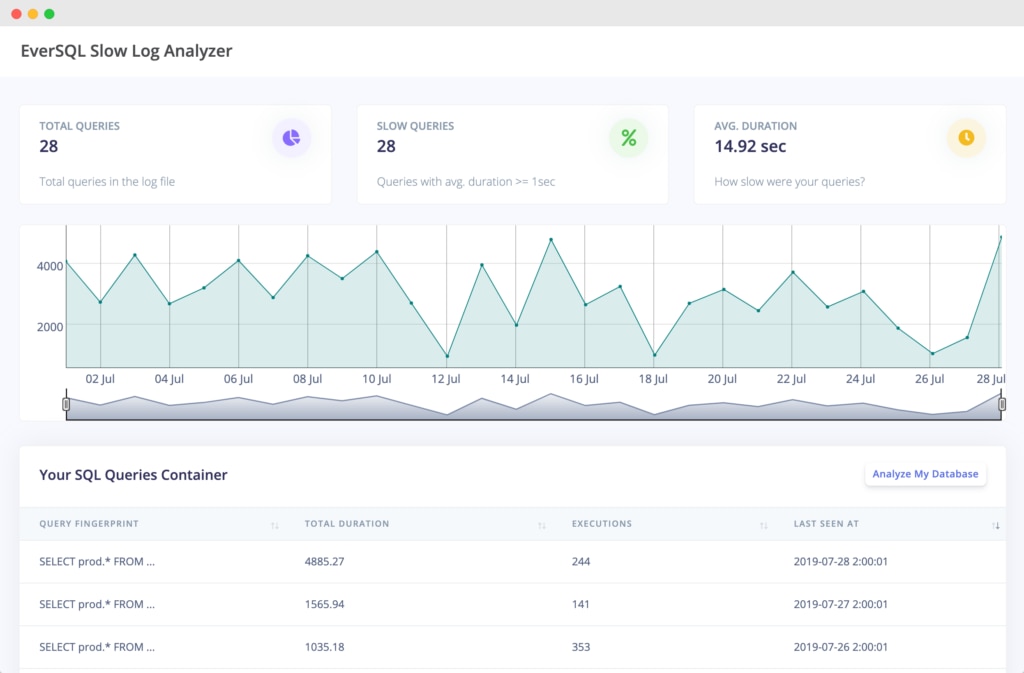
I’ve included EverSQL on this list because of its unusual approach to SQL Server optimization. This is an online tool, which comes with its benefits. You don’t have to download or install anything, for a start—all you need to use it is an internet connection. Still, while impressive, EverSQL can’t offer the same power and scalability of some other SQL Server diagnostic tools and may not be suited to business use.
EverSQL supports most paid, free, and even open-source database engines, including Oracle, MySQL, Microsoft SQL, Percona DB, and MariaDB. The tool couldn’t be simpler: once you’ve connected to the EverSQL website, just select the database type and version, then paste the SQL query code in. You can get indexing recommendations and apply advanced query transformations by uploading your database’s schema structure. You have the option of analyzing single queries or analyzing slow query logs.
EverSQL also provides other tools, including EverSQL Minifier for SQL statements, a query formatter, and a SQL query syntax check and validator. You can optimize three queries for free, if you want to try EverSQL before committing.
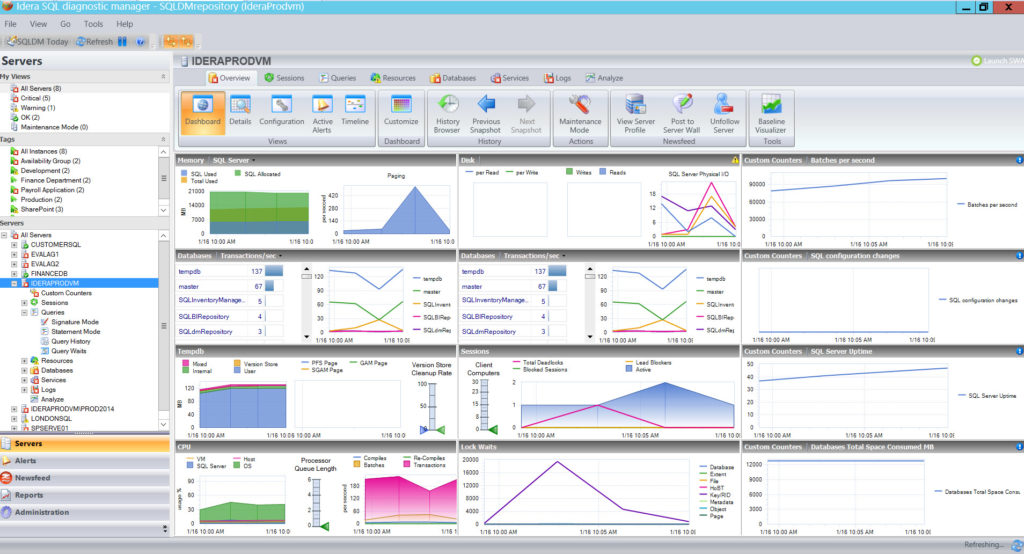
If you’re looking for SQL Server diagnostic tools designed to prioritize profiling and tuning queries, then SQL Query Tuner is a good option.
This program is part of the Idera SQL Diagnostic Manager offering, a comprehensive solution to help you locate query bottlenecks via query capture, advanced filtering, and user-friendly data visualizations. All these intuitively designed features aim to make finding and resolving issues faster and simpler. With this tool, you can also expert intelligent alerts, which help you keep administrators up to date. Automatic email notifications go out when something is amiss, or system health is at risk.
My favorite thing about this tool is how you can view expert recommendations within the console, helping you deploy proven fixes, even for unusual problems. This sets it apart from most other SQL Server diagnostic tools. My only issue with it is the dashboard aesthetic could be improved upon, as it can seem basic in some places. SQL Query Tuner is an add-on for SQL Diagnostic Manager. A 14-day free trial is available.
Last, but not least, we feature another offering by SolarWinds: AppOptics. This tool is a cloud-based solution that enables users to track a wide array of metrics throughout their whole IT ecosystem. When it comes to the database monitoring features, AppOptics supports not only SQL Server, but also Oracle, MySQL, PostgreSQL, and others.
In order to enable SQL Server monitoring, you have to install a plugin. The installation is quick and easy, and in just a few minutes you’re able to start monitoring your SQL servers, staying on top of several metrics that include database performance, IO, memory and Azure resource utilization. The tool enables you to detect slow or inefficient SQL queries as they run, allowing you to act proactively and prevent them from becoming more serious issues.

AppOptics comes with a large number of built-in metrics, allowing you to monitor application health and performance through all layers of your IT infrastructure. However, you can also generate custom metrics. Then, you can use AppOptics’ customizable dashboards to closely monitor both default and custom metrics. That way you can view how your whole ecosystem is behaving at a glance, obtaining insights you wouldn’t be able to get otherwise.
A valuable feature for monitoring tools is the ability to integrate with third-party solutions, and that’s certainly an area where AppOptics shines, offering integrations with popular services like Slack. That way, you can set up notification alerts to be sure the relevant people are notified when an incident happens.
If you want to check out AppOptics, use the fully-functional 14 day trial.
Conclusion
SQL is a user-friendly language, adopted by relational databases as the standard interface to manipulate data. That doesn’t mean that database diagnostic and optimization is easy. Quite the opposite. That’s why you can’t do it by yourself—you have to leverage the power of tools at your disposal. Only by doing that you can keep your SQL Server databases running at the top of their game, which will improve the performance of your entire IT infrastructure, resulting in an overall better user experience for your customers.
All tools present today have their merits. If I had to pick one to recommend, though, it would be SolarWinds® Database Performance Analyzer. It combines a user-friendly and intuitive interface with unparalleled monitoring and analyzing capabilities. By using its unique response time analysis approach, DPA makes it way easier to detected and fix bottlenecks, bringing down both the mean time to detect and mean time to fix metrics, which results in an improved user experience for the end-user.