
Databases are at the center of most fundamental business processes. As applications become more complicated, IT infrastructures become increasingly diverse and sophisticated. This is a good thing—our IT technology is advancing, becoming more versatile and evolved. But with this evolution comes the issue of troubleshooting and problem rectification.
In such wide-ranging infrastructures, finding the source of an issue is even more difficult than it has been in the past. This is where database monitoring comes in.
In this guide, I’ll discuss the advantages of database monitoring, along with best practices for monitoring database performance. Building on that, I compiled a list of the best database monitoring tools, including my in-depth review of SolarWinds® Database Performance Analyzer, to help you sort through the many software options on the market.
What Is Database Monitoring?
Key Advantages of Database Monitoring
How to Monitor Database Performance
Common Approaches to Database Monitoring
Most Important Database Performance Metrics to Monitor
Database Monitoring Best Practices
Manual vs. Automated Database Monitoring
List of Best Database Monitoring Software
How to Choose the Best Database Monitoring Tool

What Is Database Monitoring?
Database monitoring is the process of measuring and tracking database performance according to key metrics influencing it. These metrics are typically monitored in real time, allowing you to identify or predict issues. Effective database monitoring also gives you the opportunity to enhance or optimize your database, to augment overall performance.
The aim of database monitoring is to keep your database and associated resources performing at the highest possible level, thereby ensuring your application infrastructure is always available and functional. It lets IT administrators conduct rapid and accurate problem-solving processes, preserving time and valuable resources. The crucial added benefit is the end users get a streamlined, uninterrupted experience, in which issues are resolved quickly and efficiently.
To execute an efficient database monitoring strategy, you should analyze data across a range of categories, with the intention of minimizing or preventing lags or unavailability. It’s worth noting different types of databases will require different data points to be analyzed.
Database monitoring tracks the performance of both hardware and software by taking frequent snapshots of performance indicators. This allows you to identify any changes, identify bottlenecks, and pinpoint the exact moment problems started to occur. With this information in hand, you can then rule out potential causes, so you can get to the real root of the issue.
Key Advantages of Database Monitoring
Successful database monitoring is a fundamental contributor to overall business success. After all, everyone knows a poor end-user experience results in a loss of customers and money. Through the evaluation of user and application activity, monitoring provides you with a complete picture of your database. Implementing a robust database monitoring program can result in crucial advantages for your organization. These include:
- A reduction in the time and resources spent hunting down hidden issues in the database and IT infrastructure
- Improved end-user experiences
- More effective capacity planning
- Ability to troubleshoot performance problems on a proactive basis, before they affect the end user
- Insights into whether and how performance could be improved
- Insights into any security flaws

How to Monitor Database Performance
As I mentioned above, database monitoring is important because it helps administrators identify database issues before they become a problem. To keep your application accessible and functional, you’ll need to understand what goes into the monitoring of database performance—including how monitoring is approached, along with key metrics and best practices.
Common Approaches to Database Monitoring
First, let’s look at the two main approaches to database monitoring: proactive and reactive.
A proactive approach aims to pinpoint issues before they become problems, while a reactive approach aims to mitigate the effects of those problems once they have occurred.
Reactive monitoring might be employed for performance troubleshooting, major incident reporting, or a security breach investigation.
Most people can agree the proactive approach is less risky and results in a better end-user experience. But to be proactive, you have to make sure you’re monitoring the right metrics and alerting the relevant people when something seems amiss or out of the ordinary.
Most Important Database Performance Metrics to Monitor
Here are the key performance metrics you should consider monitoring to help provide insights into the overall health of a database environment:
- Queries: To ensure a high level of overall performance, it’s important to monitor the performance of the queries themselves. Database monitoring should alert you to query issues including inefficient joins between tables, insufficient or overabundant indexes, and overly literal SQL.
- Capacity issues: Database issues can be caused by issues with the hardware, like lagging CPU speed or insufficient CPUs, slow disks, misconfigured disks, full disks, and lack of memory.
- Conflicts among users: When many users are accessing a database, this can cause conflicting activities and queries. For example, the performance of your database could suffer from page/row locking due to slow queries, transactional locks and deadlocks, or batch activities causing resource contention.
- Configuration issues: Disks without proper configuration can cause performance issues. Monitoring will uncover issues like an insufficiently sized buffer cache or a lack of query caching.
Database Monitoring Best Practices
Now that we’ve looked at the most important database performance metrics, I’ve outlined the key best practices to incorporate into your monitoring strategy. These include monitoring availability and consumption of resources, measuring and comparing throughput, monitoring expensive queries, tracking database changes, monitoring logs, and incorporating historical data.
- Track availability and consumption of resources: Monitoring resources entails regularly checking all databases are online. This is the most important—and also the simplest—of the practices, which should be conducted within and outside of normal working hours. When manually monitoring your database, resource monitoring is time-consuming and at risk of being overlooked, making the use of a monitoring tool a must (I will go into the best database monitoring tools later in this guide).
If everything is live, it’s time to check the consumption of resources. By resources, I mean memory, disk, CPU, and network-related components. If you see an indication of high CPU or low disk space, for example, the relevant person in your team should be alerted. Again, a decent monitoring tool should do this for you. - Measure throughput: Measuring and comparing throughput means staying on top of throughput metrics, like the number of connections per second and replication latency. All measurements should inform future measurements, by serving as a comparative baseline. This should make it possible to then quickly identify any deviation or abnormality, and the appropriate measures can be taken to investigate it.
The baseline should be based on multiple readings, taken at different stages in the production, across a period of between two and four weeks. Some tools will allow you to set baseline figures as alert thresholds, so you’re notified if there’s any variation. - Track and analyze expensive queries: Monitoring expensive queries comes into play when everything is online and resources aren’t overworked, but there’s still a database performance issue. This could be because of inefficient query plans, nonexistent indexes, or several other reasons. Troubleshooting for expensive queries means scouting for queries running slowly. This can be done via database logs. Identified slow queries can then be improved.
- Monitor changes to the database: Tracking changes to the database involves identifying any objects added, dropped, or modified, which can sometimes occur if there is a new version of an application. These objects can be the source of query delays, so they should be monitored carefully.
To do this, you can create a throughput baseline as soon as a change has been made, which lets you compare before and after performance. Alternatively, you can monitor changes as they happen via database logs. - Monitor database logs: Database logs are key to proactive monitoring, because they contain critical information. A log can display every query running in a database, and how long each of the queries is taking to complete. By collecting database logs—including system-generated logs, slow query logs, backup logs, and maintenance routine logs, among others—you have access to information unavailable in general performance metrics. For example, the average queries-per-second performance metric doesn’t indicate which specific queries are lagging on a consistent basis.
- Monitor historical data: It’s important to note most problems don’t occur at the same time, so it’s impossible for an administrator to conduct real-time performance monitoring constantly. With this in mind, historical data is an extremely valuable tool.
Manual vs. Automated Database Monitoring
In addition to monitoring the key metrics according to the best practices listed above, most database monitoring programs also offer an alert system, which keeps administrators aware of issues without the need to check in constantly.

List of Best Database Monitoring Software
There are a wide range of tools on the market, both paid and free, designed to undertake proactive monitoring of databases. To help you choose between them, I put together a list of my recommended database monitoring solutions based on key features and weaknesses of each tool.
In an overall comparison, SolarWinds Database Performance Analyzer tops the ranks. It’s an extremely popular tool for network administrators, and it’s easy to see why. The root cause analysis utility gives it a real competitive edge, and the visualization of data is dynamic and highly user-friendly.
SolarWinds DPA is suitable for SQL Server, Oracle, IBM DB2, SAP ASE and many more engines. It takes a unique approach to database performance monitoring, with a focus on response time and multidimensional performance analysis. This approach recognizes the most important performance metric is database response time.
The tool relies on a methodology called Response Time Analysis as a way of tuning and improving SQL query performance. The methodology drives database administrators to deliver results making a difference. One of the major benefits of this approach is it lets IT teams align their aims and efforts with service-level delivery—this means instead of analyzing server health to make forecasts likely to be inaccurate, it measures the time taken to complete specific operations. This time is then broken down into single, measurable steps, so you can pinpoint exactly which of those steps is causing delays in the application.
The Response Time Analysis focus is the feature setting SolarWinds DPA apart for me. Most other database monitoring tools target server health measures and execution ratios, but these don’t reflect the end-user experience, nor do they assist in targeting the origin of the issue. In my view, the idea that the end user’s experience drives database performance monitoring makes a great deal more sense than any other approach.
DPA is designed in an intelligent way, combining Response Time Analysis in a multidimensional root cause analysis which also correlates and considers SQL statements, system health, wait-based analytics, and context. And the results of this process are presented neatly and cleverly. The dashboard doesn’t throw hundreds of gauges and raw metrics your way but provides immediate visibility of database server health in a clean and clear format.
DPA is popular among admins in need of Oracle monitoring tools, because it’s built to let users optimize production databases through agentless architecture. This means you can use it in development, testing, production, virtualized, and in the cloud (Amazon AWS, EC2, RDS, Azure). You can monitor and verify server query status, CPU disk usage, memory usage, and sessions, with the ability to view your server health in the form of graphs to gain a clear overview of any emerging trends.
Lastly, I highly value the fact the included SolarWinds Orion® Platform makes it possible to combine DPA metrics with other useful monitoring tools like SolarWinds Server & Application Monitor (SAM). The Orion Platform is built to provide a centralized dashboard showing database performance metrics from DPA integrated with SAM server health tracking for a more comprehensive view of performance across your infrastructure.
Its user-friendly dashboard, real-time insights, integration capacities, and brilliant Response Time Analysis approach make SolarWinds DPA the obvious choice for best database monitoring tool. A 14-day free trial is available, during which DPA is fully functional.
It’s worth mentioning, a free version of DPA is also available. It shares some features with the paid version, such as offering response time monitoring with SQL query wait types and wait events; provides a unified view of SQL Server, Oracle, DB2, and SAP ASE instances via a single dashboard; and allows for unlimited users, with no agents and no installation on production servers.
However, the free version of SolarWinds DPA cannot serve as a replacement for the paid version. As generous an offering as it is, it doesn’t have key features you would gain access to with the paid DPA. The features available in DPA but not the free tool version include:
- Real-time session monitoring and performance analysis for VMware
- Ability to drill down by program, object, database, plan, and more
- Historical trend dashboard, reporting, charts, and alerting
- Customer and technical support, with expert analysis and maintenance
- Ability to go back in time to trace the root cause of past issues
- Support for RDS, Azure, AWS, and MySQL
- Blocking and locking analysis
SQL Sentry is built to give DBAs deeper visibility across the entire Microsoft data estate. With a quick view of real-time and historical events and performance data, SQL Sentry can show execution plan diagrams, query history, and more, so you can find and fix potentially problematic queries.
The query analysis capabilities in SQL Sentry are designed to go far beyond what you’ll find in SQL Server Management Studio (SSMS), giving you the information you need to quickly resolve problems.
With SQL Sentry, you can:
- Monitor SQL Server running in physical, virtual, and cloud environments
- Set relevant and actionable alerting with the ability to automate responses to specific conditions
- See at-a-glance performance of your environment using an overall health score
You can try SQL Sentry free for 14 days by downloading a free trial.
Paessler PRTG Network Monitor follows closely behind SolarWinds DPA. It offers impressive SQL monitoring functionalities, with the ability to monitor Microsoft SQL, MySQL, Oracle SQL, and PostgreSQL. I like this tool for several reasons, the main one being it serves as a one-stop approach to monitoring. It monitors your entire IT infrastructure, including applications, bandwidth, packets, traffic, cloud services, uptime, ports, IPs, virtual environments, hardware, web services, security, physical environments, disk usage, IoT devices, and—of course—databases. And this list isn’t even exhaustive.
Then there’s the huge scope of technology supported, which includes all versions of SNMP, Flow technologies (NetFlow, sFlow, jFlow), WMI, Ping, SQL, and SSH). Everything else can be integrated with the API.
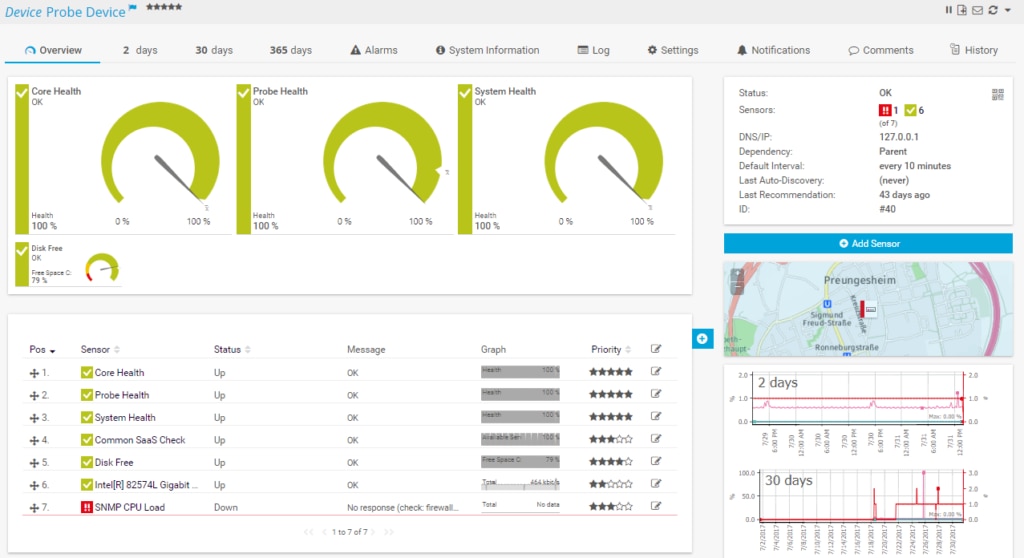
Compatibility-wise, PRTG is obviously impressive, but let’s take a look at some of the actual monitoring features. PRTG is a DB monitor hitting the nail on the head with its dashboard and interface, giving you the option to view your data in a two-day, 30-day, or 365-day format. There are also tabs for general overview, alarms, system information, logs, settings, notifications, comments, and history. The dashboard is tidy, meaning the information is clear and easy to interpret.
I think many people looking for database performance monitoring tools underestimate the difference a clean dashboard can make. Database performance is complicated because so many different factors can impact it, so making sure results and data are clearly presented can save time and hassle. I particularly like PRTG’s simple Core Health, Probe Health, and System Health graphs, which give you instant insights. The dashboards are also fully customizable, so you can decide which metrics you want to prioritize (e.g., query, connection, return times).
The easy setup is another notable advantage of PRTG. The program comes with preconfigured sensors and settings, so you don’t have to configure your own from scratch if you don’t want to. But PRTG also allows you to set up custom sensors and individual SQL queries. This means you can monitor specific data sets—for instance, the speed of your online store. Then there’s the efficient alerts system, sending you an immediate notification if anything is amiss.
An unlimited version of PRTG is available at no cost. However, after 30 days the program reverts to a free version. My only issue with PRTG is with the sensor-based pricing model, depending on the size of your network, you could end up paying for more sensors than you need.
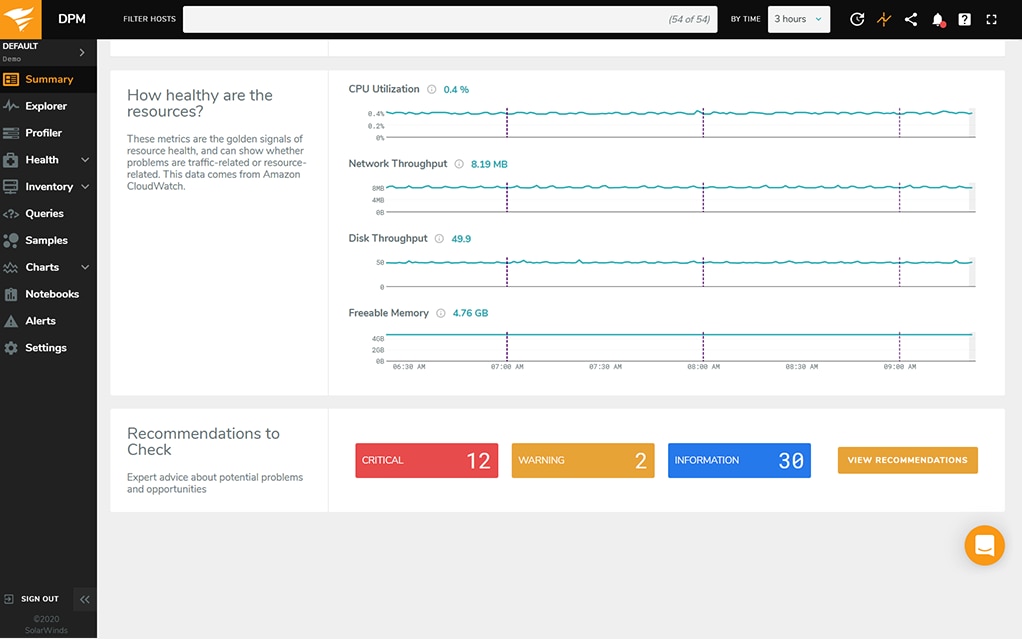
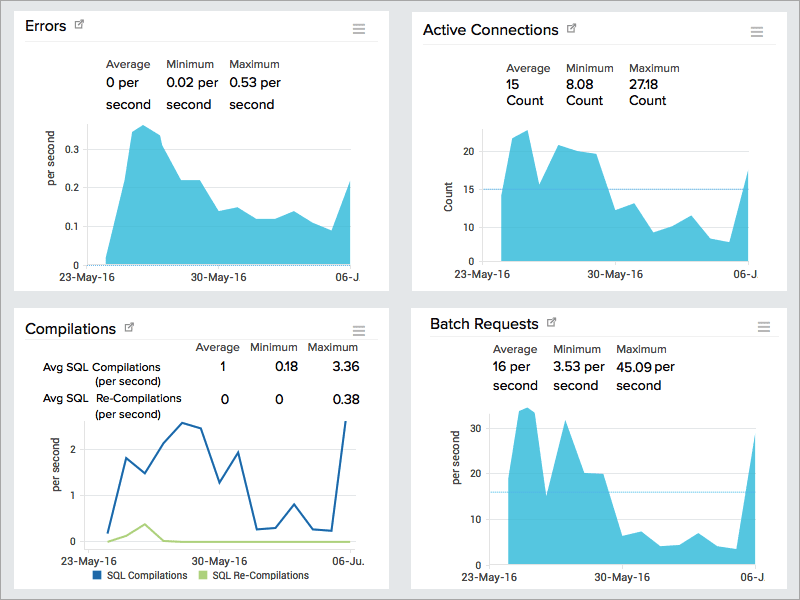
SolarWinds Database Performance Monitor (DPM) is a cloud-based solution and, as such, there’s no buying, maintenance, and provisioning required.
The SaaS monitoring solution can monitor databases locally, in the cloud and hybrid. It focuses on open-source and NoSQL databases, including but not limited to:
DPM features top-notch security capabilities, including GDPR and SOC2 compliance out of the box. It offers 24/7 real-time monitoring to track a wide array of metrics and display the results using a clean, intuitive dashboard. The list of supported metrics includes:
- Deploy frequency
- Availability
- MTTD
- MTTR
- Reduced failed deploys
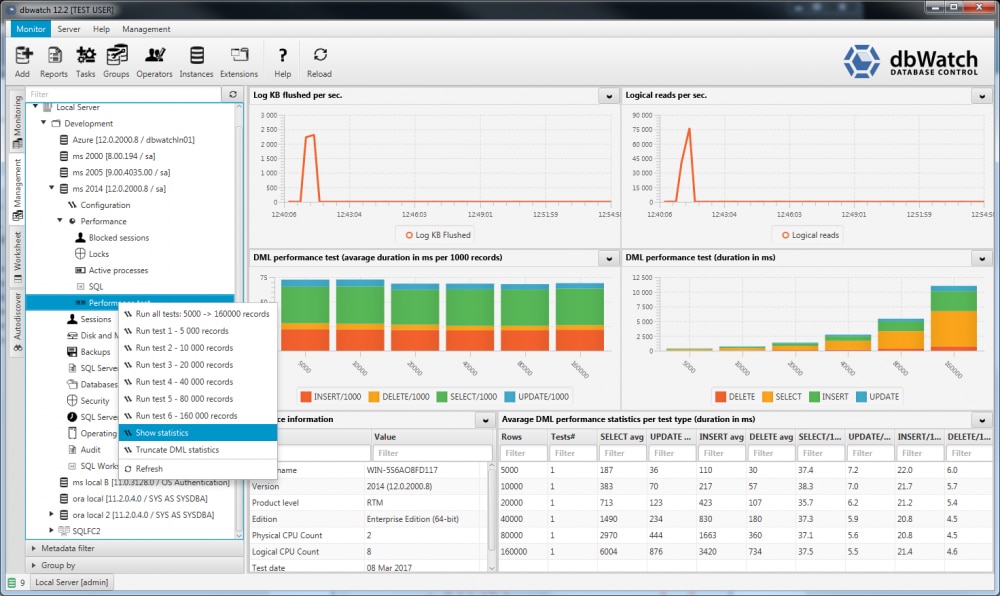
dbWatch is a Microsoft SQL Server, Sybase, Postgres, MariaDB, MySQL, and Oracle database activity monitoring tool. It has full support for AlwaysOn and RAC clustering, with on-premises, hybrid, or cloud Azure SQL support, making it a truly cross-platform program.
dbWatch was developed in response to changes in database monitoring. The developers recognized monitoring every single instance isn’t enough anymore—you must monitor and manage the whole server farm, which is the aim of this tool. With dbWatch, you can monitor all your instances via a unified, global view. This gives you insight into your entire server farm, with the ability to drill down into individual instances to gain greater insight. Instances can be managed directly, which facilitates rapid problem resolution, so you don’t have to switch between consoles.
One thing I like about this tool is its varied reporting utilities. You can choose to report on the health of a single instance, for example, or consolidate reports for the entire data center. Database monitoring is done in real time, and historical data is compiled for the sake of contextual and comparative analysis.
A big advantage of dbWatch is it’s highly scalable. You can go from a handful of instances to thousands, because the architecture allows for maximum performance with minimum network or server impact. The program provides multi-network, multi-site, and cloud support, the latter of which especially makes this tool stand out.
It’s important to note dbWatch isn’t part of a wider infrastructure monitoring program but is entirely specialized. This means it has been designed specifically for database monitoring. The disadvantage is you’ll need to utilize other tools for monitoring your servers and applications.
dbWatch is quick and easy to install, and it supports multiple locations, platforms, and versions in a unified hybrid cloud view. It’s a customizable tool, letting you personalize how you view dashboards, tasks, and reports. It’s licensed on a yearly basis, which includes ongoing support, upgrades, and maintenance. A 30-day free trial is available.
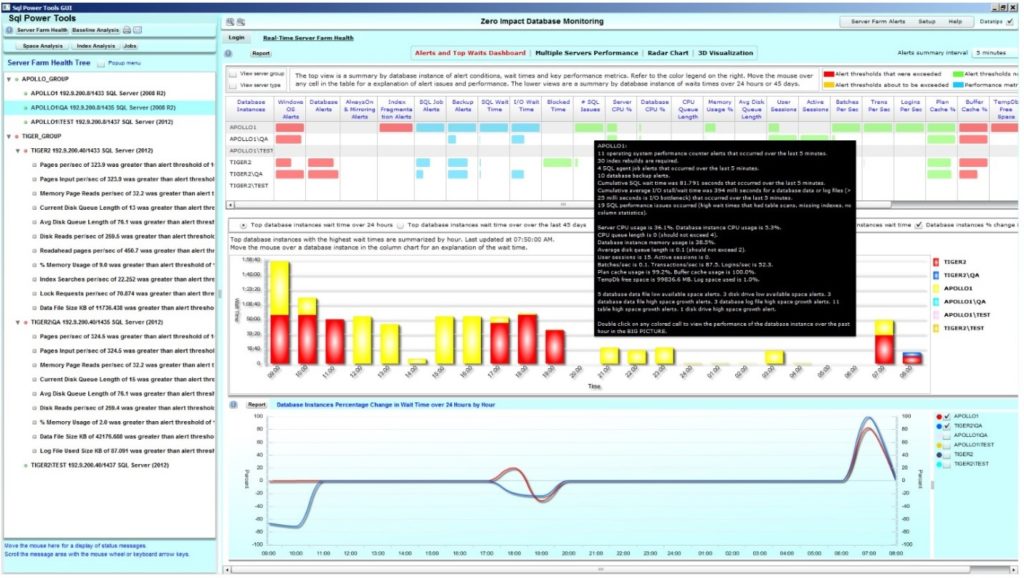
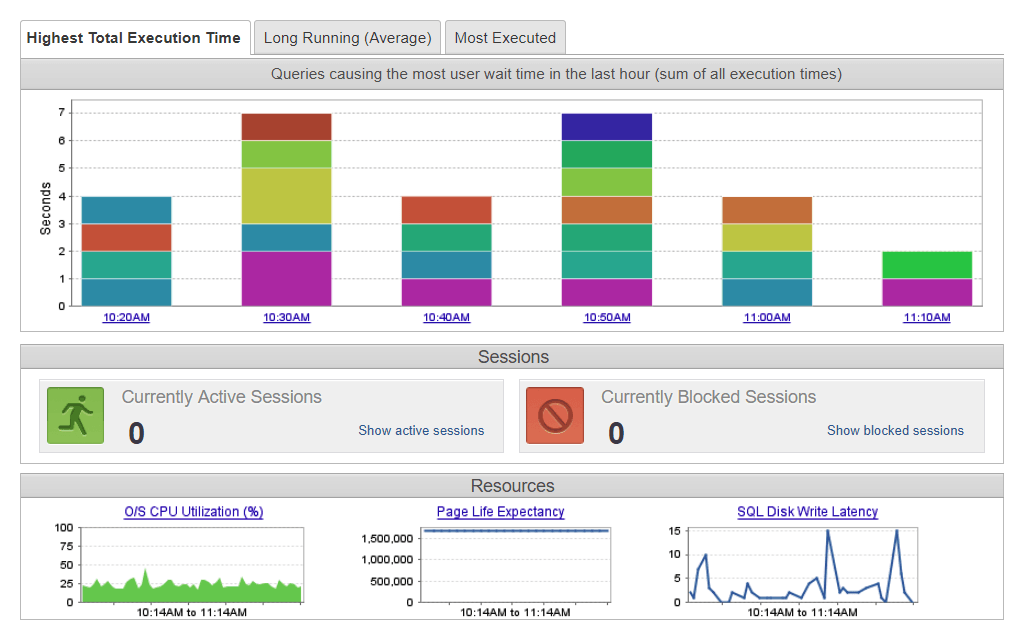
As a SQL monitoring tool, SQL Power Tools is popular in part because it’s highly lightweight. SQL Power Tools sells itself as a zero-impact database monitoring solution, and it boasts several powerful features. These include data logging of destination IP, source IP application, response time, bytes sent, and packets sent. This is a simple tool giving you accurate and consistent visibility of your database’s overall performance.
According to the developer, 95% of issues with database performance are caused by long-running SQL—hence the tool’s focus on capturing any and all SQL activity. It does this with its SQL text and analysis of end-user response time, which allows it to inform you of a long-running SQL within less than a second of its occurrence. This powerful feature is complemented by the program’s capacity to baseline the performance of each distinct SQL statement, with zero impact on the database server.
An agentless monitoring solution, SQL Power Tools lets you drill into SQL wait times, SQL wait conditions, blocking, deadlocks, I/O stall times, disk usage, SQL agent job performance, and index fragmentation. Three-dimensional, dynamic graphs are provided for a range of metrics, including procedure cache, buffer cache, and performance counters, among many others.
The tool doesn’t use intrusive database SQL profilers or traces, has a 1% overhead on database servers being monitored, and uses heat maps to display certain data. These are among my favorite features of SQL Power Tools, along with its top-of-the-market cybersecurity capabilities, which detect and prevent theft from your database by rogue insiders, hackers, third-party cyber risks, SQL injection attacks, DevOps exploits, and phishing email attacks. This is a fast-acting tool working to inform you of a breach before data is compromised.
Although it has robust capabilities, SQL Power Tools doesn’t offer the same user-friendliness as the higher-ranking products on this list. The pricing is also less transparent; you‘ll need to speak with a sales representative to get a quote. You can, however, access a free trial by making a product evaluation request.
Site24x7 offers out-of-the-box database monitoring designed to certify the highest possible SQL server availability and to mitigate server sprawl. The tool aims to provide users with optimal performance on a 24/7 basis. There are plenty of things to like about Site24x7. I particularly appreciate how well it delivers capacity planning, by giving you greater insight into buffer and memory manager details.
Site24x7 combines network, applications, and server monitoring to give you a full view of all your operations and processes, which contributes to the maintenance of your database performance. The service is cloud-based, so you don’t need to install any software. As such, it is a good fit for MSPs and remote-site monitoring. However, some administrators prefer their systems not be cloud-based, due to a perceived increase in risk to security.
The Site24x7 server monitoring package includes an optimizer for database performance, which has an auto-discovery feature. This feature discovers all your databases automatically, without manual intervention, and manages the installation of agents so they can be monitored. It’s these agents reporting to the Site24x7 console. Results can then be viewed in your browser. I valued how easy this was but wasn’t keen on my dependence on internet access to view my results.
For me, the customizable alert parameters, live performance metrics, and ability to monitor an unlimited number of instances make Site24x7 stand out as a tool worth inclusion in this list. The pricing model is also an attractive element of the package, which is subscription-based, with optional add-ons making it possible to customize it to suit your requirements. A free version, which limits you to monitoring five servers, is available. There is also a free trial, which reverts to the free version at the end of the 30 days.
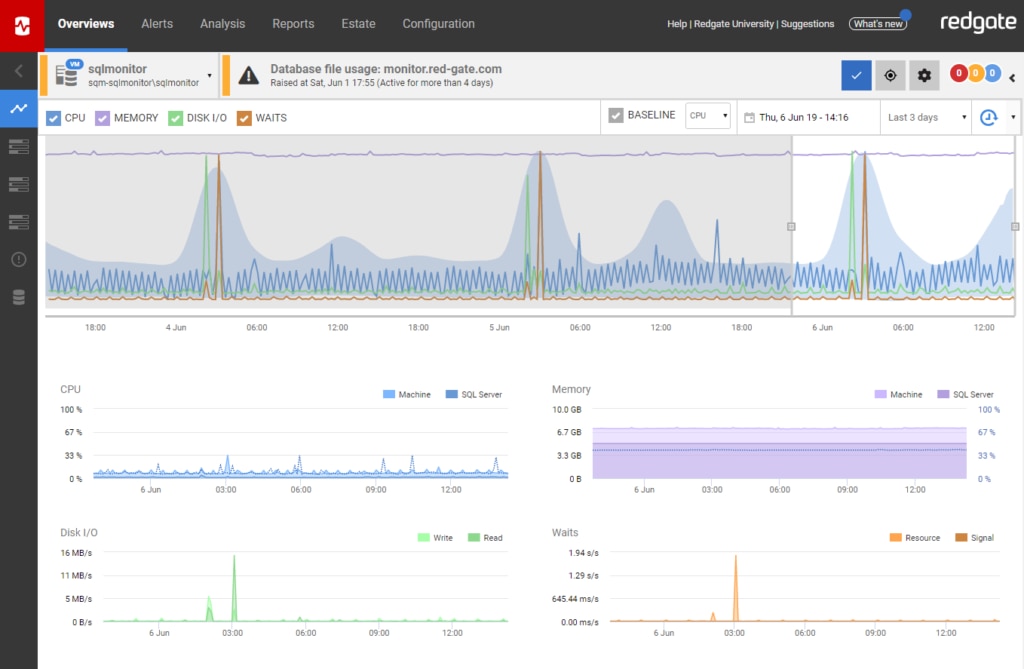
Next on my list is Redgate SQL Monitor, which features largely because of its dynamic and highly visual design. A web-based GUI presents all your key metrics in a single, unified dashboard, and all your servers are color-coded—a user-friendly approach giving you insight into overall server health at a glance.
This tool also employs a traffic light system, which shows as green for healthy, amber for warning, and red for critical. The GUI updates every 15 seconds, so you have access to live coverage of any activity. These design features simplify the monitoring experience, cutting out the clutter and making it easy to obtain an understanding of your database.
Another thing I like about Redgate is the alerts system, which can be used to keep you notified of any of the following: memory, high CPU, low disk space, performance issues, and SQL errors. There are 40 alerts available, ready to use out of the box. These can also be customized by the user, giving you the opportunity to redefine parameters and thresholds to suit your needs.
Redgate SQL Monitor offers monitoring features covering the management of your entire SQL Server estate. And impressively, whether your servers are hosted locally, on Microsoft Azure or Amazon EC2, or on virtual machines, you can view them all in one place. This is a great feature, allowing you to add servers in bulk or auto-discover them through the tool’s API if your estate grows. The package comes with estate-wide management tools, like disk usage stats, backups, and SQL agent job status.
Unfortunately, there’s a lack of price transparency; while Redgate is clear on the price for up to nine servers, you’ll need to contact the company for a quote if you have more than ten. A 14-day free trial is available.
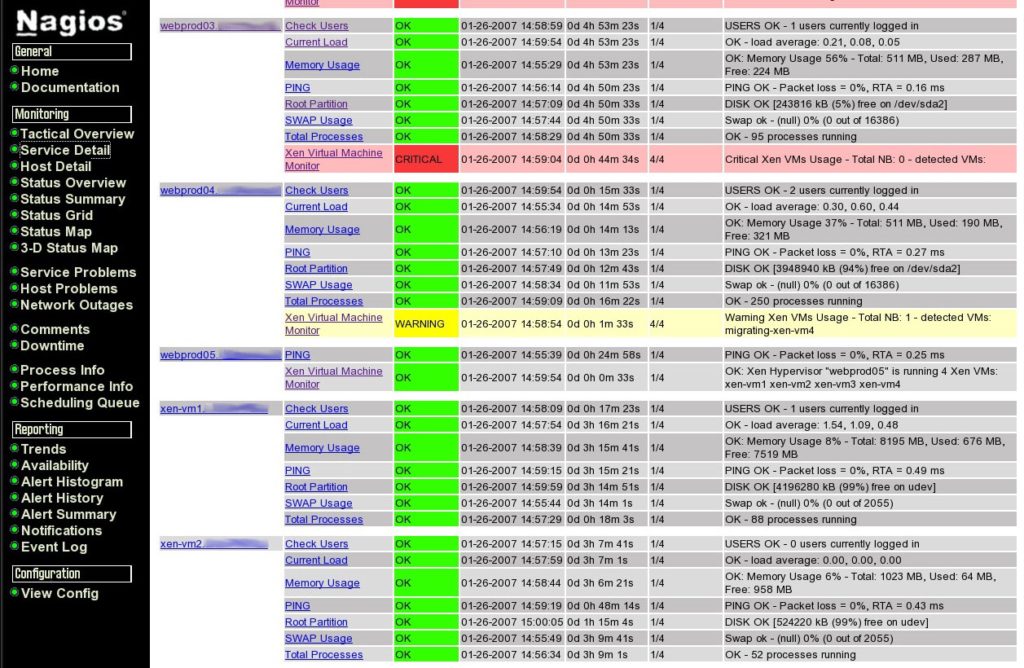
Nagios is a database monitoring tool also offering MySQL monitoring, Postgres monitoring, Oracle monitoring, DB2 monitoring, and Microsoft SQL Server monitoring. It comes in two versions: Nagios Core is open source, popular, and is driven by a large community of support, while Nagios XI is the paid version. Database monitoring with Nagios covers everything from database and table sizes to availability and cache ratios. It’s great for rapid detection of database failures, outages, and table corruption.
As an open source tool, Nagios Core isn’t as user-friendly as many paid solutions. And both versions rely heavily on add-ons and plugins for a full range of features. The advantage to this is you can choose your own add-ons and plugins, essentially building your own tool and making it work on your terms. The key disadvantage is maintaining the system becomes trickier when there are lots of add-ons and plugins involved. Keeping it up to date gets cumbersome and the system itself can become less streamlined.
I like Nagios because it’s what you make of it, and its flexibility is one of the reasons it has made this list. But overall, I prefer an all-in-one, more user-friendly solution.
You can download Nagios Core for free here. Nagios XI is downloadable here and offers a free trial.
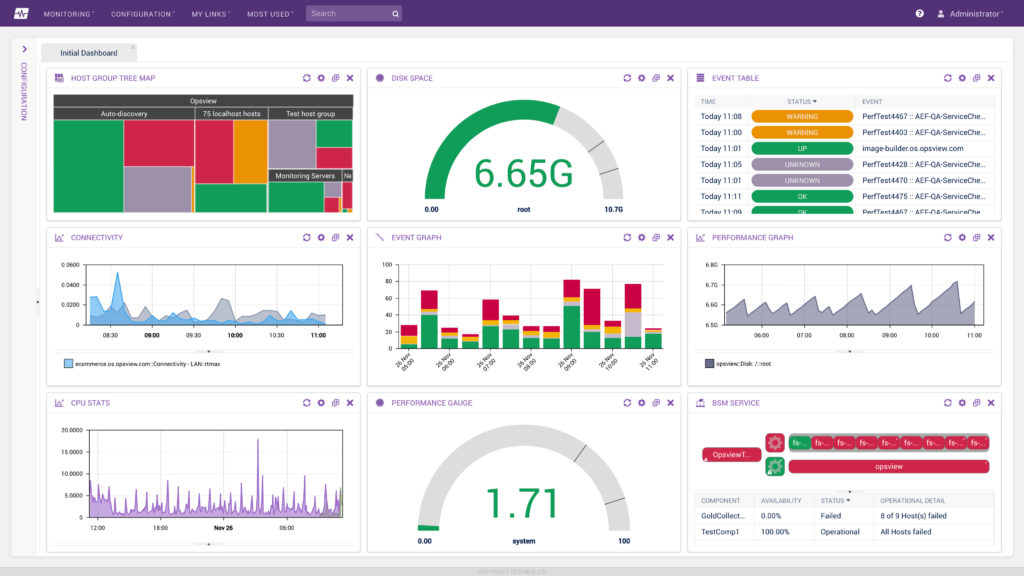
Opsview specializes in cloud monitoring tools and offers a range of database monitoring solutions both powerful and insightful. Although Opsview is a provider focusing on cloud solutions, its database monitoring tools can be used both on-premises and in the cloud. The tools are suitable for Oracle, MySQL, InfluxDB, SQL Server, and PostgreSQL monitoring.
Opsview features configuration bundles called Opspacks. The Opspacks for database monitoring include monitoring for AWS DynamoDB, DB2, Exchange, MariaDB, LDAP, and many others. These Opspacks are distinct, each with its own related service checks and approach to monitoring.
I like the Opsview approach to monitoring, which is fairly unique, and its scope of coverage with its Opspacks is impressive. It also offers monitoring capabilities for applications, cloud-based services, networks, servers, and Windows. In my view, however, a one-stop shop which doesn’t require you to install individual Opspacks is preferable. There are “install notes” for each of the Opspacks, which instruct you on how to add it to your Opsview Monitor server. While the flexibility is attractive, it means setup is more cumbersome than it is with some of the higher-ranking database performance monitoring tools.
You can schedule a demo of Opsview here.
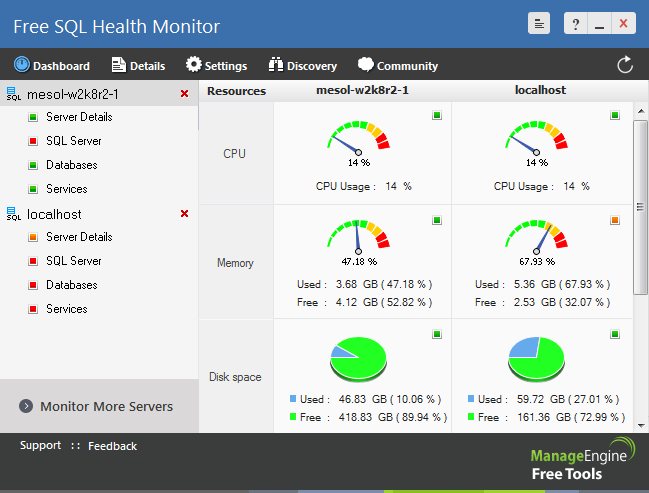
ManageEngine, a highly popular software developer, offers a free SQL health monitoring tool boasting some surprisingly premium and generous features. One of the great things about this tool is its user interface, which is colorful, uncluttered, and easy to interpret. Data is presented in the form of graphs, dials, and charts, with the option of drilling deeper into metrics to gain greater insight into database performance. The dashboard serves as a centralized location for all your data and its design is intuitive, making for a good user experience.
I also appreciate the auto-discovery feature, which automatically identifies all the SQL servers in your network. This contributes massively to the easy setup of the program, because you don’t have to add servers manually.
With this program, you can monitor memory, CPU, and disk space utilization, and you have access to extensive details regarding SQL server sessions, locks and latches, memory, and buffer. Another benefit is the color-coded alerts feature, which lets you view general server performance and details of utilization in a clear and simple format.
ManageEngine Free SQL Health Monitor lets you monitor all Microsoft SQL versions. Overall, though, it doesn’t offer the same range of functionality as the paid products on this list and isn’t suitable for business purposes.
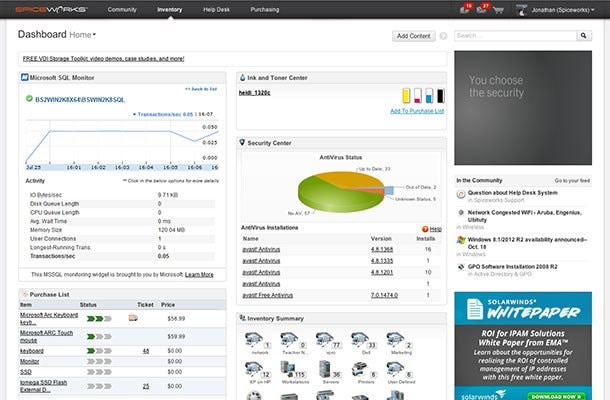
SpiceWorks is another free tool, included in this list because it covers all the basics of database performance monitoring in a fairly comprehensive way. If your organizational needs are minimal and you don’t need a premium tool designed for business use, then SpiceWorks SQL Server Monitor is worth considering. It automatically collects server data and gives you instant access to relevant health information. The program also lets you monitor SQL server size, speed, connection, and much more.
Free tools tend to be less dynamic than paid solutions, and their designs are often flawed. SpiceWorks, on the contrary, offers customizable charts and graphs you might expect from a paid program. Visualization of data is attractive and simple, making interpretation easy.
The chart personalization utilities are also noteworthy, allowing you to alter the perspective of your view of servers. You can, for example, select or deselect metrics like disk queue length, processes blocked, and I/O bytes/second. The dashboard itself is also customizable, letting you create your own widgets and organize them according to your tastes.
With Spiceworks SQL Server Monitoring, you can stay on top of your servers’ health on a constant basis. The tool is compatible with SQL Server databases from 2005 upward.
How to Choose the Best Database Monitoring Tool
We all know databases are crucial for virtually every technological enterprise. Poor database performance will certainly reflect on your whole application infrastructure. Your developers might write pristine code. The designers and UX professionals might create interfaces that are intuitive, functional, and a pleasure to look at. But the database is the foundation of this structure. If it doesn’t perform, your entire application will underperform, and your customers will pay the ultimate price in the form of a terrible user experience. And as I like to say, it doesn’t take too long for unhappy customers to become former customers.
That’s why database monitoring is so important.
In this guide, I’ve included both free and paid options to suit a range of budgets. All these tools have their merits, whether as standalone monitoring solutions or as components of a larger system. But of all the database performance monitoring tools on the market, SolarWinds Database Performance Analyzer stands out for its features and usability.
SolarWinds has a reputation for developing top-of-the-range products, and DPA is no exception. Its unique approach to database monitoring, which focuses on Response Time Analysis, sets it apart from competitors. The ability of DPA to integrate its performance metrics with SolarWinds Server & Application Monitor to provide an intelligent dashboard of actionable insights and multidimensional approach to root cause analysis gives it a real edge in the marketplace.