
Large companies are increasingly shifting toward the use of cloud computing, which means services like Microsoft Azure are becoming more popular. This shift is still in its early stages, with many enterprises currently in the process of shifting their workloads to public cloud vendors.
Azure services are extensive and can provide a wide range of uses for a company setting, but each one of these services requires monitoring and management to get the most out of the process. In this post, I’ll review what Azure is and how it works, and then look at the best tools for monitoring different parts of the Azure environment.
Table of Contents:

What Is Azure?
Microsoft Azure is a cloud service for managing applications and services through Microsoft data centers. It can also be used to build, test, and deploy these applications and services.
Azure functions as software as a service (SaaS), infrastructure as a service (IaaS), and platform as a service (PaaS). Overall, it’s similar to Amazon Web Services or Google Cloud Platform. Essentially, users can pay for access to a large pool of resources split between customers according to their needs. Instead of having their own infrastructure for each business, they access it through Azure’s cloud computing services.
Azure provides a large directory of services, including application services, storage services, and data management. It can also create virtual machines. There are several tools on the market designed to monitor these various Azure services, virtual machines, and databases.
Best Azure Tools for Overall Hybrid Management
With the variety of services offered through Azure, you may want a tool to provide hybrid management and monitoring. In this section, I’ll review the top tools and platforms available. I will look at the relevant features of each solution, and how it can monitor your Azure services to ensure everything is performing optimally.
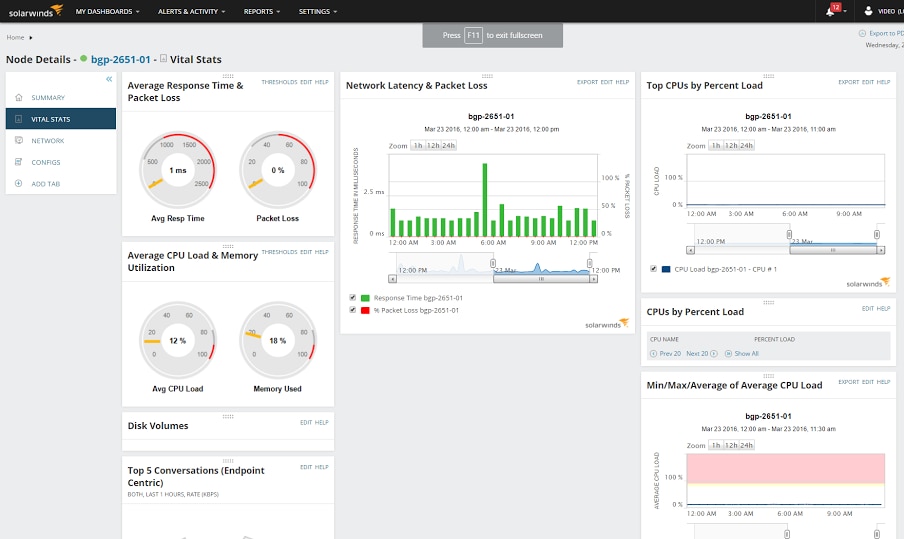
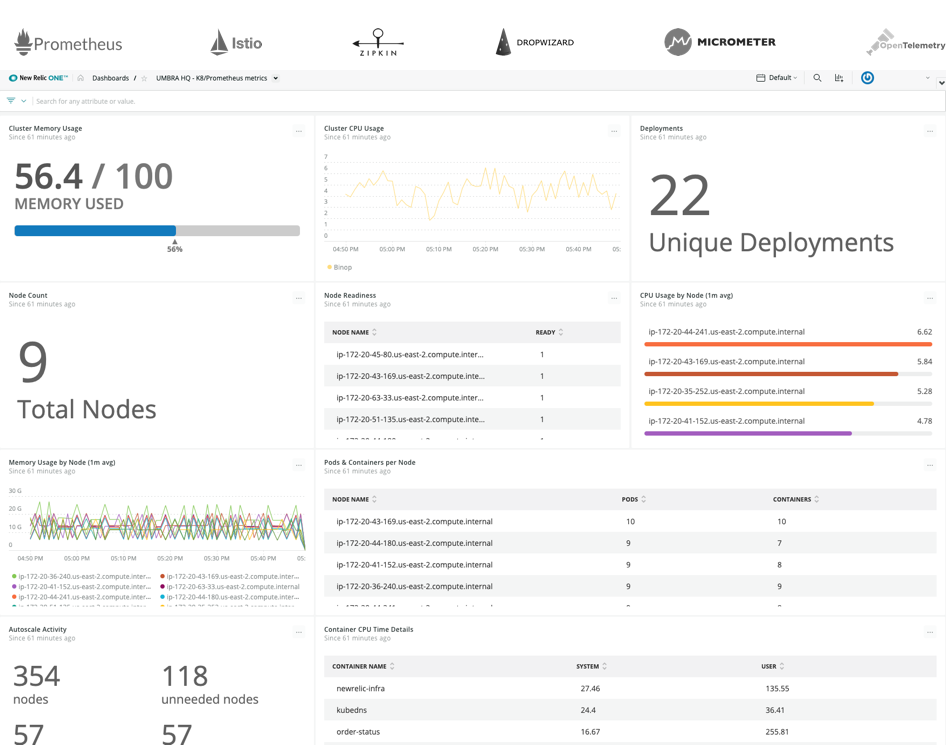
SolarWinds® Orion® Platform is a centralized IT operations management platform made to scale as your organization grows, with several Azure cloud solutions to link in and operate alongside. Many SolarWinds products are built on the Orion Platform, which means they can be used either individually or as part of the platform. This allows your entire infrastructure and applications, including virtual and cloud IT environments, to be monitored at the same time. You can deploy the Orion Platform on-premises, in a virtual environment, or in Microsoft Azure to manage Azure services.
The Orion Platform allows you to monitor, integrate, and analyze data across the entire stack, which helps you to provide high levels of service and keep your end users happy. It can scale up to 400,000 elements, giving large enterprises the scope to implement complete and comprehensive monitoring. One of the Orion Platform’s notable features is the PerfStack™ dashboard. Enabled in several of the platform’s integrated tools, PerfStack allows you to compare and contrast monitoring metrics, leading to faster troubleshooting.
SolarWinds tools capable of integrating with the Orion Platform include:
- SolarWinds Server & Application Monitor
- SolarWinds Database Performance Analyzer
- SolarWinds Virtualization Manager
- SolarWinds Network Performance Monitor
- SolarWinds AppOptics™
- SolarWinds NetFlow Traffic Analyzer (NTA)
- SolarWinds Network Configuration Manager (NCM)
These SolarWinds products have capabilities included in the Orion Platform and can also be used individually for more fine-grained or specific monitoring tasks. The main benefit of the Orion Platform is its ability to centralize and combine these tools, providing a consolidated view of your entire system.
Most of these SolarWinds tools are discussed in detail later in this guide regarding their specific monitoring capabilities. Here, I’ll lay out the basic functionalities of NTA and NCM, and how they can provide insights into your Azure monitoring:
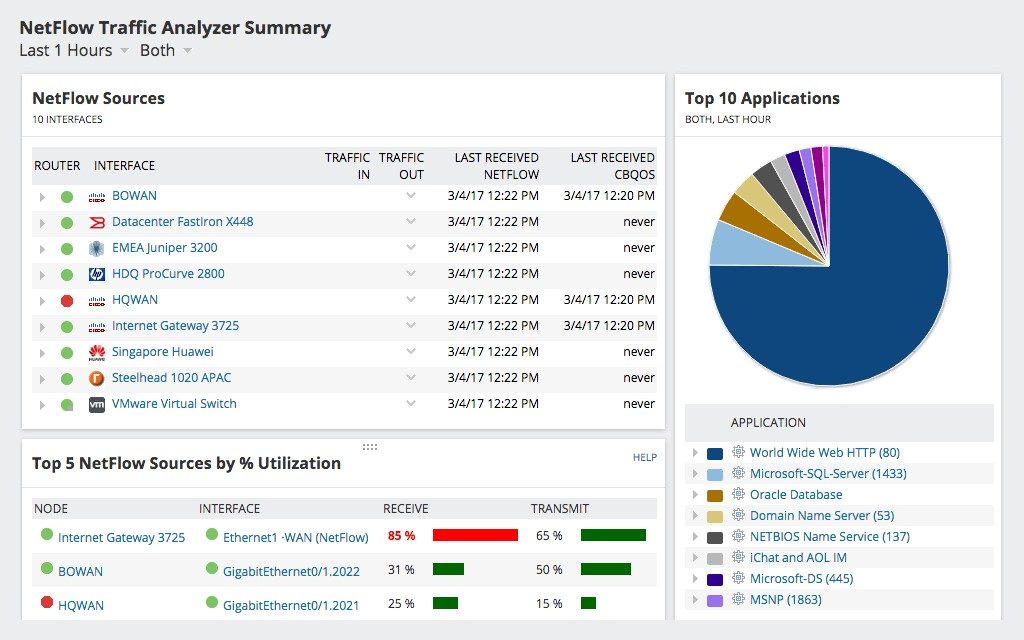
NTA is a tool that can be used alone to examine network traffic and bandwidth flows. It allows you to monitor traffic patterns to avoid bandwidth hogs and configure networks for optimal performance. This means you can keep tabs on your Azure VM network connections and performance, for faster troubleshooting. NTA can also track your application traffic flows, to ensure no unusual spikes or changes indicating problems or malicious intrusion have occurred.
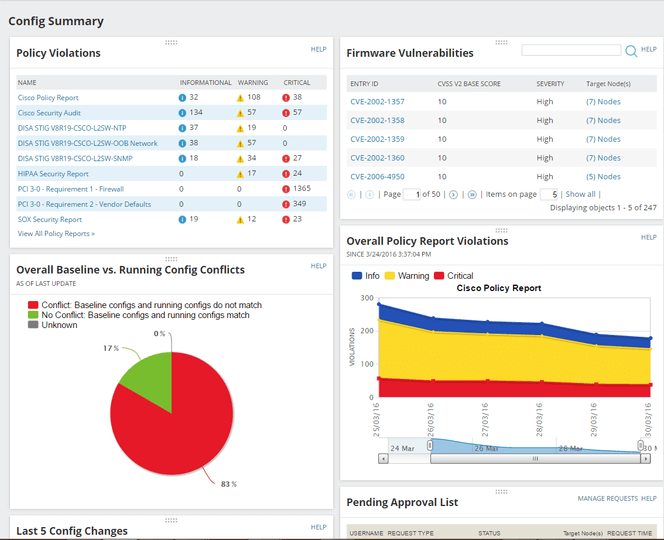
Another useful tool is NCM, which you can deploy easily as part of the Orion Platform or alone. When you have complex, multi-vendor networks, it can be tricky to deploy consistent configurations or changes across the entire network at once. NCM automates this process so you can reduce the time spent managing critical changes and repetitive tasks, freeing you up to focus on other issues. It also integrates with SolarWinds Network Performance Monitor, which I’ll discuss in a later section.
With hybrid management of Azure, you need a tool capable of examining each part of your environment, regardless of whether it’s on-premises, in the cloud, or virtual. The Orion Platform provides this with simple deployment for the above tools in one platform available through the Azure Marketplace. The typical deployment time for the Orion Platform through the Azure Marketplace is around half an hour.
You can request a demo of the Orion Platform through the SolarWinds website.
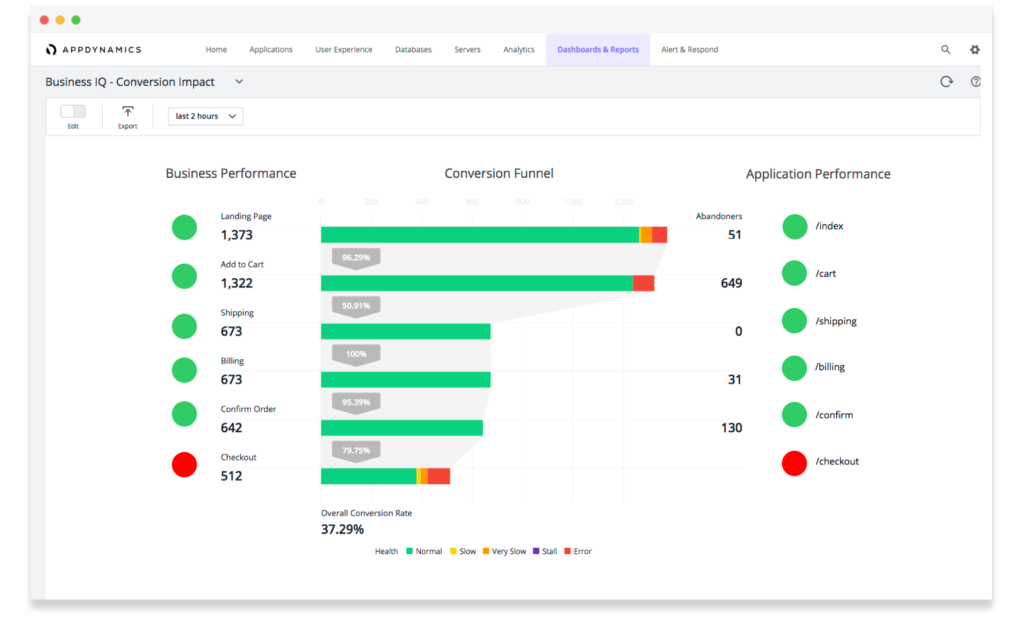
Business iQ is a tool developed by AppDynamics, which is owned by Cisco. It can monitor application performance, user experience, infrastructure performance, and business performance. It uses a machine learning process called Cognition Engine which automates large parts of anomaly detection and reduces mean time to resolution (MTTR) with fast diagnostic processes.
You can deploy AppDynamics Business iQ either on-premises or as a SaaS solution; it also supports public or private cloud infrastructures and multi-cloud applications. With its application management tool, it can automatically detect and map your entire application environment, as well as the journey taken by each end user through the pathways. This means monitoring teams have more of a focus on end-to-end performance in relation to customer experience, rather than simply monitoring individual services.
Business iQ allows you to check on performance metrics for critical business drivers and processes, such as health baselines, anomalies, and alerts, in addition to monitoring the health of all business transactions. It automatically captures errors, crashes, and alerts your users experience, so you can quickly identify front-end issues with third-party services and narrow in on code-level information about the error.
For the purposes of Azure monitoring, the most useful component of this tool is the server and infrastructure monitoring component, which monitors your entire infrastructure, including hybrid environments such as Azure, in one centralized location. This gives you visibility into functionality and performance across applications, servers, virtual machines or networks, storage, and operating systems.
You can sign up for a 15-day free trial of Business iQ through the AppDynamics website.
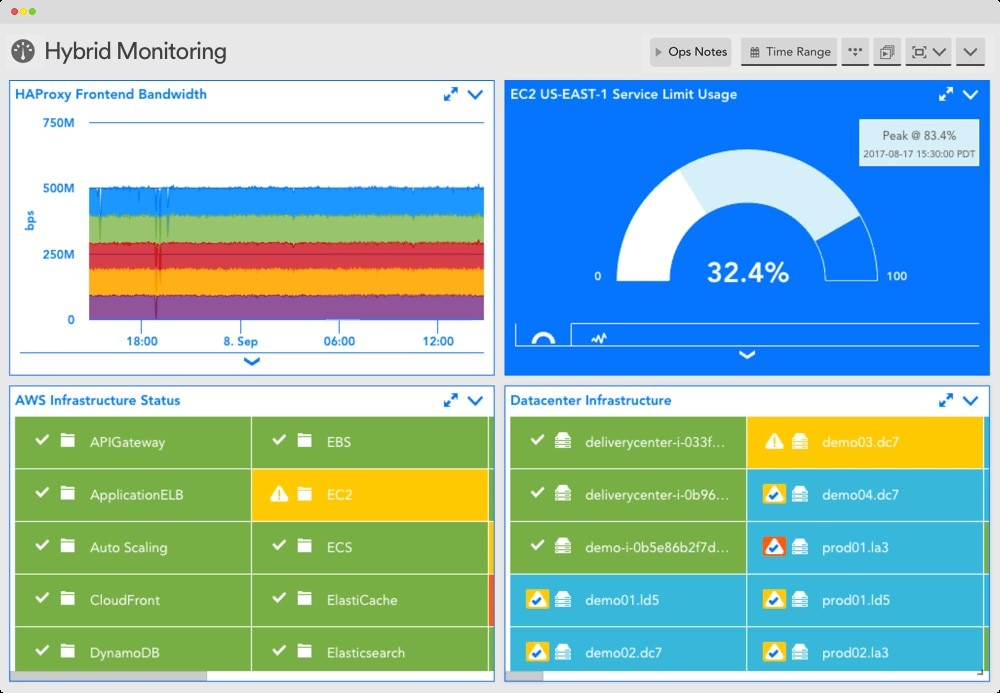
This is another hybrid monitoring tool integrating with Azure and allowing you to manage and diagnose all of your applications in one location. It provides several open APIs enabling you to visualize and display data in an effective and more personalized way. Among its useful features, it can automatically highlight the relationship between different entities in your infrastructure, and then provide performance information on the relationship and its components.
New Relic is unique in its high level of customizability. It gives you the ability to create your own apps, dashboards, and custom user interfaces, so you can change the software to look how you want, display the information you find most useful, and work with an interface tailored to you.
This is a pure SaaS offering, which allows fast deployment with automatic software updates and dynamic scaling systems. It also integrates with mobile apps allowing you to see your New Relic data when you’re out of the office. The mobile apps can display real-time and historical app performance, as well as app errors and alerts.
You can request a demo or a free trial of New Relic online.
 LogicMonitor LM Cloud is a cloud monitoring tool for integration with Azure services. It provides information and metrics about Azure health and performance. When it comes to cloud infrastructure health, LM Cloud monitors three critical components: resource performance, Azure availability, and ROI. Using these metrics, the tool gives you insight into more than just resource performance and availability, providing you with information about all Azure-backed infrastructure and services potentially impacting performance.
Migrations to the cloud can be made more predictable with LM Cloud, as it also provides cloud monitoring and tools allowing you to determine cost estimates and potential management issues prior to migration. Once you have deployed to the cloud, you can view information on resources and their availability, as LM Cloud automatically discovers and monitors them.
With regard to resource performance monitoring, you can deploy the LogicMonitor Collector within Azure. This allows you to use the pre-established LogicMonitor modules, providing you with additional performance metrics. Another great feature of LM Cloud is it links in with Azure Monitor to provide you with updates or alerts on Azure availability issues from the Microsoft side. Alerts are triggered if an issue arises, so you can pinpoint whether it originated within your applications or environment or with Azure itself.
In addition, LM Cloud provides information on Azure service limit utilization, so you know when you’re close to your limits for storage, virtual machines, or network bandwidth. And it undertakes monitoring for Azure spend, helping you to pinpoint opportunities to reduce costs.
LM Cloud is available as a 14-day free trial.
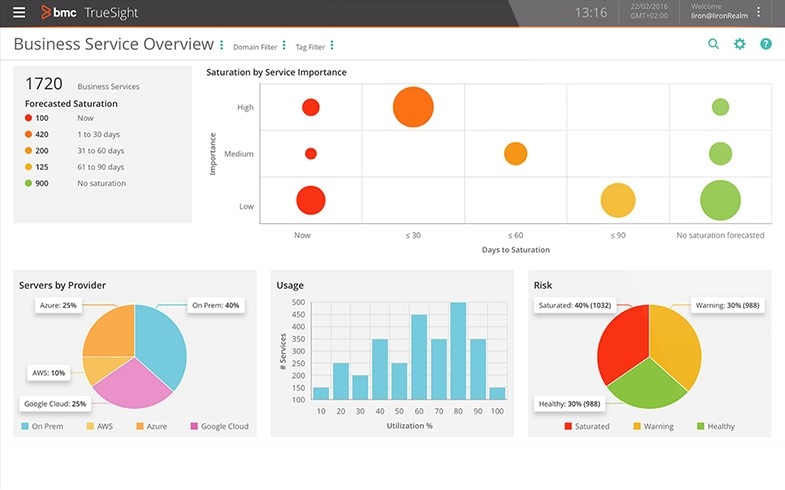
TrueSight by BMC is a full suite of monitoring and management solutions used for hybrid management of Azure services. High-quality analytics continuously record and determine patterns, to figure out baseline and abnormal behavior. This allows you to reduce MTTR and keep tabs on your systems from a security perspective.
All log, monitoring, and management data is integrated in TrueSight, to provide simplified operations and simpler oversight of your environment. So, instead of checking multiple tabs and tools, you gain an integrated and comprehensive view of how everything is functioning. You can also get a picture of performance across hybrid environments, whether your setup is on-premises, virtual, or in the cloud. TrueSight monitors the performance of your web, mobile, and on-premises applications to ensure your end users are getting the best-quality service you can provide.
TrueSight includes several security management tools, such as automated threat vulnerability scanning and patch downloads. In addition, BMC offers a range of tools and software to monitor infrastructure, operations, services, and applications, which can be combined to suit your monitoring needs.
BMC offers free trials of several modules within the TrueSight suite: TrueSight AppVisibility for monitoring and managing application performance; TrueSight Capacity Optimization; and TrueSight Operations Management.
Best Azure Tools for Managing Costs
In addition to tools for hybrid management, experience and performance monitoring, and migrating to Azure, you’ll benefit from a tool capable of helping you predict, plan, measure, and/or manage the costs of your Azure service. Azure provides numerous services and modules to scale alongside your business but keeping tabs on costs is important to make sure project teams and total expenses don’t go way over budget.
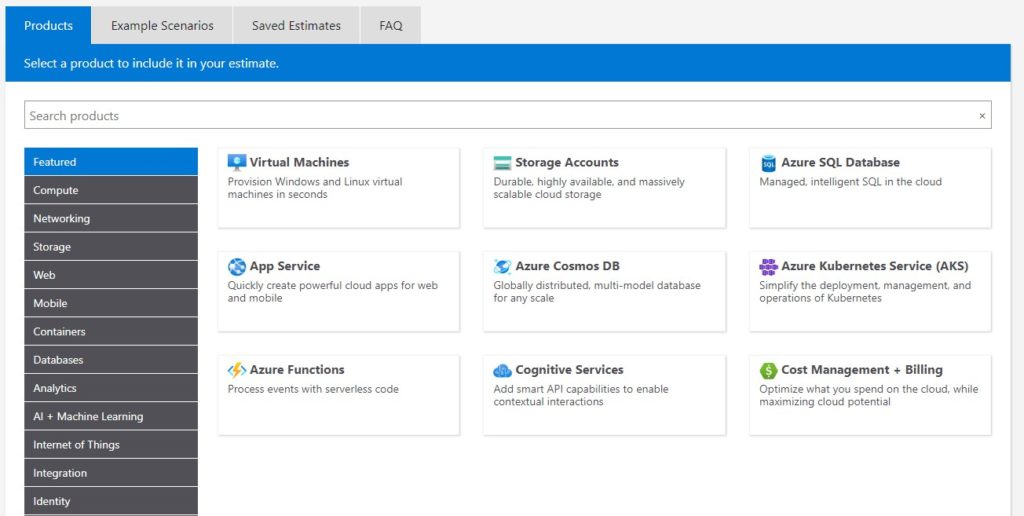
Microsoft provides its own cost calculator for determining what your Azure costs will likely be. You can select the Azure products you expect to use, including virtual machines, storage accounts, databases, cognitive management, and so on. You can then specify the finer details and quantity of the above, and the tool will provide a cost estimate for you. The Azure Pricing Calculator is available free of charge and includes pre-built scenarios you can choose to add to your estimate.
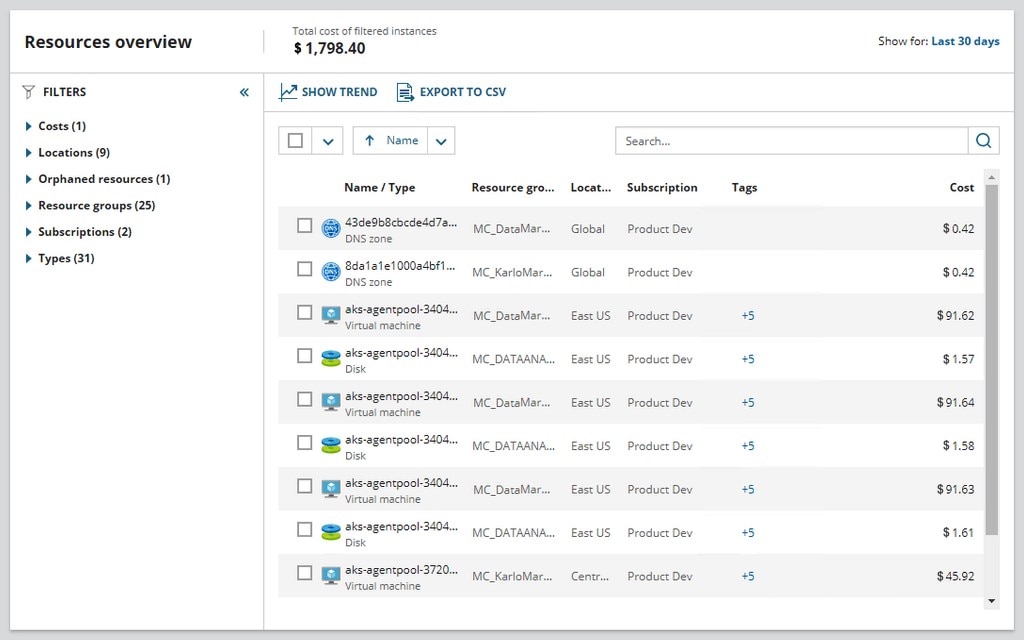
However, I prefer using SolarWinds Cost Calculator for Azure to calculate the cost of Azure plans and accounts. Why? One of the most useful features of this free tool is it can look at orphaned objects you’re paying for but not using, so you can optimize your Azure service and reduce costs by cutting unnecessary objects. In addition, you can consolidate cost data to see which resources are deployed and what they’re costing you.
Cost Calculator for Azure shows you spending information by month, year, or quarter; it can also consolidate the pricing of all Azure services and display the total in one currency. It’s specifically designed for Microsoft Windows and Mac OS X.
This is a completely free tool, so you can use it in conjunction with other pricing tools to get a broad idea of your Azure pricing range. You can download the tool for free here.
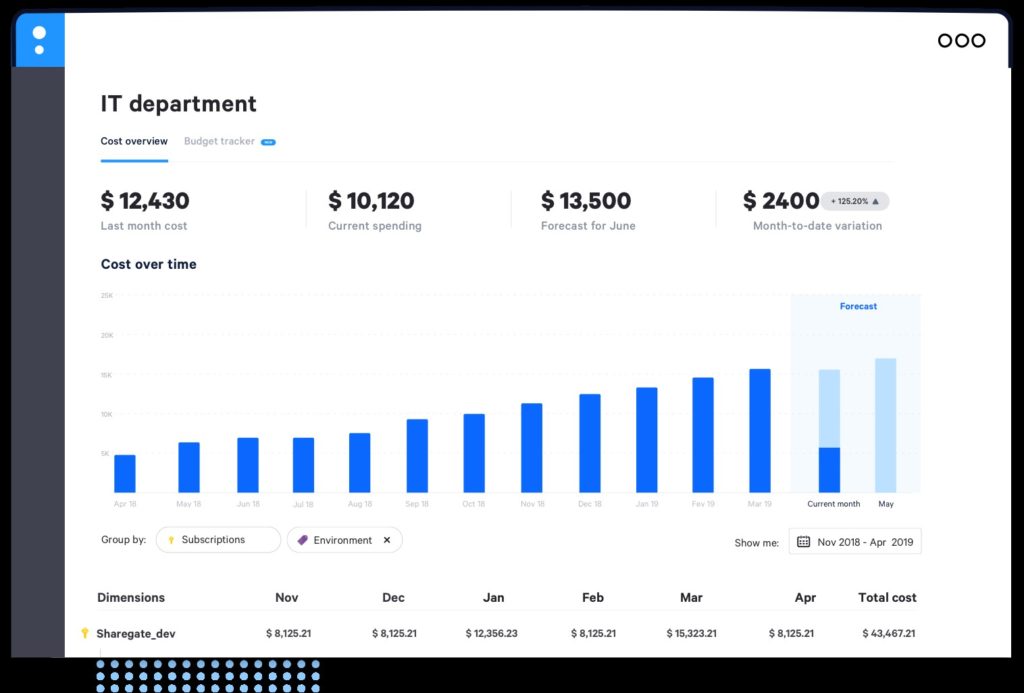
Another tool for Azure cost management and optimization is ShareGate Overcast. It provides information on your billing data, so you can track any changes in price, as well as rightsizing recommendations to keep your costs in line with your business needs. By looking at teams one by one, you can pinpoint outsized costs and collaborate with those teams to keep spending in check. And with the tracking feature, you can predict future Azure costs for easier budgeting and planning.
ShareGate Overcast offers a free trial for businesses with less than $50,000 in annual Azure costs.
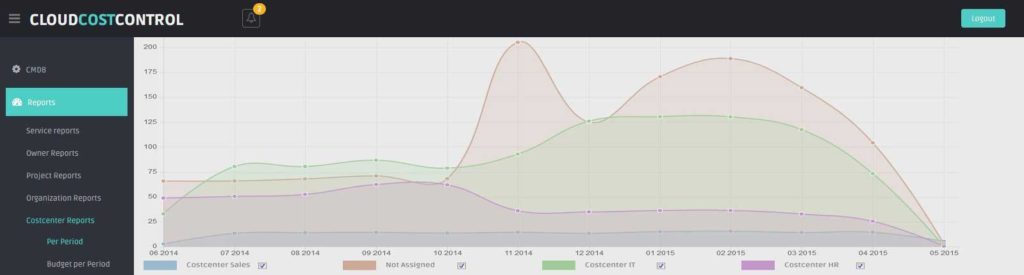
Also consider ProXcio for pricing your Azure subscriptions. It has several useful features for mapping Azure usage, as well as billing utilities and the ability to segment your subscription data.
You can explore all monitored data in the tool’s easy-to-use dashboard, which includes filters for viewing specific billing data or particular types of usage. This allows you to look at spending patterns and trends, and cases in which your business has made an exceptionally large spend or has gone over budget.
You can view billing info by category, including user, group, project, cost center, or organization, to pinpoint where excessive usage or costs are coming from. You can also share this data—for example, to provide financial insights to stakeholders in charge of business or budgeting strategy.
ProXcio offers a free version, but for enterprise use it charges on a monthly basis.
Best Azure Tools for Monitoring Experience
If you want to narrow down your monitoring process, you can look into specific tools for monitoring user experience with Azure. These tools look at the performance of your websites and web-based applications hosted with Azure, with a view to how they’re experienced by your end users.
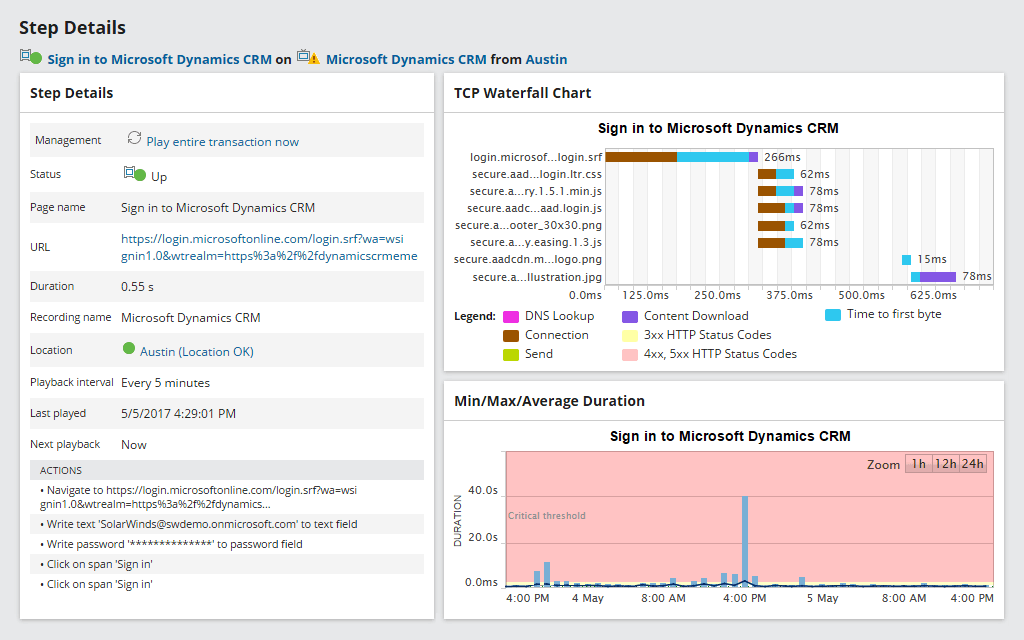
SolarWinds Web Performance Monitor (WPM) monitors commercial and custom apps deployed to Azure to validate the end-user experience. In addition, it can monitor website and web-based applications, enabling you to pinpoint and troubleshoot issues with performance before they affect the experience of your end users.
You can use WPM to try out your app as if you were a user, to gain firsthand experience of how things are performing. The tool gives you the ability to run critical transactions as frequently as every five minutes. It also includes transaction recording abilities without scripting, so you can see how a user is interacting with your website or application.
With WPM you can identify specific web page elements performing slowly, so you can more easily pinpoint issues and resolve them. You can also test out web applications or websites across browsers or screen resolutions, to ensure responsive design elements are working correctly and have flowed through appropriately to the end-user experience.
WPM can monitor user experience on-premises or in the cloud, and you can deploy transaction players where your users are, to get an accurate picture of what their experience looks like. When problems arise, you can easily troubleshoot down to the supporting infrastructure, whether the issue is with storage hardware, the web server, or your database. Alerts can be set up to ensure when a website slowdown or application problem arises, you’ll find out about it as quickly as possible.
Finally, WPM provides comprehensive performance reporting tools, with the capacity to generate reports on metrics including web page loading speeds, website uptime, and transaction speeds.
You can access a 30-day free trial of WPM on the SolarWinds website.
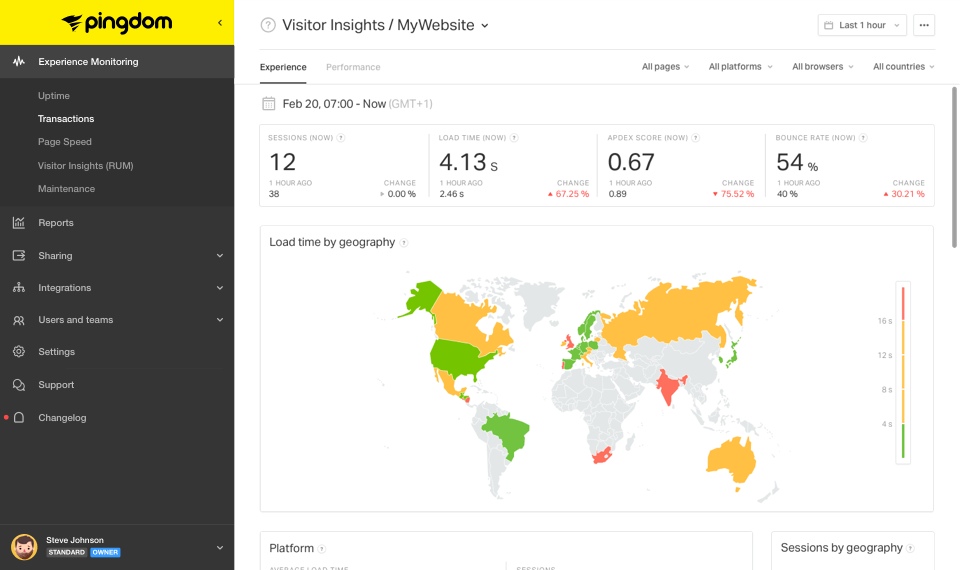
SolarWinds Pingdom® is a great tool designed specifically for website and web-based application monitoring. It’s used by a large number of well-known companies, including Imgur, Shopify, and BuzzFeed, and includes key features to help you to manage your website and web app performance monitoring seamlessly.
First, it can monitor real user behavior and experience. It tracks user performance data for correlation with geographic locations and platform, and analysis for site performance. Page speed is also monitored, so you can see how long each element takes to load, as well as the entire page. This lets you pinpoint which types of content or which elements are slowing you down, and how different elements are interacting.
In addition, Pingdom monitors transactions through websites and web applications, and includes automatic recommendations for responses to common issues. It does this through a built-in editor. This feature can make it easier for less-experienced IT teams to respond to user experience problems. All site interactions can be monitored—including user account creation, purchases, searches, checkouts, and malicious actions such as URL hijacking.
Finally, Pingdom includes an overall website status monitor, so you can keep track of your general website health. Uptime monitoring with alerts can let you know when a problem has come up, and outages can be quickly discovered and remedied, so = your end users are affected as little as possible.
Pingdom offers a 14-day free trial.
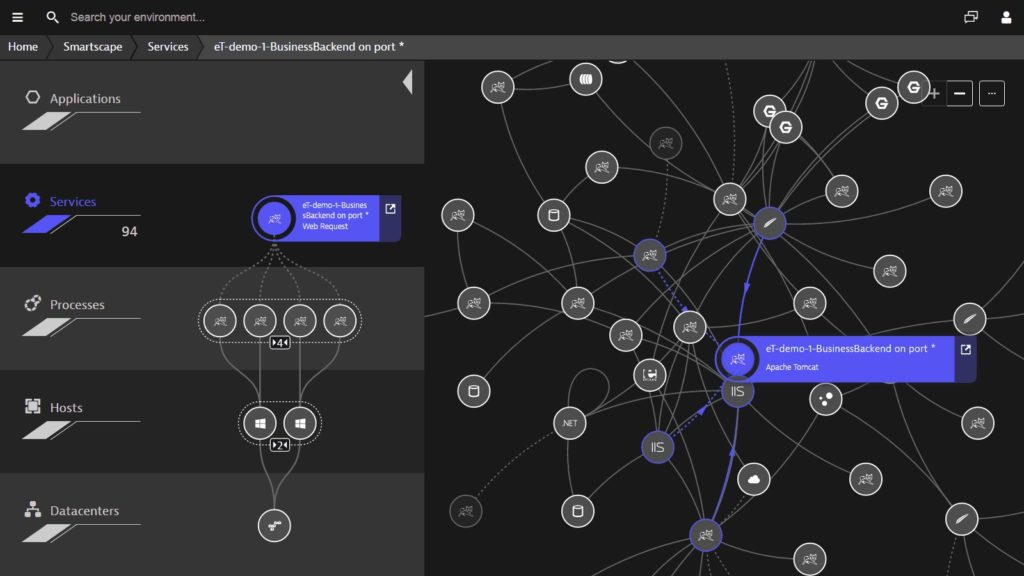
Dynatrace is also useful for automating and monitoring Azure services for user experience purposes. This is a tool purpose-built for use in cloud systems, particularly at the enterprise level. You can use it for a single view across your entire environment, regardless of whether it’s a hybrid setup, multi-cloud, or Azure.
Dynatrace includes automatic configuration and excellent problem detection capabilities, with root cause analysis to assist with troubleshooting. With clear baselines, it easily spots behavior outside of the norm.
One of the great features of Dynatrace is it automatically discovers microservices and containers, without your having to write code or make any image changes in your virtual environment. It also automatically maps your entire environment and can scale as the environment grows.
Its user experience tools include real-time insights, user session capture, and automatic detection of user behavior and satisfaction, and the business impact the user experience is having. You can even check out user sessions using the Session Replay tool.
Dynatrace is available as a free trial for 15 days.
Best Azure Tools for Monitoring Performance
Performance metrics for servers, databases, applications, and network connections are some of the most important metrics for monitoring. This section of the guide focuses on pure performance monitoring. It’s geared toward those of you who want to home in on performance metrics, or who are looking to supplement tools already monitoring other aspects of your Azure services.
SolarWinds Server & Application Monitor (SAM) tops the list as the best Azure monitoring tool for performance. It offers a range of Azure monitoring approaches, including IaaS and PaaS monitoring, in addition to performance monitoring.
Performance monitoring with SAM includes Azure application and infrastructure monitoring, and general monitoring for Microsoft systems, applications, and cloud resources from one console. SAM uses dynamic baselining to set clear expectations of server and application performance and includes alerting features for when things aren’t behaving normally. It allows you to visualize performance metrics in an easy-to-understand way, with tools to correlate these metrics across your entire environment, so you can determine which parts of your environment are performing poorly and how the performance might be causing follow-on issues.
Among its many features, SAM undertakes Azure IaaS monitoring, including monitoring of virtual machine performance, and the performance of Kubernetes. With an auto-discovery system, you can be sure your Azure virtual machines and containers are being monitored. Once you have discovered all the virtual machines in your Azure service, SAM can perform Azure cloud VM management, so you can keep tabs on the performance of your virtual setup. It includes information on how your VMs are communicating across your network, and how VMs and applications are communicating and connected.
Regarding PaaS monitoring, SAM provides service metrics along with key component metrics like CPU performance, available memory, number of requests, response times for devices and components, and information on Azure workloads. Finally, it provides application monitoring, allowing you to look at infrastructure metrics and then compare them to the performance of your applications. With Azure performance over time, and information on configuration, security, and Azure region, you can keep track of your entire Azure setup.
SAM offers a free trial for 30 days.
SolarWinds AppOptics™ provides server and infrastructure monitoring, and application performance monitoring. It can work with custom metrics and analysis, so you can analyze custom infrastructures, applications, and business metrics.
The application performance monitoring component is extensive, with support for a large number of frameworks and libraries, including Go, Java, .NET, PHP, Ruby, Python, and Node.js. It also undertakes distributed performance tracing across processes and hosts, and to the data center. This ensures you can easily get to root-cause analytics from looking at application performance trends.
In addition to application monitoring, AppOptics includes a unified dashboard for server and infrastructure monitoring. This helps speed up MTTR for issues on the front end, and it can work well with hybrid and cloud-native environments including Microsoft Azure.
One of this tool’s great features is it provides custom metrics and analytics, so you can customize the entire tool based on the specific information you’re looking to record and examine. You can use tags to filter and group data in many ways to drill down into particular datasets (filtering options include cloud regions, instance types, and availability zones). AppOptics can also track one metric over time, and then compare past performance to current performance.
You can request a demo of AppOptics, or try it free for 14 days.
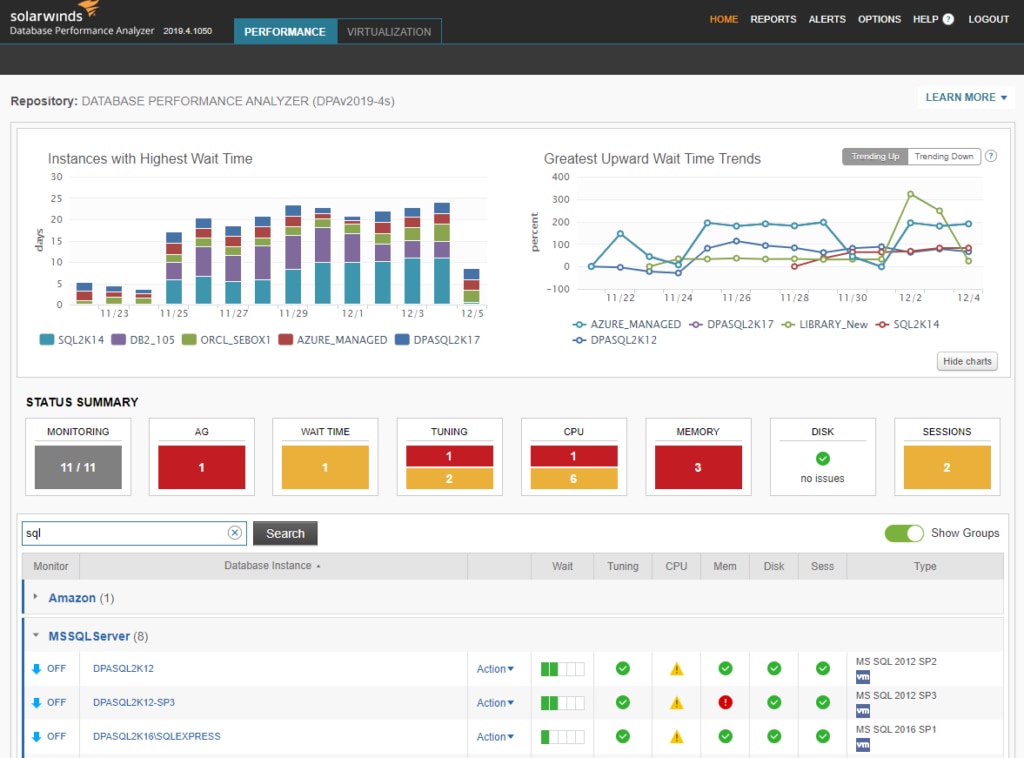
SolarWinds Database Performance Analyzer (DPA) is a great performance monitoring tool designed specifically for databases. Monitoring the performance of your databases is important, as slow database access can have a major impact on the other applications and services you offer.
With DPA, you can track the performance of relational database operations, host server and operating system, virtualization resources, and storage I/O. This gives you a comprehensive overview of how your databases are performing, and how they may be affecting the performance of your applications. You can use SolarWinds DPA with Microsoft Azure, SQL Server, and SQL databases.
The tool provides 24/7 monitoring and accumulates a large backlog of historical information, which helps to set accurate baselines. Using these baselines, it can easily determine unusual behavior and notify you of bottlenecks or spikes in wait time. To figure out why the issue is occurring and where it’s coming from, DPA incorporates several correlated resource metrics. It can go so far as to perform detailed blocking and deadlock analysis, looking at the blocking tree to see which queries and sessions were involved in the slowdown.
From there, DPA can help you to optimize and fine tune performance going forward, so you run into fewer issues in the future. It includes a repository of table tuning best practices, against which you can check your own practices to make improvements where necessary. This means you can ensure database performance (optimization and tuning) for traditional databases and IaaS and PaaS databases.
SolarWinds offers a 14-day free trial of DPA.
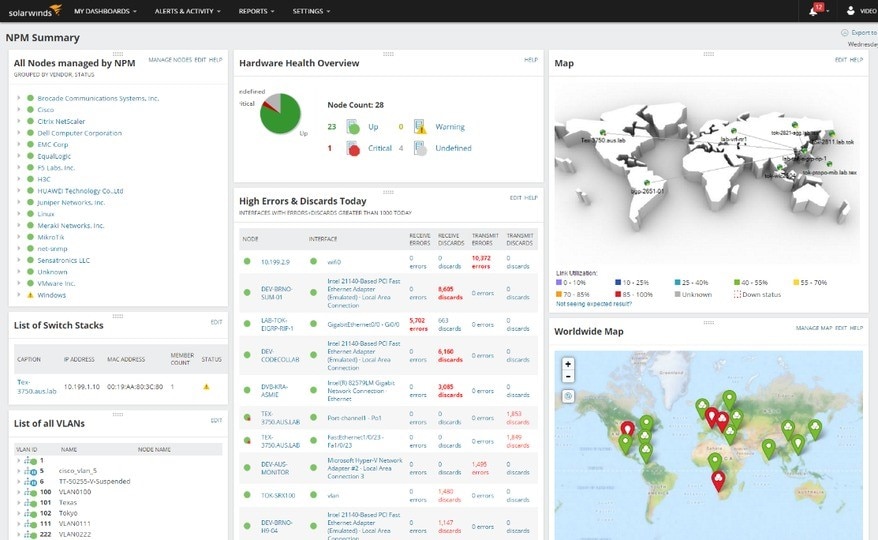
For comprehensive performance across your network, SolarWinds Network Performance Monitor (NPM) is a robust tool including noteworthy features for discrete monitoring tasks.
First, NPM provides excellent baselining tools and general network health measures, so you can determine what your “normal” is and be alerted to any network performance changes or network event log occurrences moving away from this baseline.
If you’re dealing with a slow network or troubleshooting an issue, NPM can use deep packet inspection software to determine possible causes. NPM also includes LAN monitoring and mapping of routers, switches, servers, and SNMP-enabled devices. This means you’re able to quickly check on the core availability of your services and device health.
NPM allows you to visualize the entire network path using NetPath, which tracks network traffic from source to destination, even if the source or destination is outside your own network. This can help with troubleshooting and network optimization, as you can see which parts of your network are struggling and which could use additional optimization. You can use the NetPath tool regardless of whether your entire network is on-premises, in the cloud, or a hybrid; you can also use it with software-as-a-service applications.
Finally, NPM provides general network discovery and mapping tools, through which you can gain an overview of your entire network topology, functionality, and setup. This helps to ensure you have a clear understanding of how everything links in with your application availability, database access, and connections to the cloud.
NPM can be downloaded as a 30-day free trial.
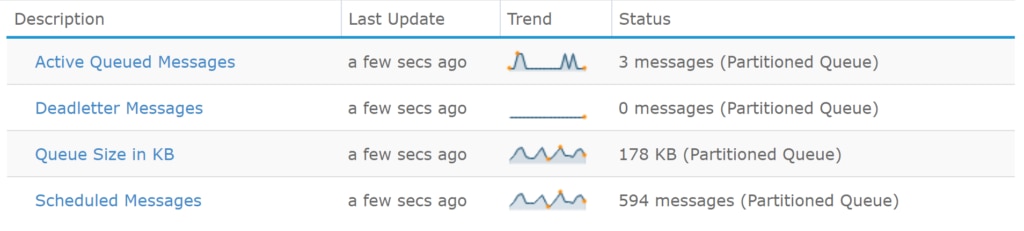
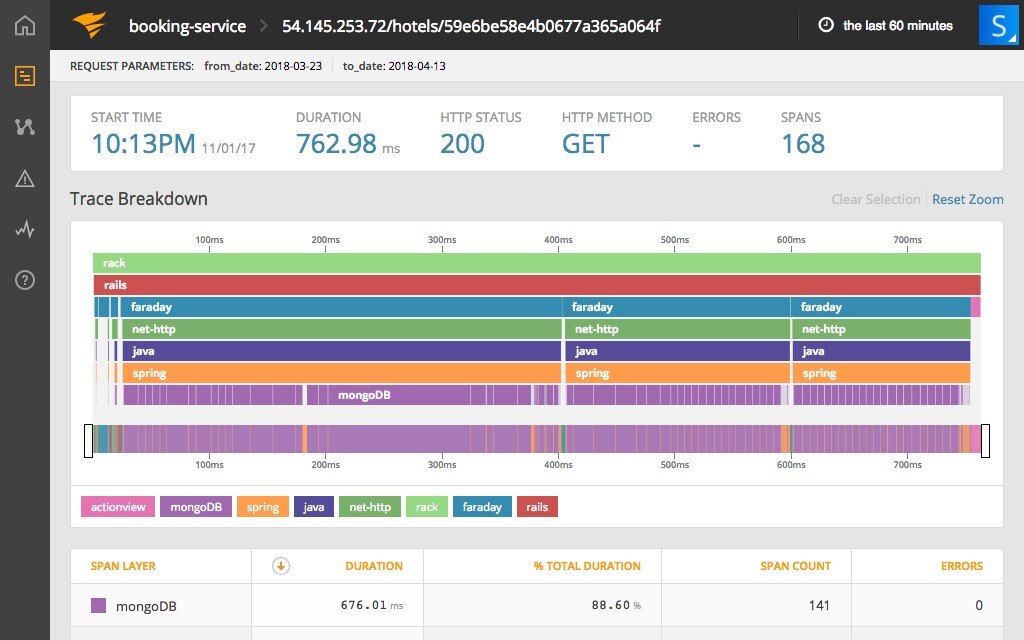
Stackify Retrace is another useful tool to consider for performance monitoring. It provides cloud-based monitoring to support Azure services, including applications, storages, databases, and more. You can use Retrace to monitor and troubleshoot problems with applications, no matter where they’re deployed.
It provides basic performance metrics, partial support for event tracing, and support for slow and overused SQL queries. In addition, it provides monitoring for Azure service bus queues, so you can see whether messages are stacking up, indicating slow application performance.
Finally, it tracks user satisfaction with application performance using Apdex scoring. This can prove helpful with end-to-end performance monitoring.
Installation is simple. You can try out Stackify Retrace free for 14 days.
Best Tools for Migrating to Azure
Before you migrate your entire infrastructure to Azure, you need to ensure everything is optimized and ready to go—particularly because migrating unnecessary data could cost you financially. I highly recommend using a tool to rightsize VMs, optimize configurations, and plan ahead for an Azure migration.
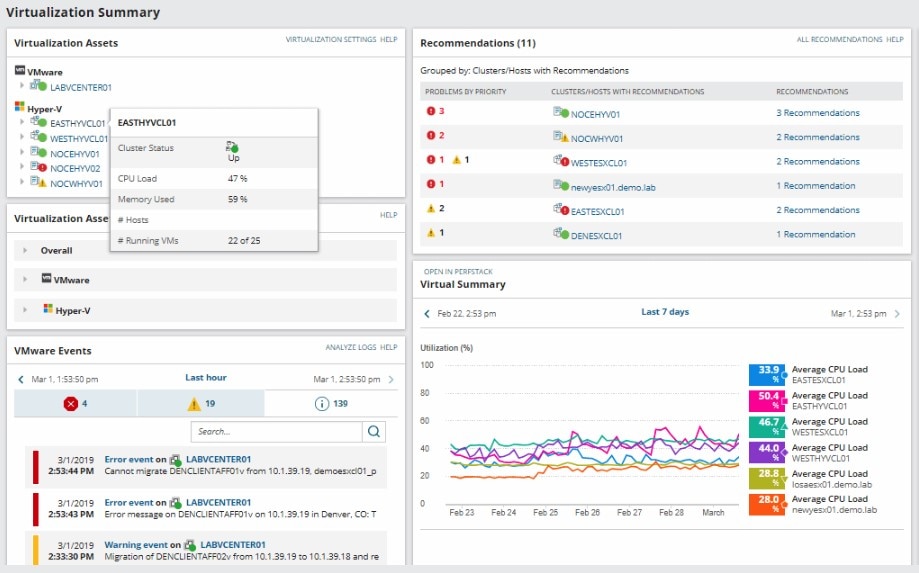
If you’re running virtual machines as part of your Azure service, you need to ensure you’re monitoring them at all times after deployment. SolarWinds Virtualization Manager (VMAN) offers complete visibility across all your virtual environments. Its capabilities include monitoring and alerting on Azure infrastructure metrics.
VMAN also undertakes virtual machine management functions, which can help you to optimize your virtual systems prior to migration to Azure. You can use VMAN to rightsize VMs, so you don’t end up spending more money than necessary on the migration. The tool includes sprawl alerts and recommendations, so you can figure out where you have virtual machines you don’t need, and it automatically identifies places where you can free up resources for both storage and processing power.
In addition, VMAN provides comprehensive performance management, optimization, and capacity planning tools for VMs, including alerting and reporting capabilities. You can continue to use these tools and features after you have migrated to Azure.
You can try VMAN free for 30 days.
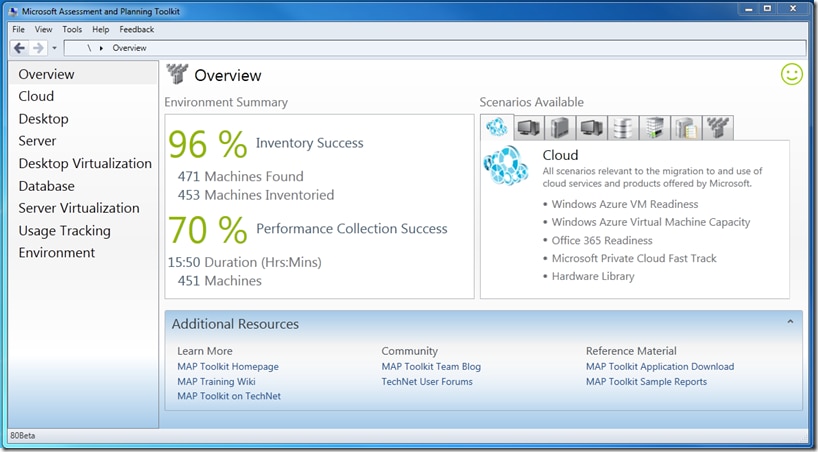
The Microsoft Assessment and Planning (MAP) Toolkit makes desktop, server, and cloud migrations easier, by providing several reports on how ready your systems are for migration. These readiness reports can help you to pinpoint any problems you need to iron out before you can migrate everything to an Azure service.
The MAP Toolkit provides a significant amount of information on software and hardware metrics and health. In addition, it includes recommendations to assist organizations in speeding up the IT infrastructure and migration planning process. It provides server utilization data for use in planning for Hyper-V server virtualization, so you can keep tabs on the size of your Hyper-V servers and optimize them, if necessary, prior to migration. It also highlights all your Active Directory accounts and allows you to check on your account permissions before you migrate.
The MAP Toolkit is free to download from Microsoft. Note, this is a relatively lightweight tool designed with specific uses in mind. If you need more comprehensive reporting and information on your systems, you’ll want to look into a professional solution.
Key Takeaways
Microsoft Azure is a great way to consolidate your infrastructure and application services into one hybrid package. However, with these large services covering so much of your business offering, it’s essential you keep a close eye on how your systems are performing. A good-quality monitoring solution will either provide an overview of the entire service in question or undertake deep monitoring for a specific part of the service, such as application performance.
There are several Azure monitoring tools for hybrid management on the market; and if you’re looking for tools focused on individual management and monitoring tasks, you won’t find any shortage. Hopefully the reviews in this guide have given you a sense of what’s out there. I recommend you try out a few products until you find the best Azure monitoring tool for your business. Taking advantage of free trials is a great way to test out which tools have the features you need.