
Oracle is a strategic partner of VMware, which means Oracle databases benefit from a lot of support and compatibility. Microsoft SQL Server, Oracle Applications, and Oracle Database have their own features aligned with vSphere capabilities, which pushes Oracle database availability, scalability, and performance to a higher level. However, the VMware database is complex, and you’re likely to stumble across many performance pitfalls.
This guide will outline performance monitoring tips for the Oracle database on VMware, so you can maximize performance and make the most of your resources. It will also recommend SolarWinds® Database Performance Analyzer (DPA) as a top Oracle VM performance monitoring tool. This tool combines an impressive range of advanced features with optimal user-friendliness and is designed to scale with your business as it grows.
- VMware Database Benefits
- Oracle VM Performance Monitoring Tips
- The Best Oracle VM Performance Monitoring Tool
- Getting Started With VMware Performance Tuning

VMware Database Benefits
The Oracle VM database platform provides a fully equipped environment to help you leverage the advantages of virtualization technology. The Oracle database on VMware allows you to deploy application programs and operating systems within a supported virtualization environment.
There are several advantages associated with VMware virtualization solutions. VMware virtualization creates a layer of abstraction between the resources required by an operating system and an application, and the underlying hardware supplying those resources. The abstraction layer delivers four key points of value: ease of provisioning, consolidation, manageability, and availability.
- Ease of provisioning: VMware virtualization encapsulates an application into an image. This image can be copied or moved, minimizing the cost of application deployment and provisioning significantly.
- Consolidation: VMware technology enables numerous application servers to be consolidated onto a single, physical server. This is achieved with little or no impact on overall performance.
- Manageability: By using VMware vSphere vMotion, virtual machines can be transferred between servers with no downtime. This massively simplifies common activities and operations, like hardware maintenance, and reduces planned downtime occurrences.
- Availability: If unplanned hardware failure occurs, VMware vSphere High Availability (HA) will restart the impacted virtual machines on an alternate host within a VMware cluster. By using VMware HA, you can dramatically reduce unplanned downtime and facilitate higher application service levels. To achieve zero data loss and zero downtime, you can use VMware vSphere Fault Tolerance (FT), which provides continuous availability for any application running in a virtual machine, if there are server hardware failures.
Oracle VM Performance Monitoring Tips
The following tips for Oracle database VM performance monitoring can help you take full advantage of the resources at your disposal, optimizing VM database performance and refining your understanding of VMware performance tuning. These tips focus on metrics to help you effectively monitor your Oracle database on VMware.
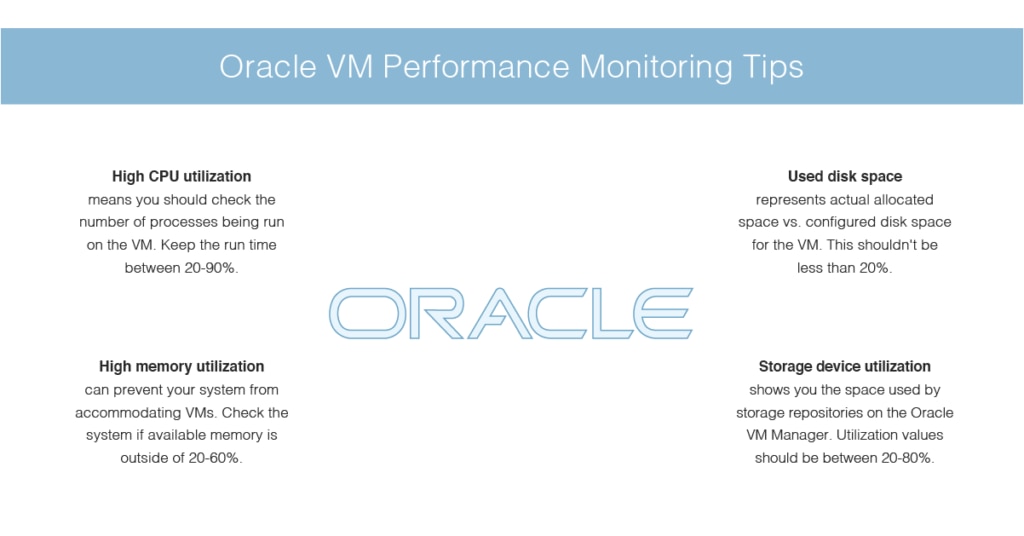
CPU Utilization
High CPU utilization on the Oracle database VM server may indicate the overall CPU utilization for the server is even higher. This could cause performance problems. High CPU utilization on the virtual machine itself could mean the individual virtual machine being impacted needs attention.
Start by checking the number of processes being run on the virtual machine. To be notified about processor utilization on the physical computer and virtual machines, set a threshold on this attribute. It’s also worth considering setting up an alert to notify you if the total run time is more than 90% or less than 20%.
Memory Utilization
The memory utilization metric measures the amount of memory being used, as a percentage. A low memory value might indicate you’re running out of memory. If memory runs out, you’ll likely see critical performance problems. One or more servers might stop responding if the available memory cannot accommodate virtual machines. If you have enough memory available, then you should be able to add more virtual machines to the host, which will distribute the load from other hosts more evenly.
On a virtual machine, the memory utilization metric refers to the allocation percentage of memory from the server compared with the configured memory. As an example, if virtual machines are configured with 1GB of memory and the server has allocated all the memory to the virtual machine, then the memory utilization will be reported as 100%. You can’t see how the virtual machine is using the allocated memory.
To be notified of the memory available on the host, set a threshold for this metric. I also recommend setting up an alert to notify you if the available memory is more than 60% or less than 20%.
Used Disk Space
The used disk space on your virtual machine represents the percentage of actual allocated space compared with the configured disk space for the virtual machine. In the event of sparse allocation, this metric is effective at helping you identify how much disk space is actually being used by the virtual machine. This insight can assist with fine-tuning virtual machine storage allocation. If this value is too low, for example, you could consider reconfiguring the disk space for the virtual machine to reflect this.
Set a threshold for this metric to be alerted to any disk space issues. I suggest configuring the alert to notify you if the disk space is less than 20%.
Storage Device Utilization
The utilization metric shows you the amount of space being used by the storage repositories configured on Oracle VM Manager. You can use this metric in combination with the “Free” metric, which displays the amount of free space available on the storage device.
You should set up an alert to notify you if the utilization and free space values are over 80% or below 20%.

The Best Oracle VM Performance Monitoring Tool
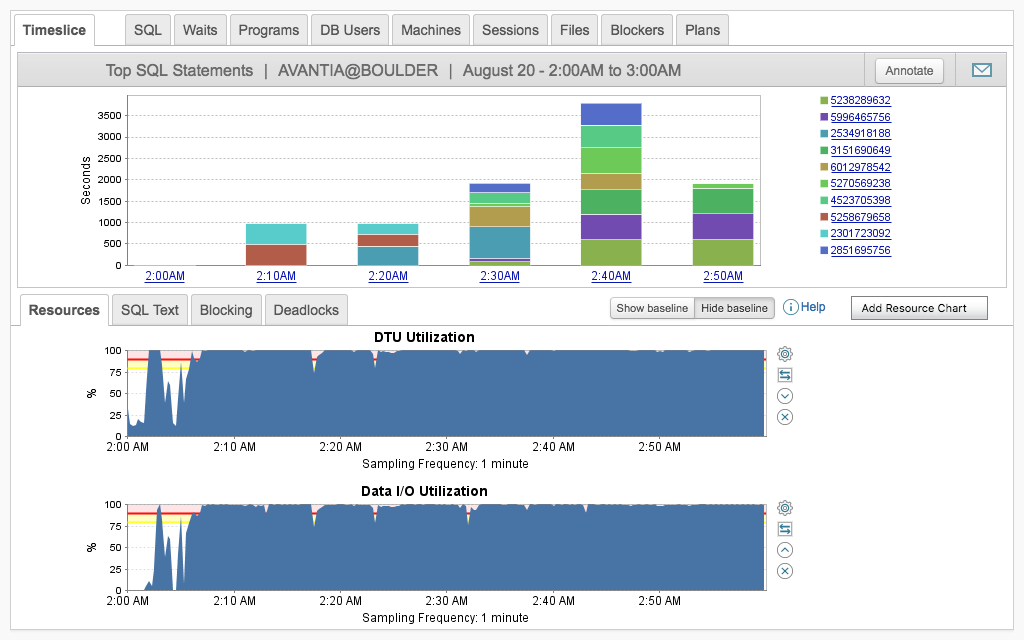
SolarWinds Database Performance Analyzer is an intuitive VMware performance tuning tool designed to help you optimize your VMware database. It provides easy drill-in and context-setting capabilities, giving insight into your Oracle performance with an at-a-glance picture across all key dimensions. This includes waits, applications, users, SQL, client machines, and much more. Data is represented in the form of graphs and charts wherever possible, for ease and speed of data interpretation.
DPA features blocking analysis functionalities to help you improve your understanding of your Oracle blocking hierarchy. Know who is blocking whom, along with the overall impact blocking is having on Oracle database VM performance. With DPA, you’re given access to workload and index advisors, which identify high-impact, inefficient PL/SQL code to pinpoint indexing opportunities.
You also have access to SQL table tuning advisors. These point to problems requiring immediate attention, covering blocking data, resource metrics, SQL and plan analysis, and much more.
This tool includes advanced anomaly detection, powered by machine learning technology. It uses an intelligent algorithm that improves over time to understand your Oracle wait behavior, alerting you when patterns deviate.
DPA’s monitoring capabilities are extensive, allowing you to conduct root cause analysis supported by historic and real-time monitoring. DPA monitors Oracle 24/7, helping you forecast where performance is headed and understand how your Oracle system is trending. It includes Oracle Standard Edition and Oracle Exadata performance monitoring.
The tool’s management API helps you automate and scale the management of your database environment. The REST API can be used to programmatically manage your environment, including the ability to license, stop and start monitors, register, annotate, and more.
This is a highly collaborative tool, allowing developers, database administrators, and operations teams to work together to achieve optimal performance levels. The web interface can be accessed from anywhere, with read-only rights ensuring it’s safe to use across teams. This gives Oracle developers insight into the impact of code in production, while allowing operations teams to view the results of changes in real time.
A monitoring tool is only as good as its alerting functionality. Fortunately, DPA’s alerting and reporting capabilities are advanced and thoughtfully designed. This tool was built to provide comprehensive alerting without overloading your inbox. With baselining, you can highlight outliers, and with prebuilt monitoring alerts and reports, you can get up and running straightaway. Alternatively, you can create and customize your own alerts and reports to suit your organization’s specific requirements.
Lastly, DPA helps you replace features lost when migrating from Oracle Enterprise Edition to Oracle Standard Edition. It achieves this with high-fidelity Oracle SE performance monitoring not reliant on OEM diagnostic packs, alongside RAC-specific wait event monitoring, custom metrics and alerts for extending DPA for Oracle, and 24/7 monitoring with less than a 1% load on monitored servers.
DPA is ahead of the market curve, offering advanced utilities designed to scale with your business as it grows. It’s user-friendly, dynamic, and supports collaboration without compromising security.
Getting Started With VMware Performance Tuning
 The Oracle database on VMware performance monitoring tips outlined here can help you fine-tune your VMware database to achieve greater performance outcomes and reduce bottlenecks. Oracle database VM tuning is a continuous and challenging process, but it’s made easier with appropriate performance monitoring tools. To achieve the best results, SolarWinds DPA for Oracle DB comes highly recommended. A 14-day free trial is available.