MySQL is an open-source, relational database management system based on Structured Query Language (SQL). MySQL is used by dev teams in a wide variety of use cases, most commonly in data warehousing, e-commerce, and logging applications. However, its most popular deployment is in web databases, since it’s highly flexible, reliable, and scalable. It can be used to store everything from single records of information to full inventories of products.
SQL Server, on the other hand, is a commercial relational database management system first developed by Microsoft. Like MySQL, SQL Server supports many platforms including Linux, Microsoft Windows, and Windows server systems. Most commonly, SQL Server is used by developers for .Net applications and windows projects. As a commercial product, SQL Server has a wider community of support.
In this guide, I’ll go over some metrics to help your performance tuning efforts. I’ll also discuss some of the best SQL Server and MySQL tools on the market, including the solution I most highly recommend—SolarWinds® Database Performance Analyzer—due to its robust monitoring and analysis features unlike any other tool on the market.
Monitoring SQL and MySQL Performance Best Practices
Best MySQL and SQL Server Performance Tuning Tools
Database Monitoring Is a Must. Get It Right, Do It Constantly, and Profit

Monitoring SQL and MySQL Performance Best Practices
The most important aspect of monitoring your SQL performance is to make thoughtful decisions about what metrics and alerts you need to monitor. Although this will partially depend on your organization and industry, it’s generally a good idea to monitor the following processes:
- Required process running
- Common failure points
- Resource utilization
- Query executions (failures and completions)

In addition to monitoring these processes, you also want to monitor specific metrics related to your MySQL view performance health. The following are a good place to start:
- Uptime: The second it takes for a server to respond to a request.
- Threads connected: The number of clients currently connected to the server. If no one is connected or too many are, this might be a sign of trouble.
- Max used connections: The numbers of connections made since the server started.
- Aborted connects: The number of failed connection attempts. Too many could be a sign of suspicious activity.
Dev teams should also be sure they monitor SQL query metrics to ensure the database is fulfilling its basic tasks. Some examples are:
- Questions: The number of statements sent by clients.
- Queries: The number of executed statements including stored procedures.
- Read and write requests: What allows users and developers to access the same page in real time.
Other important metrics to collect to carry out SQL Server or MySQL performance tuning include typical SQL errors. These are the frequent failure points you should always keep an eye on:
- Errors: Always check to make sure there aren’t any errors on the mysql.log file.
- Log files size: Inspect log streams to see if all files are being rotated properly. If not, it could bottleneck your server.
- Deleted log files: Make sure the file descriptor is closed after any log files are deleted.
- Backup space: Always be sure you have enough disk space for MySQL backups.
Best MySQL and SQL Server Performance Tuning Tools
Attempting to capture the above metrics is difficult without the right tools. The following programs are some of the best tools for real-time monitoring SQL databases, whether you use MySQL, SQL Server, or another relational database.
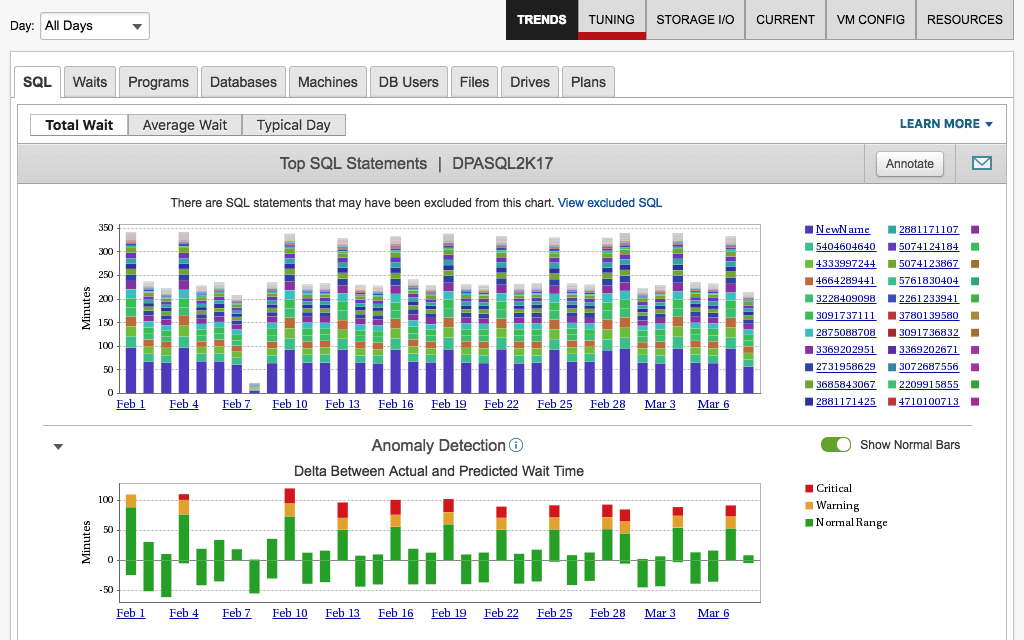
SolarWinds Database Performance Analyzer (DPA) offers a full-stack database performance monitoring and analysis tool. It’s an excellent solution for database administrators, IT teams, and application developers alike. It supports real-time monitoring and analyzes SQL database instances to mitigate bottlenecks, improve services, and save costs. You can easily compare MySQL vs. SQL Server performance metrics if you use both types of databases.
This cross-platform solution for database performance monitoring works in both cloud and on-premises databases, making it an ideal choice for an array of different organizations. It has tons of helpful features, like machine learning-powered anomaly detection and in-depth wait-time analysis. These features empower IT admins to improve their mean time to resolution and address database performance issues with faster speed.
One of its best features is it offers IT teams both real-time and historical data of their MySQL performance by tracking response time and server statistics in the data warehouse repository (which can be configured right to your MySQL database). These insights empower DBAs to address critical problems with a better understanding of their server infrastructure.
What’s more, SolarWinds DPA is incredibly easy to use. You can set custom alerts, create custom metrics, and even schedule graphical performance reports and have them delivered via email to the relevant IT team. To see if DPA is the best solution for your MySQL monitoring needs, you can download the fully-functional tool risk-free for 14 days.
PROS:
- It supports a wide variety of databases, both cloud and on-premises.
- It’s easy to use yet flexible, allowing custom alerts, metrics, and more.
- It uses AI-powered anomaly detection, improving the mean time to resolution for many issues.
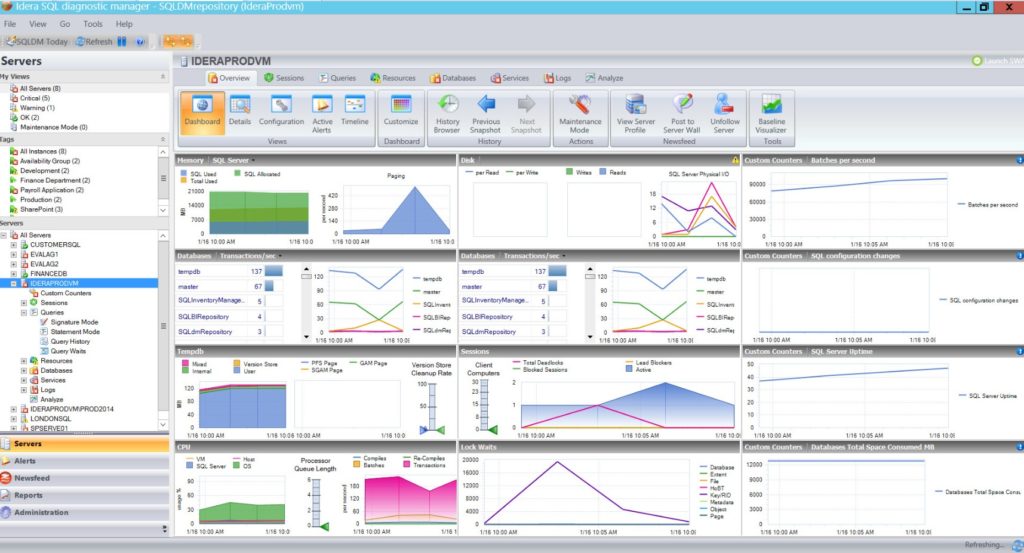
Idera Diagnostic manager offers IT teams performance monitoring for SQL databases in both physical and virtual environments. It tracks performance statistics and key metrics and can be configured to sends alert to help DBAs better manage their VMs and database. It also enables IT teams to perform proactive monitoring of queries along with transactional SQL monitoring, while providing you with recommendations for your SQL DBMS.
With Idera, you can gain insight into not just availability and health, but security vulnerabilities and configuration settings. Use simple visual charts for at-a-glance visibility—easily analyze metrics like disk space or get an overview of servers with current warnings and alerts. Overall, this is a useful and flexible tool for monitoring SQL databases.
PROS:
- Idera allows proactive query monitoring and provides recommendations.
- It provides insights into security vulnerabilities, configuration issues, database availability, and health.
- Simple charts allow quick visualization of the main metrics and server warnings.
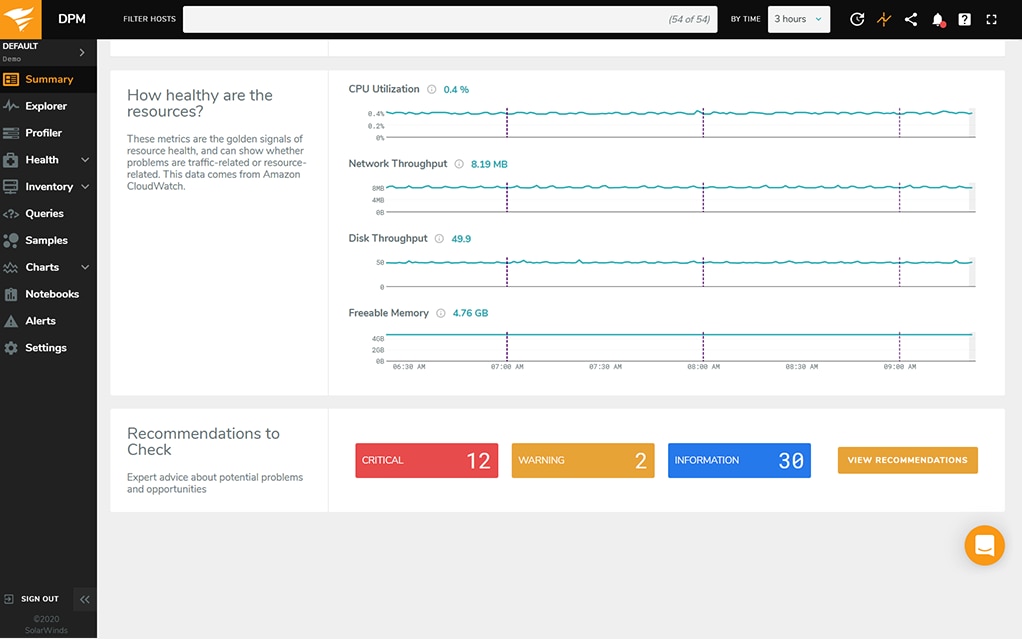
SolarWinds Database Performance Monitor (DPM) is a SaaS monitoring solution, which means you don’t have to buy or maintain a traditional application, which dramatically reduces the friction of starting out with it.
The tool can monitor databases locally, in the cloud and hybrid, and it focuses on open-source and NoSQL databases, which includes not only MySQL but also PostgreSQL and Redis. DPM offers 24/7 real-time monitoring to track a plethora of metrics, then display them using a user-friendly yet powerful dashboard. Some of the supported metrics are:
- MTTD
- MTTR
- Deploy frequency
- Availability
- Reduced failed deploys
DPM takes security seriously, being fully compliant with both SOC2 and GDPR.
PROS:
- Cloud-based solution, which means less friction to get started and use.
- 24/7 real-time monitoring over a huge number of metrics.
- Flexible yet easy-to-use dashboard.
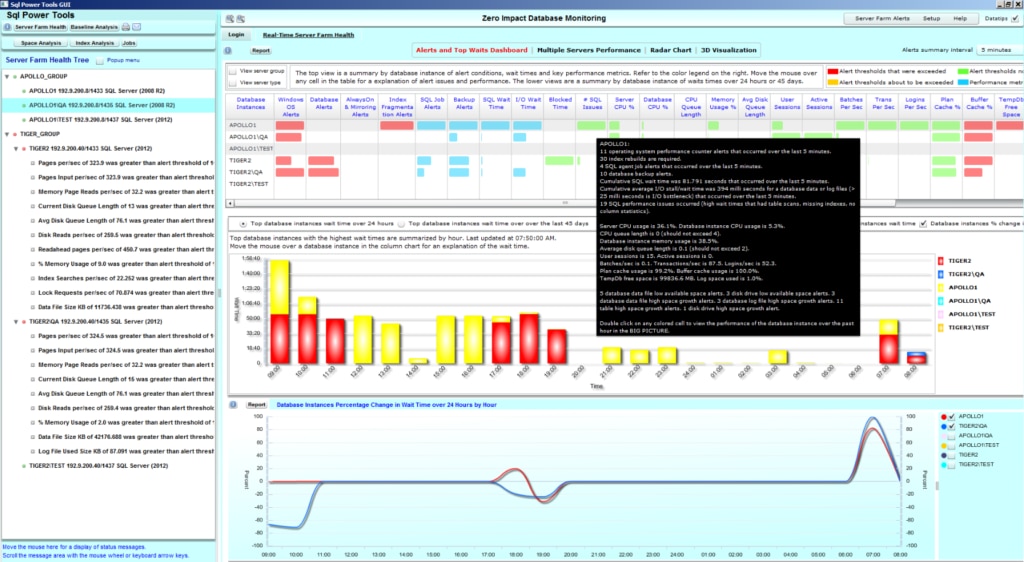
Another good option for DBAs is the SQL Power Tools. Billed as a “zero impact” solution, this agentless database monitoring solution provides IT teams access to over 120 different metrics of their server infrastructure, from wait times and blocking to disk space usage and index fragmentation. You can view 30-day trends or set up alerts for instant awareness. It’s a reliable lightweight with little overhead, but larger organizations may struggle to scale it to fit their needs.
PROS:
- “Zero impact solution” with low friction.
- Large number of metrics to monitor the whole server infrastructure.
- Lightweight and reliable tool suited for simpler scenarios.
The Percona Monitoring and Management Tool is a free, open-source solution admins can use to monitor and manage their MySQL databases. Percona can be fully adopted into your existing IT system, meaning admins can be sure the solution is run in a safe and reliable setting. What’s more, Percona can map queries against metrics, which enables SysAdmins to make better decisions for optimizing their MySQL performance.
As an open-source option, support can be limited, and IT teams will lose out on some of the more advanced functions they’d expect to see in an enterprise-grade solution. But all in all, it’s a reliable option for many organizations.
PROS:
- Maps queries against metrics, allowing admins to take queries into account when optimizing MySQL performance.
- Reliable and lightweight solution best suited for simpler scenarios.
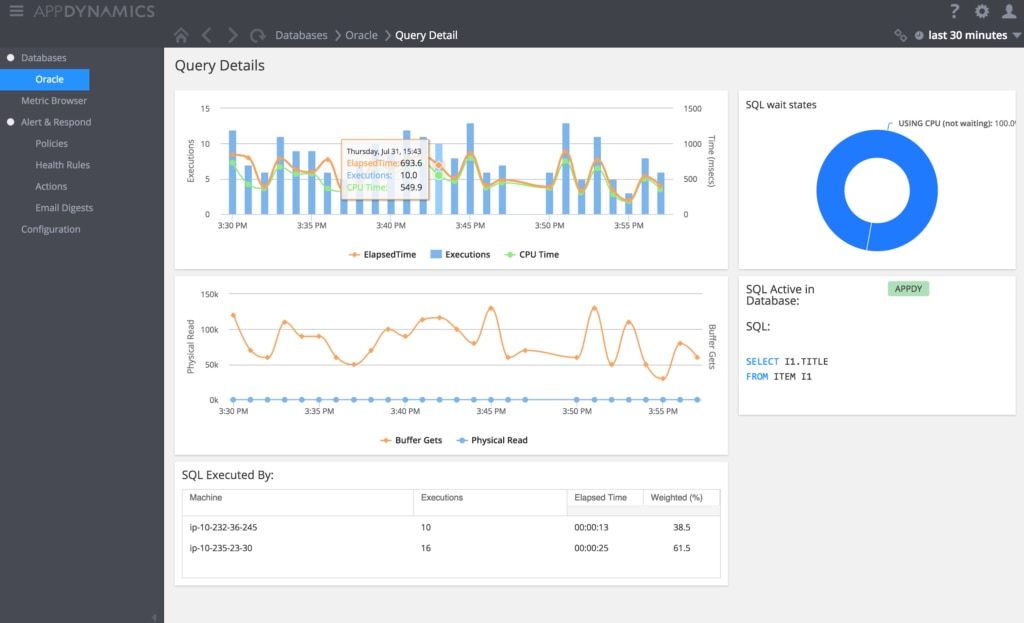
This enterprise-grade MySQL tool has tons of comprehensive features that make it an excellent solution for many large businesses. For one, it offers IT teams real-time insights into MySQL database performance and health metrics, so they can identify and troubleshoot issues with efficiency. What’s more, AppDynamics enables IT teams to set metric baselines for what they deem to be healthy performance standards for their MySQL environments. The tool will then collect and display newly generated metrics against said baselines, so admins can monitor their systems with a better understanding of what is healthy behavior.
The only issue with AppDynamics is the solution comes in a lite plan and a pro plan. While the lite plan is free to use, it offers limited features and its data retention is almost nonexistent. The pro plan is better, but expensive.
PROS:
- It offers real-time insights into MySQL performance and health metrics.
- It allows users to define baselines for healthy performance, and then base new metrics on these baselines.
Database Monitoring Is a Must. Get It Right, Do It Constantly, and Profit
Databases are central to virtually any technological endeavor. Yet, some companies, despite devoting a lot of resources into their databases, don’t seem to care about monitoring them. That’s baffling since it’s akin to not wanting to know the return on an in investment and a particularly costly one at that.
When it comes to relational databases, Microsoft SQL Server and MySQL are two of the most popular choices. While the former is an enterprise offering, developed by a gigantic corporation, the latter is a free and open-source tool, despite being also available under commercial licenses. Being two widely known relational databases, there are a huge offering of database monitoring solutions targeting MySQL and SQL Server.
Although all the tools we’ve covered have their merits, my top choice is SolarWinds Database Performance Analyzer. As I’ve mentioned earlier, DPA features unparalleled monitoring and analysis features.
An honorable mention goes to SolarWinds other tool, Database Performance Monitor. DPM’s a cloud-based solution, with no download, maintenance, or provisioning required. Upgrades are done automatically. And since DPM is a SaaS solution targeting specifically open-source databases, it’s a solid choice for MySQL monitoring.
By now you should be ready to make an educated decision on the right tool for your MySQL or SQL Server monitoring needs.