
Amazon Web Services (AWS) is a secure cloud services platform that has become a key contributor to business growth and scaling. It provides virtual equivalents to traditional hardware components, like CPU and storage, while offering practically unlimited data flexibility due to its cloud-based services.
AWS offers computing with almost no overhead, which means your business can expand AWS services as you see fit—no more need to invest in lots of hardware or expensive VMs when you’re getting your business off the ground. Because of its scalability, flexible computing, and web-based storage, AWS is becoming increasingly popular among both small and large businesses.
Given the sheer capacity of AWS, it’s fundamental for users on this server to scale and grow their business also use AWS application monitoring and optimization tools. AWS is a complex ecosystem, and with complexity comes the inevitable need for streamlined management strategies. Businesses looking for monitoring solutions to integrate with AWS should consider which of the following tools would be best suited to their needs.
Why Use Amazon Web Services Monitoring Tools?
How to Choose an AWS Monitoring Tool
List of Top 10 AWS Monitoring Tools
Tips for Amazon Web Services Monitoring
Why Use Amazon Web Services Monitoring Tools?
For optimal AWS services, businesses often turn to third-party AWS monitoring tools. Cloud infrastructure from AWS isn’t necessarily unmanageable on its own—Amazon CloudWatch, a simple AWS monitoring tool automatically integrated with AWS systems, offers useful resource data from your virtual operations and generates automatic AWS data records. CloudWatch also provides basic metrics to keep track of your memory, CPU, and CDN functionality. But as any IT admin who works with AWS can tell you, CloudWatch doesn’t cover every AWS management task you need to successfully manage your AWS ecosystem.
CloudWatch is helpful for making sure your AWS operations are in good shape. However, there’s a reason so many third-party AWS monitoring tools are out there. Third-party tools allow you to optimize your AWS functions, keeping them healthy instead of just stable. AWS can be a crucial investment for any business if you know how to get the most bang for your buck.
How to Choose an AWS Monitoring Tool
The basic goal of any AWS monitoring tool is to extend and optimize CloudWatch in a user-friendly way. To reach this objective, software companies offer different tools designed to work with AWS metrics to provide real-time analysis of AWS operations. With AWS monitoring tools, the benefit to your business is front and center—these tools can provide suggestions for efficient resource management, alerts for bottlenecks and unusual data log entries, and graphics showing cloud resource trends. Some AWS monitoring tools even offer tips on how to optimize your budget.
Considering the dozens of AWS monitoring tools on the market, it can be difficult to figure out which one is right for you. Many AWS monitoring tools offer slight variations on the same theme. The most basic consideration for your business should be: do I want a closed-source or an open-source solution?
Closed-source AWS monitoring tools offer unique benefits for your bottom line. There’s a bigger difference between closed-source and open-source tools than just the paywall—closed-source tools offer easier installation with copyrighted customer service guides, strong customer support specialists, and email updates. Open-source software, on the other hand, offers public forums for user issues and updates. Though closed-source tools are generally easier to manage, free open-source software might be more appealing to smaller businesses with less flexible cash flow.
To help you sort through the options, I’ve made a list of my favorite closed-source AWS monitoring tools. If you’re interested in the user-friendliness of closed-source tools but aren’t sure you want to invest in one right away, keep in mind many offer free trials with full functionality.

Top 10 AWS Monitoring Tools
Based on value, versatility, and reliability, here are the 10 best AWS monitoring tools on the market right now:
1. AppOptics
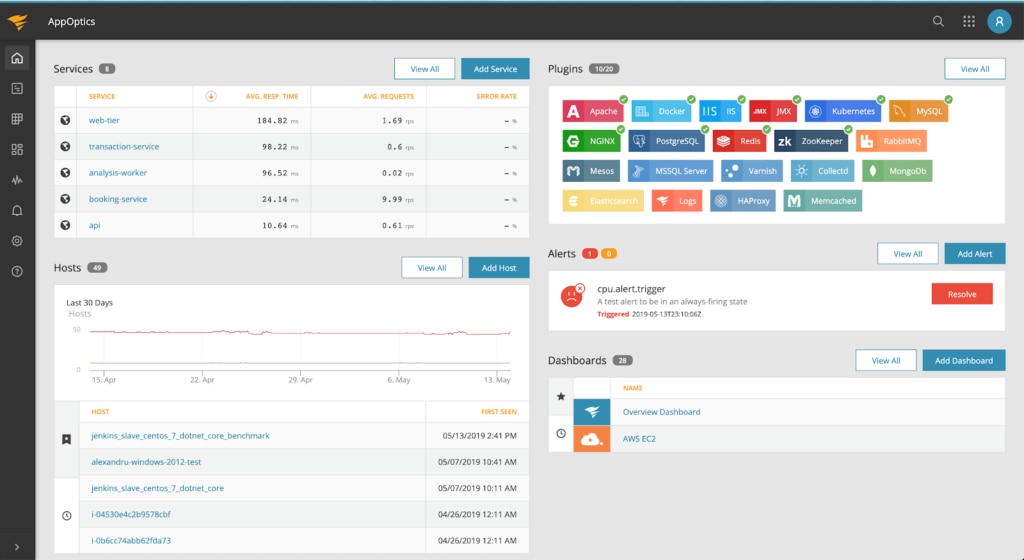
SolarWinds AppOptics is a SaaS-based platform offering infrastructure, application, and server monitoring. It’s specifically designed AWS CloudWatch monitoring feature pulls real-time performance metrics from your AWS services. AppOptics integrates with a wide range of AWS services, including Elasticsearch, API Gateway, DynamoDB, and many more.
While a default AWS dashboard exists in AppOptics, you can curate and create unlimited dashboards and custom tags, according to your preferences. You can integrate metrics from as many instances as you need and add multiple AWS accounts. Admins can choose to monitor custom AWS metrics and filter their view of metrics as needed. Pulled at default or custom intervals, your AWS metrics are displayed on live, interactive dashboards and associated with performance stats to speed data interpretation. (Plus, the API call integrates only active data, so you don’t waste resources.)
It’s also worthwhile to point out SolarWinds is an advanced technology partner within the AWS Partner Network (APN), meaning they’re among the cloud software and service providers who have been endorsed by AWS. To achieve this status, they’ve had to satisfy the advanced AWS requirements, which consider customer satisfaction, business investment, and product status.
2. Papertrail
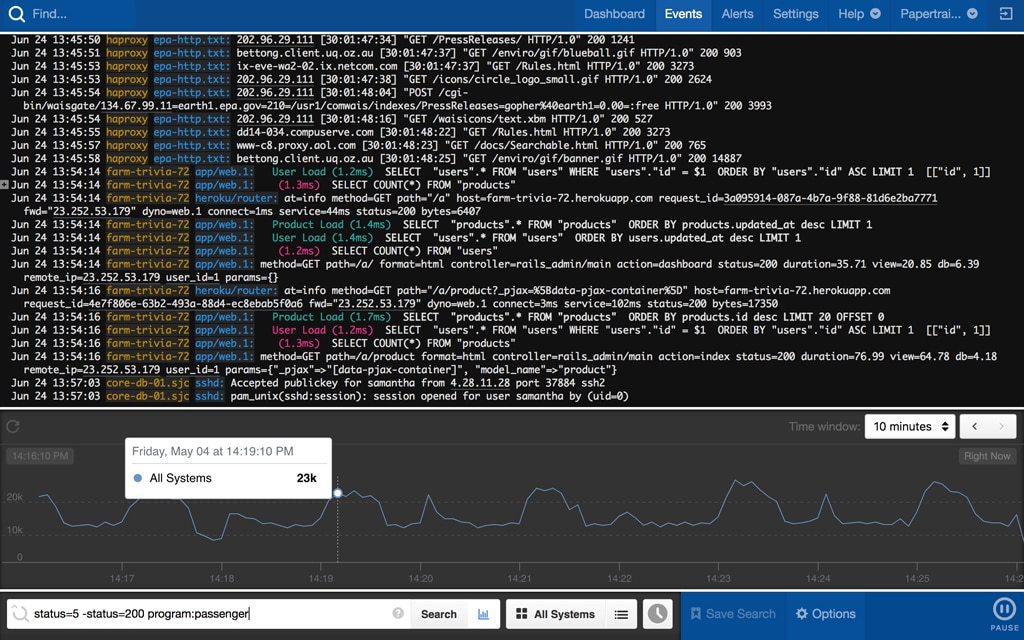
The SolarWinds Papertrail tool is a logging solution built to integrate across your IT infrastructure, including your AWS environment. Papertrail gives users real-time visibility into the log data of AWS services. Some Amazon services will send logs directly to Papertrail instead of CloudWatch, while other logs can be forwarded instead.
Once the logs are within Papertrail, you can use all its log search, live tail, and analytics features. For instance, the automated log data scanning functionality can save you time, helping identify trends, so you can prevent potential application faults.
Papertrail offers an instant AWS alerting system, which can integrate with external services like Slack, Campfire, PagerDuty, email, and customized HTTP webhooks. Admins can create customized alerts according to specific conditions and save new alerts for later use.
3. SolarWinds Server & Application Monitor
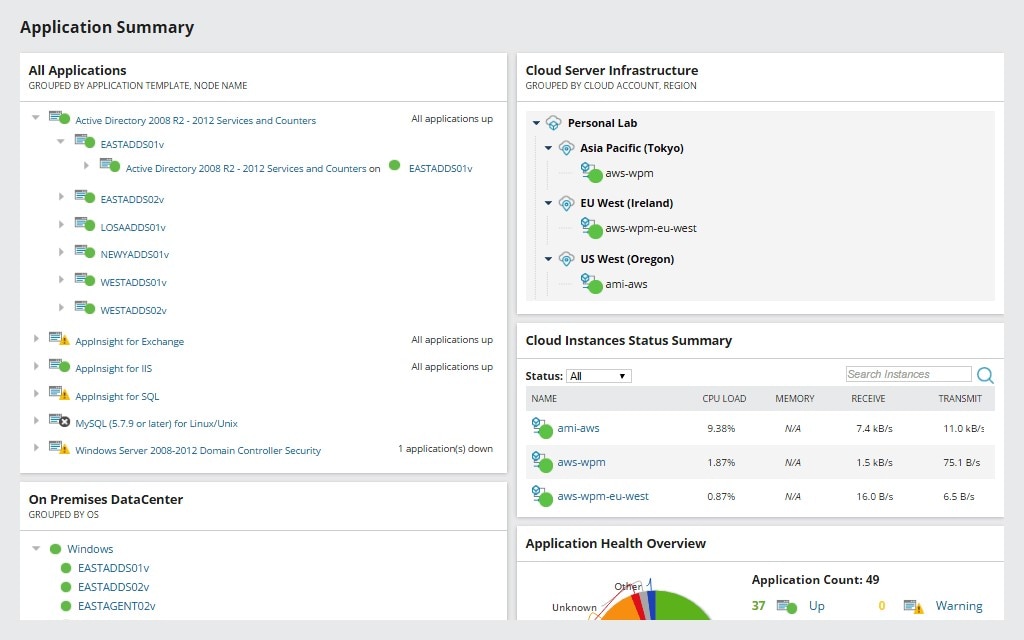
For AWS monitoring, SolarWinds offers two strong products with easy setup and high scalability. SolarWinds Server & Application Monitor (SAM) is hard to beat for its broad array of services packaged in an intuitive, user-friendly interface.
For busy IT admins, SAM offers over 1,200 preset templates to help you keep track of server and application metrics. There are SAM templates to address AWS monitoring, and others to address nearly any cloud environment. Moreover, you can customize SAM’s user templates, if you’re looking for a specific interface. This is just one example of the user-friendly approach employed in the SolarWinds application monitoring model.
SAM allows you to visualize metrics from a single dashboard. SolarWinds recognizes AWS has become a standard for virtual computing, so your SAM dashboard can be easily specialized for many different AWS ecosystems. From a single access point, you manage metrics straight from CloudWatch, alongside customizable Amazon EC2 monitoring tools. To allow for flexibility, any of your nodes can be added or deleted at any time through SAM’s interactive dashboard.
Another advantage of SAM is its wide array of metrics and fast-acting cloud discovery. The tool allows you to poll your entire AWS environment for your most important metrics—whether it’s RAM, EBS volumes, historical cloud data, or application dependencies.
Any good AWS monitoring tool gives you the ability to analyze and visualize the application data CloudWatch collects. SAM provides a customizable alert system to tell you when its analysis has detected something fishy, based on your own thresholds. When it’s time to troubleshoot your cloud capacity issues, the tool’s data analytics help you at each step of the way.
Server & Application Monitor is a closed-source tool offering a 30-day free trial.
4. Database Performance Monitor
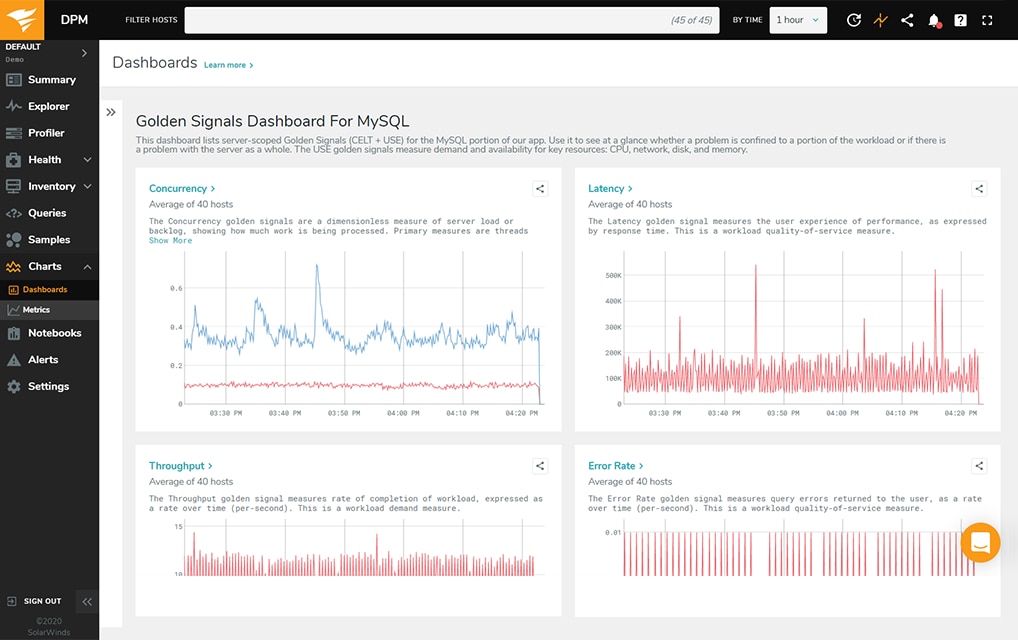
SolarWinds Database Performance Monitor (DPM) is a SaaS monitoring solution focusing mostly on open-source and NoSQL databases, such as PostgreSQL, MongoDB, and Redis. Besides those, DPM also targets AWS by supporting its relational database Amazon Aurora.
DPM offers cloud-based monitoring, which has a lot of advantages. For starters, the usage is tremendously simplified. There’s no need to buy, provision, or maintain anything. Since it’s a service, DPM is updated and upgraded all the time. There are no costly and risky upgraded procedures for you to get new features: you just get them, automatically.
What about its features?
One of the greatest features of DPM is its highly intuitive dashboard with many metrics, which users can then zoom in on and drill down to see specific values. There are thousands of metrics DPM can keep track of, including mean time to detection (MTTD), mean time to resolution (MTTR), deploy frequency, availability, and reduced failed deploys.
Security is a top priority in technology, and DPM doesn’t disappoint here either: it comes with built-in SOC2 and GDPR compliance and more top-notch security features.
5. SolarWinds Database Performance Analyzer
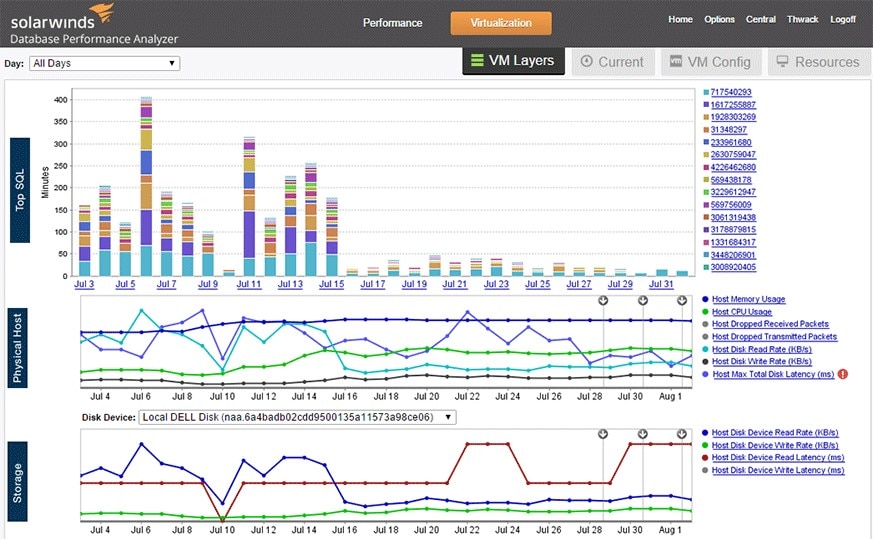
SolarWinds Database Performance Analyzer (DPA) comes equipped with all the user-friendly benefits of SolarWinds closed source tools: a fast and easy setup, a high-grade customer service infrastructure, and user-friendly templates and graphics.
DPA specifically focuses on log data for different private and cloud-based databases. With this tool, SolarWinds makes use of multidimensional performance analysis to help you connect the dots of your data log anomalies. In terms of security and functionality, monitoring your AWS data log can help you detect and analyze log issues for speedy, successful troubleshooting.
A major upside to DPA is its agentless polling architecture, as agentless discovery means you can get straight to monitoring without worrying about what you missed. Polling with DPA can detect EC2 instances, virtual nodes, and physical machines. This allows you to use DPA for data monitoring for any of your AWS needs and beyond. With DPA, you can discover and monitor AWS instances with a high degree of scalability, expanding or contracting your polling nodes without hassle.
The main reason to monitor AWS metrics is to detect capacity issues possibly affecting performance. Amazon EC2 is the aspect of your AWS suite responsible for capacity; therefore, any good AWS monitoring system will have the ability to discover EC2 instances and troubleshoot data logs for capacity issues. SolarWinds DPA includes Amazon EC2 monitoring tools and provides automated data log analysis for a wide variety of non-Amazon databases, from MySQL to Oracle, DB2, Sybase, and others.
Database analytics from DPA can measure wait types and provide customized alerts for rapid troubleshooting. DPA also offers evidence-based recommendations on query blocks, tuning, and other metrics, to help you troubleshoot your AWS data logs step by step.
Database Performance Analyzer is a closed source tool offering a 14-day free trial.
6. Paessler PRTG Network Monitor
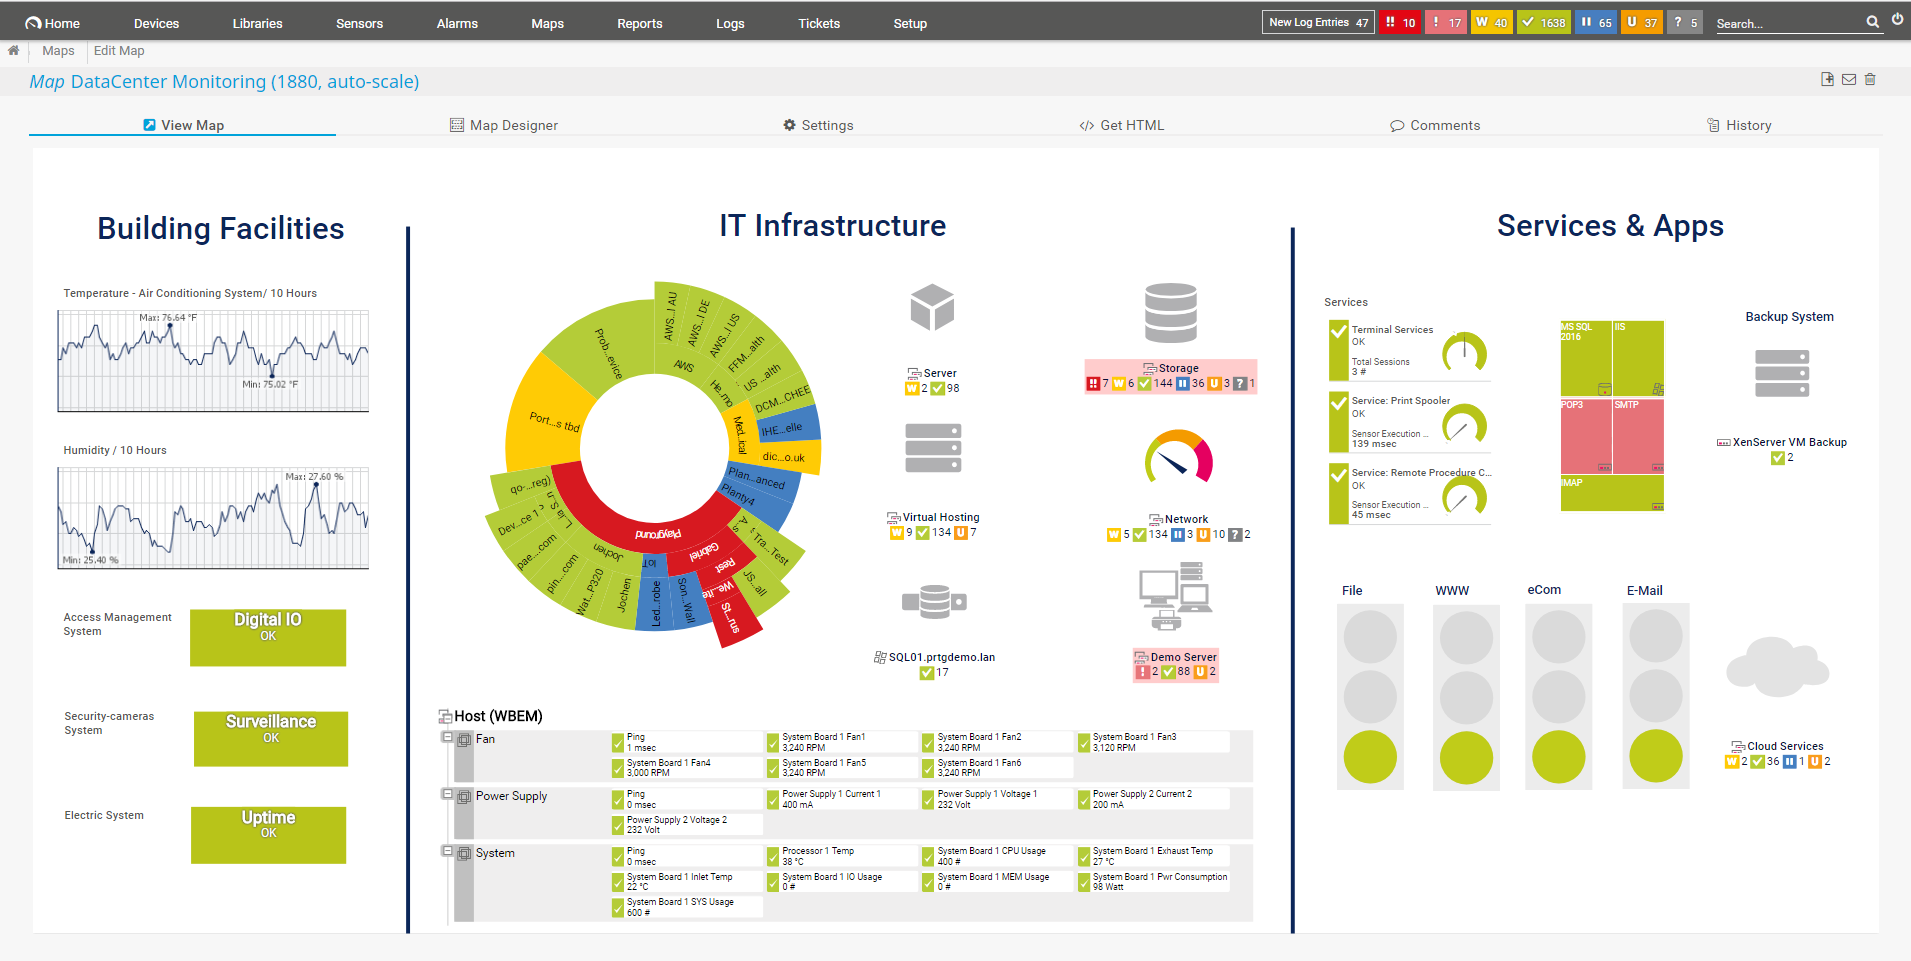
Paessler is a German software management company and has quickly become a well-known name in network monitoring. Its PRTG Network Monitor is based on a flexible number of sensors, each with a specific monitoring goal. Like SolarWinds DPA, PRTG Network Monitor is an agentless monitoring tool, which means individual applications can be readily discovered without additional installations. This makes it easy to expand to each of your necessary nodes. PRTG Network Monitor offers over 200 sensors for purchase in small or large packages, providing a viable solution for small businesses and enterprise networks alike.
For each component of your AWS infrastructure, PRTG Network Monitor offers a wide variety of useful sensor options to visually display graphical analysis of your Amazon application functions. Like other AWS monitoring tools, it integrates with CloudWatch to expand your existing AWS metrics and help speed up troubleshooting. Because it offers several CloudWatch-specific sensors in addition to plenty of other network monitoring sensors, PRTG is a strong option for any SysAdmin looking to integrate AWS monitoring into a broader network monitoring scheme.
PRTG’s AWS sensors offer live analysis with a helpful visual component. The easy-to-use dashboard includes graphs and data charts, as well as Paessler’s signature color-coded dials, which help you to visualize your virtual metrics in relation to their maximum or minimum values. You can set up a range of dials on your dashboard to help you keep track of storage, memory, load, and other important factors affecting your cloud performance.
PRTG Network Monitor is a closed-source tool offering a 30-day free trial.
7. ManageEngine Applications Manager
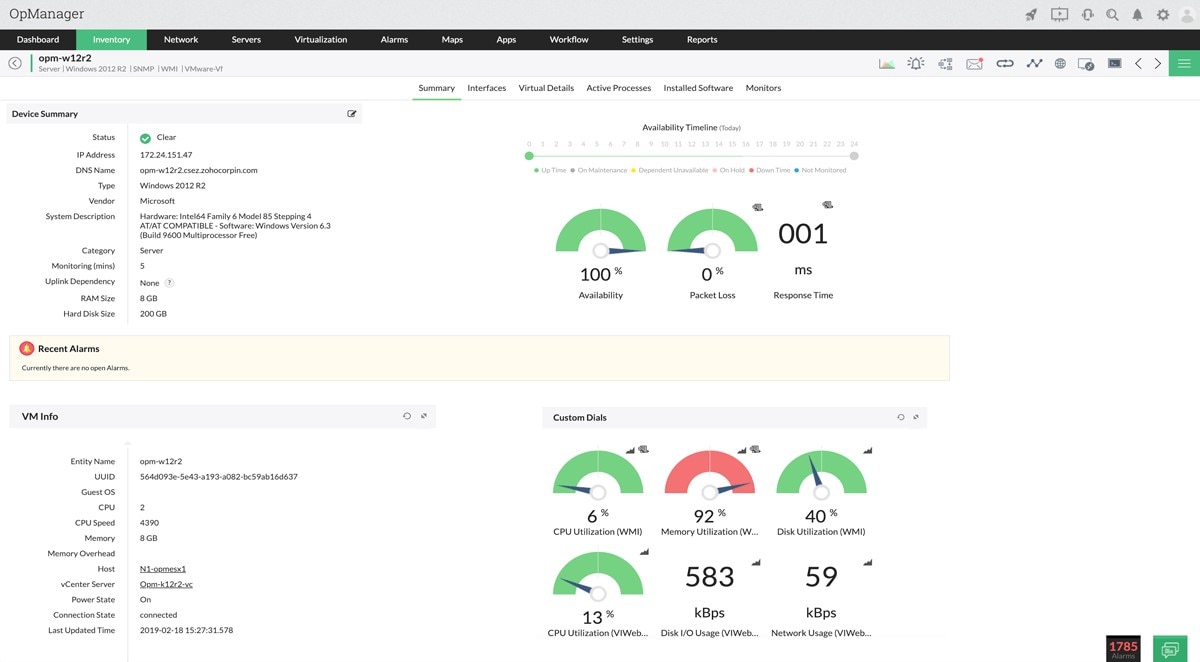
ManageEngine Applications Manager is designed to monitor virtual infrastructure, with a focus on application health and database functions. With its holistic approach to applications management, Applications Manager can be easily integrated with AWS, in addition to a range of other applications in a larger virtual infrastructure.
ManageEngine offers reliable monitoring tools for each critical aspect of your AWS infrastructure, including Amazon EC2 instances, EBS volumes, traffic metrics, and virtual capacity statistics. With color-coded graphs and alerts triggered when metrics pass unhealthy thresholds, Applications Manager serves as a robust monitoring tool for all your major cloud components.
Even though Applications Manager analyzes metrics for all the standard capacity components of an AWS environment, ManageEngine’s special area of strength is virtual database monitoring. You can use Applications Manager to keep track of Amazon RDS instances in addition to other AWS databases like DynamoDB and Aurora DB. The tool aims to make virtual database management a user-friendly process, with a helpful dashboard showing database instances and how they’re related. It also helps you detect atypical queries and expensive statements, KPIs, and latency metrics, with the aim of guiding you through database troubleshooting down to the code level.
ManageEngine Applications Manager is a closed-source tool offering a free demo version.
8. AppDynamics
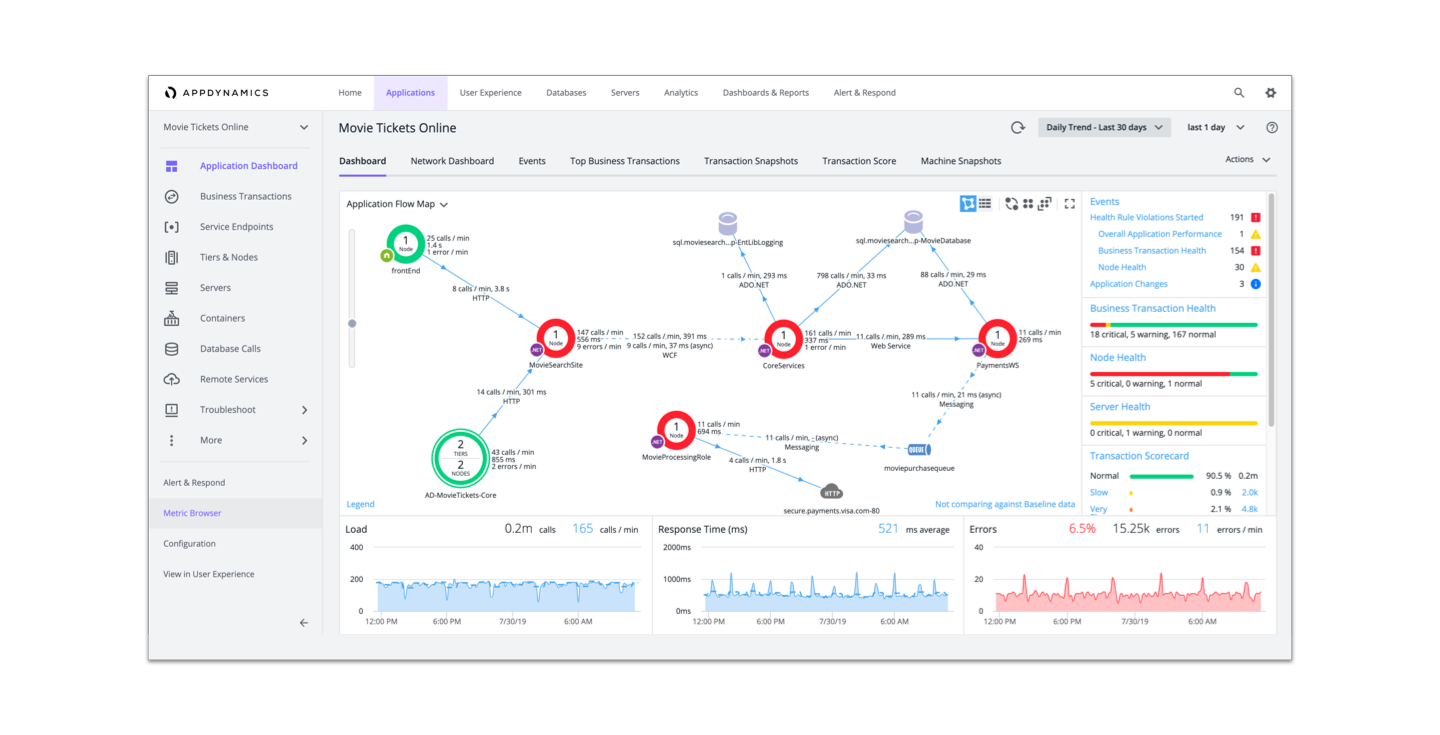
AppDynamics offers a strong AWS monitoring solution well known in IT management circles. The benefits of monitoring with AppDynamics include a wide range of application monitoring abilities and a high-tech, AI-based approach.
Because this tool offers full-stack visibility, you can gain insight into both your application infrastructure and the underlying metrics AWS applications depend on. All the components of a standard AWS environment can be accommodated with AppDynamics—you can monitor basic functions like Amazon ECS and newer applications in the AWS suite like Amazon Lambda and Amazon Fargate.
Like other tools on this list, AppDynamics offers major advantages to business owners wishing to reach an optimal profit margin with their AWS applications. AppDynamics takes the profit motive a step further—it allows you to monitor cost metrics, determine customer satisfaction, and even conduct business performance analysis using AWS metrics pulled from CloudWatch.
For optimal troubleshooting, AppDynamics uses AIOps technology to add precision to your automated data analytics. You can use the tool’s versatile interface to engage with flowcharts of AWS operations, allowing you to see the big picture. And by zooming in on smaller details, you can view and analyze AWS resources with the assistance of user-friendly graphics and color-coded diagrams. AppDynamics is a multipurpose and constantly improving tool, and it certainly earns its spot on this list.
AppDynamics by Cisco is a closed-source tool offering a 15-day free trial.
9. Nagios XI
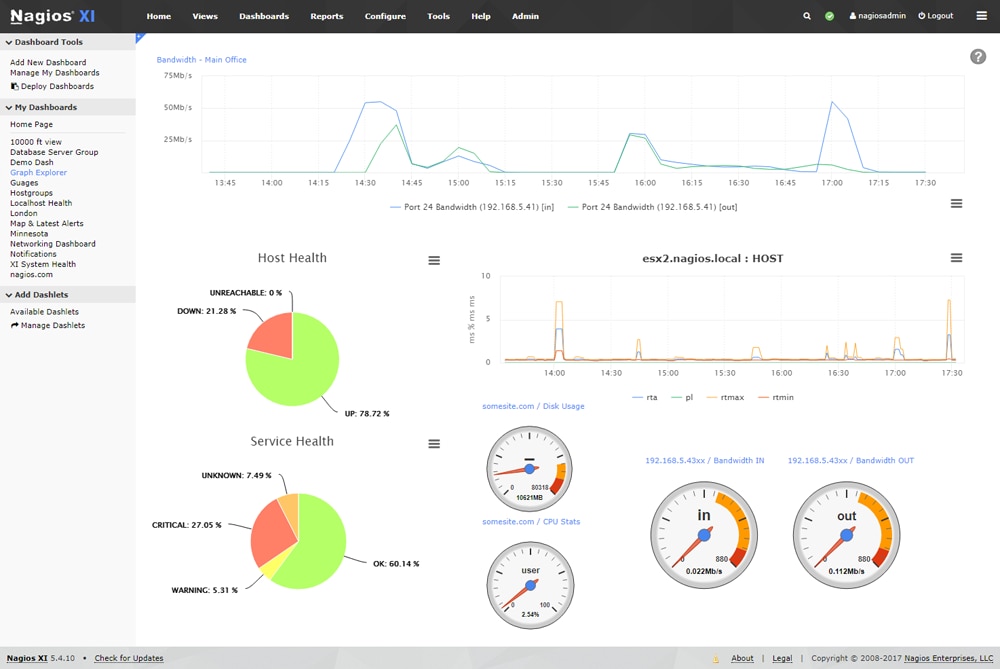
Nagios is an established brand in the network monitoring business—and for good reason. Nagios XI is a network monitoring tool with many functionalities, including application monitoring with AWS integration. Even though Nagios XI monitors much more than just AWS, it offers an in-depth set of AWS monitoring integrations to help maximize the efficiency of your AWS application suite.
The AWS monitoring services provided by Nagios XI aren’t as detailed as some of the other AWS-specific tools on this list, but a wide range of plugins allows AWS users to expand past the basic AWS functions preset in Nagios. The most basic version of Nagios XI comes with wizards for Amazon EC2 and Amazon S3, which allow you to monitor your AWS CPU, disk, packet metrics, latency, and other capacity and data log metrics.
With real-time graphical analysis, you can make sure your applications are running smoothly and gain insight into the performance of your most critical virtual components. AWS plugins with Nagios XI allow you to expand your monitoring to integrate with CloudWatch metrics, ECS components, and more. This range of plugins makes Nagios XI a highly flexible option.
Nagios XI is a closed-source tool offering a 60-day free trial.
10. StackPath Edge Delivery
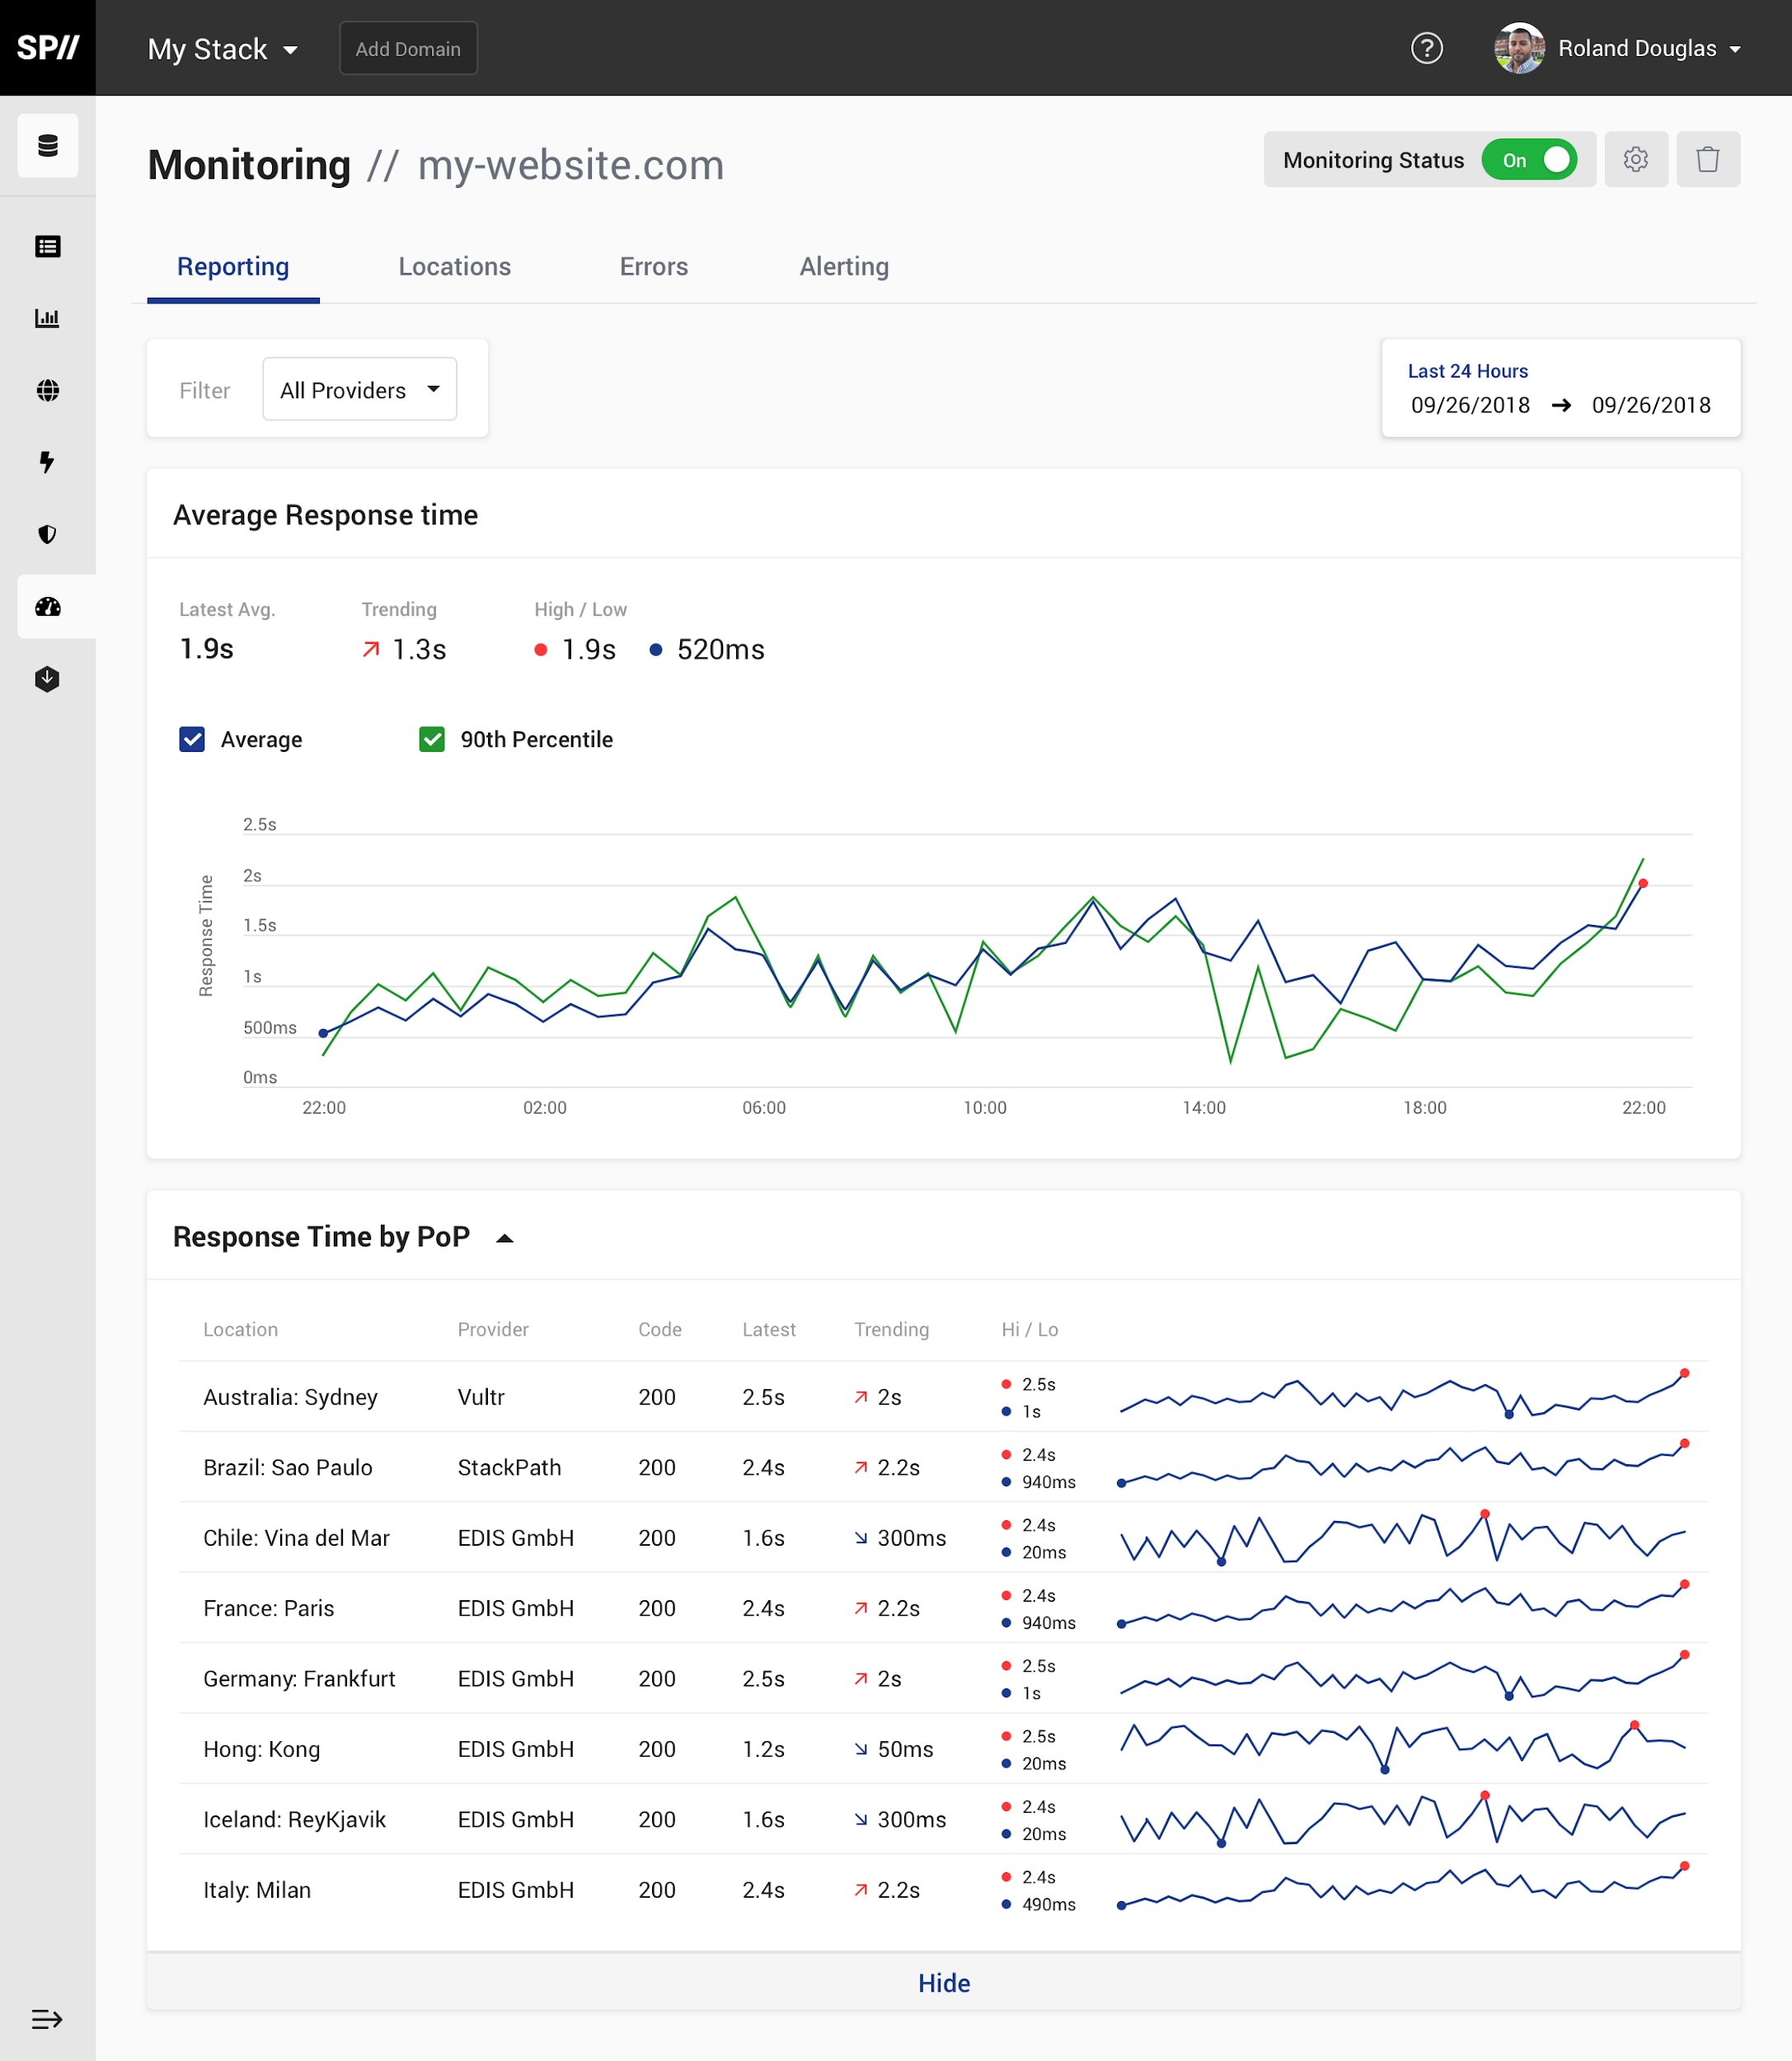
Edge Delivery from StackPath allows you to monitor a diverse array of cloud metrics with an easily scalable tool. StackPath is best known as a content delivery network (CDN), with a business-friendly focus on monitoring company web pages. Edge Delivery includes different AWS cloud monitoring tools for you to monitor your AWS application ecosystems and their user-end reliability.
In terms of AWS database and capacity metrics, Edge Delivery doesn’t focus squarely on minor AWS details like some of the other tools on this list. Edge Delivery uses RESTful API for a CDN-oriented application monitoring package. Since recently merging with Server Density, another high-profile application monitoring tool, StackPath has strengthened its application monitoring capacity. For businesses looking to monitor more than just AWS function, you can also use Edge Delivery for other CDN services, like URL protection and cache management.
StackPatch Edge Delivery is a closed-source tool, with different versions based on the size of your monitoring needs. Only the smallest version offers a one-month free trial. Some larger versions offer one free month after purchase.
Tips for Amazon Web Services Monitoring
Cloud computing is here to stay, and so are cloud service providers. Such services become more critical to IT operations with each passing year, and organizations around the world pour huge resources into them. So, it only makes sense they should be monitored. By staying on top of fundamental metrics and improving them over time, organizations can ensure their applications and services keep running with minimal interruption and great customer satisfaction.
In today’s post, we’ve presented a list of ten of the best AWS monitoring tools available. Every one of them has its merits. They might cater to different needs and distinct budgets. But if I had to pick one to recommend, it would certainly be SolarWinds AppOptics, since SolarWinds is a recognized partner within the AWS Partner Network, and that speaks volumes not only about the quality of their products but also the level of trust Amazon AWS themselves puts in their solutions.