
As the number of devices, services, and servers you use in your business grows, there’s an increasing need to monitor your systems. Server monitoring, specifically Ubuntu server monitoring, covers the capacity, health, and activity of the applications and hosts on your server. Ubuntu server monitoring processes are designed to address all computing resources, with the overall goal of rooting out and tackling problems in real time.
If you’re using Ubuntu, then Ubuntu server monitoring tools can help you identify any service failures or errors before they affect users. The most rudimentary tool at your disposal is called the System Monitor. This is a built-in utility for Linux resembling Windows Task Manager. It offers basic activity monitoring information, such as which activities are consuming the most resources and which activities are currently being run.
To achieve comprehensive Ubuntu server monitoring, it’s recommended you employ a professional and advanced Ubuntu server performance monitor.
By choosing the right Ubuntu server monitoring tools, you can potentially achieve an all-in-one solution to serve the following purposes:
- Ubuntu server system monitor
- Ubuntu server performance monitor
- Ubuntu server resource monitor
- Ubuntu server traffic monitor
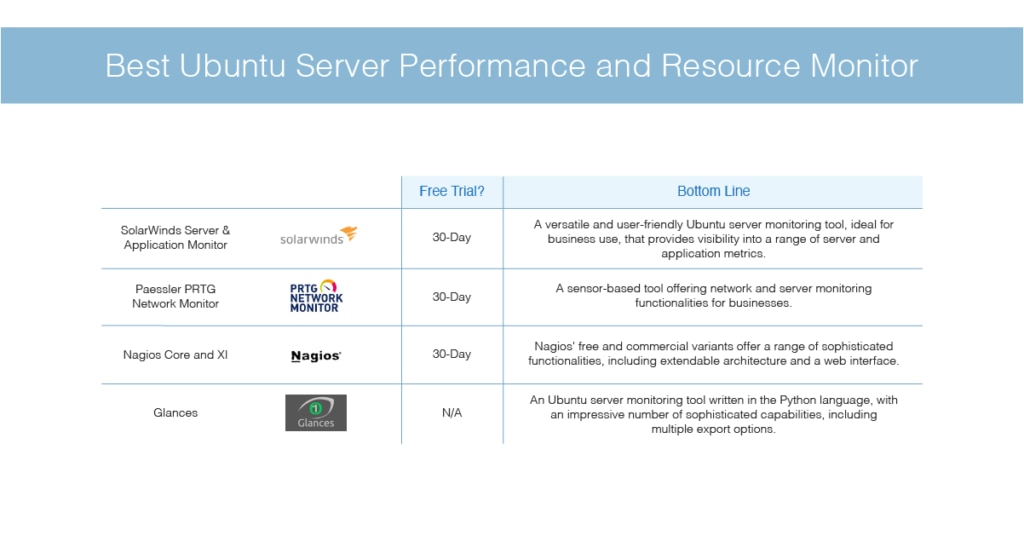
This article will provide a list of some of the best Ubuntu server monitoring tools, allowing you to monitor server system, performance, resource, and traffic metrics. Overall, SolarWinds® Server & Application Monitor (SAM) comes highly recommended. This tool offers an advanced range of features and is user-friendly.
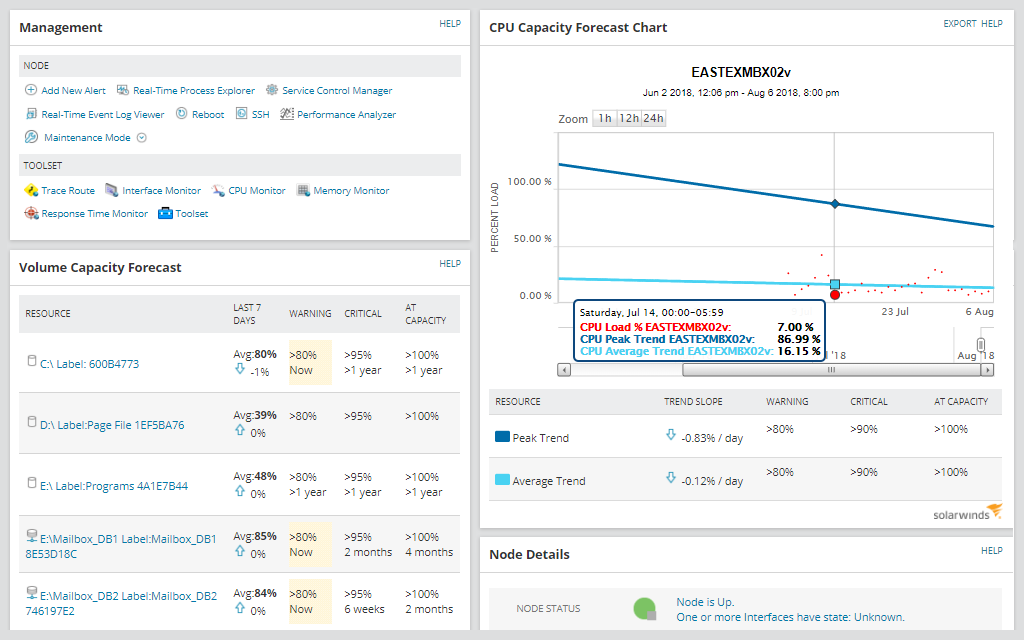
SolarWinds SAM is a comprehensive tool supporting multiple Linux distributions. This includes Red Hat Enterprise Linux monitoring, CentOS, SUSE Linux Enterprise Server, Ubuntu Server, Debian, Fedora, and more. With SAM, you can report, alert, and monitor on Linux server performance problems. You can rapidly detect if the Linux server is experiencing high response time, packet loss, or latency. You’re also able to monitor server processes in real time and identify runway or rogue processes potentially hogging resources. These processes can be terminated remotely.
SAM offers you access to numerous out-of-the-box templates allowing you to monitor the performance of enterprise applications. To save time, this tool automatically discovers Linux servers and applications, and applies built-in templates. This means you’re able to start monitoring in roughly an hour.
This tool lets you monitor databases, web servers, email servers, application servers, messaging servers, and much more. This is made possible by a host of protocols, which includes JMX, CIM, WMI, and SNMP.
SolarWinds SAM offers a huge range of highly sophisticated capabilities but remains user-friendly. A 30-day free trial is available.
Paessler PRTG Network Monitor is designed to deliver a stable, secure, and effective way of monitoring your Ubuntu system. This network monitoring tool is highly comprehensive and doubles as an Ubuntu server performance monitor. PRTG is sensor-based, with each sensor collecting a specific type of data giving you insight into one aspect of your network or server. PRTG features more than 200 sensors, the most common of which for Ubuntu and Linux monitoring include:
- The load average sensor, which monitors the load average of a system through SSH or SNMP
- The meminfo sensor, which monitors available RAM
- The disk free sensor, which checks for available hard disk space for Linux
- The SNMP traffic sensor, which uses SNMP to monitor the traffic of a device
- The WBEM Custom sensor, which performs custom queries via WBEM
PRTG can give you an overview of the status and performance of your Linux devices, in addition to detailed information and metrics which you can drill into to improve your understanding of the nuances of your Ubuntu server performance. This Ubuntu server performance monitor can be used to support resource planning, by providing you with the details of over-capacity and under-capacity instances.
This Ubuntu server resource monitor can monitor a range of devices on your server, including NTP, memory, and hard drives. It delivers instant notifications regarding all critical metrics, including bandwidth overload, so you’re always kept in the loop.
With a convenient tracking system to help you keep track of unusual incidents and analyze suspicious activity, this Ubuntu server monitoring tool is also considered one of the best on the market. It makes identifying critical weak points and imbalances easy, and offers detailed insight into data traffic structure, and a customizable dashboard. It’s easy to install and can be launched in a matter of minutes. A 30-day free trial is available.
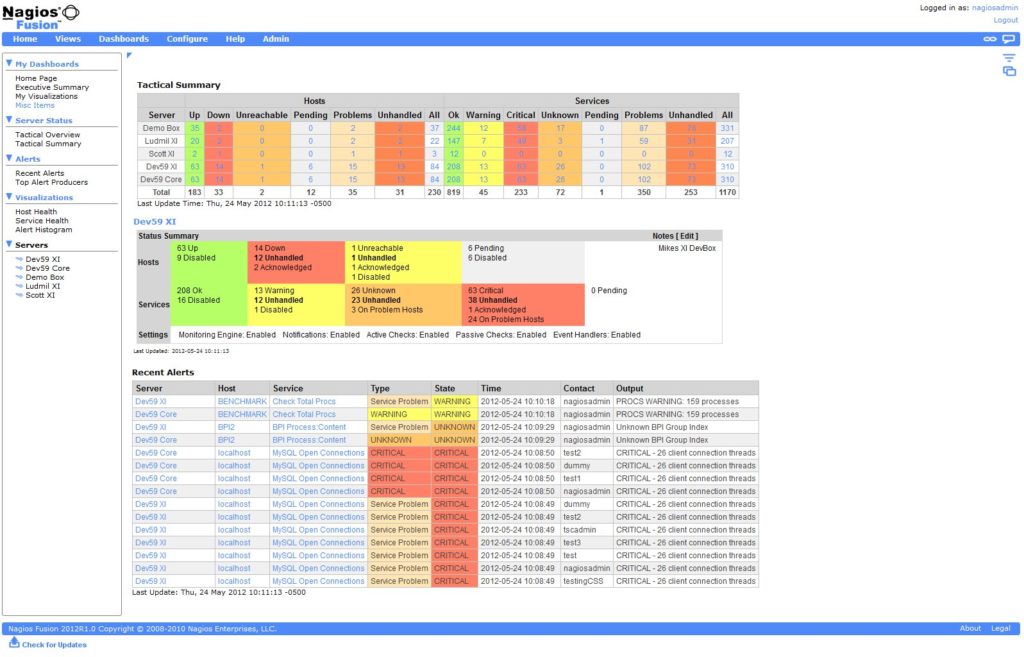
Nagios is a highly popular network monitoring and Linux/Ubuntu server monitoring solution. It’s a powerful, scalable, and customizable tool. The only fallback is, I believe it can be tricky to configure and is not as user-friendly as some other tools. Despite this, Nagios offers some notable advanced features, including rapid detection of protocol failures and outages, and increased availability of servers, applications, and services. Nagios has two system monitoring solutions—Nagios XI and Nagios Core.
Nagios Core is the open-source, free version of Nagios designed to monitor servers, services, and applications. Features include a basic user interface with a network map, the ability to conduct reporting by email and SMS, and simple reporting functionalities. Nagios Core is an Ubuntu server system monitor tracking all critical IT infrastructure components from system metrics, applications, servers, services, and network protocols. When these components fail and recover, you’re sent the relevant information in the form of alerts via email, SMS, or custom script.
Nagios Core reports provide a historical record of events, notifications, outages, and alert responses, so you can review them later. This Ubuntu server monitoring tool also features advanced graphs, which assist with planning for upgrades.
Nagios Core’s web interface, extendable architecture through integration with third-party or in-house applications, and multi-tenant capabilities make it a powerful Ubuntu server performance monitor. It’s worth noting, however, open-source tools aren’t recommended for business use. You can download Nagios Core here.
Nagios XI is the commercial variant of the Ubuntu server monitoring tool, offering a greater range of features. This includes automated configuration assistance. Nagios XI includes a powerful monitoring engine, called Nagios Core 4, which gives you more server performance monitoring capabilities. This tool lets you customize the design, layout, and preferences on a per-user basis. You can download Nagios XI here. A 30-day free trial is available.
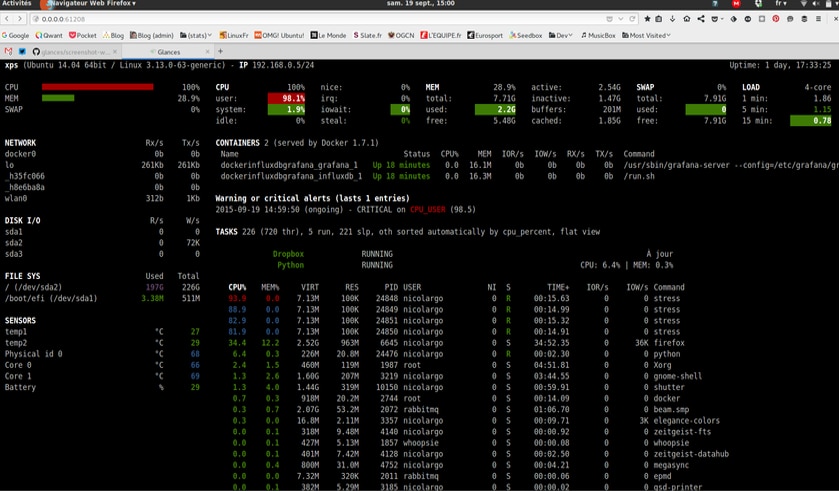
Glances is a cross-platform monitoring tool running on GNU/Linux, Windows, MacOS, and BSD operating systems. You can use Glances to monitor CPU, memory, load, file system space use, active processes, mounted devices, network interfaces, and much more.
Glances is a popular tool because it allows you to set thresholds in a configuration file, with four options representing logjam in the system. These options are represented by the colors green (for OK), blue (for Careful), violet (for Warning), and red (for Critical).
This tool includes an XML-RPC server and a RESTful JSON API, which can be used by other client software. It also features a built-in web user interface, allowing you to monitor your system from any device, and from anywhere.
Glances offers several export options, letting you export all system statistics to InfluxDB, OpenTSDB, ElasticSearch, RabbitMQ, CSV, StatsD, and Cassandra. This tool even features a dedicated Grafana dashboard.
Glances is written in Python, which means it’ll run on almost any platform. To prevent you from needing to install the Python dependencies directly onto your system to run Glances, this tool can be installed through Docker.
Because Glances gives you such comprehensive insight into server performance metrics, it uses a significant amount of CPU resources. You can download Glances here.
Choosing the Right Ubuntu Server Monitoring Tools
If you’re looking for a versatile, reliable, and user-friendly Ubuntu server monitoring solution, then SolarWinds SAM is highly recommended. This tool covers performance, traffic, and system monitoring, giving you comprehensive insight into your Ubuntu server. The user interface is dynamic and easy to navigate and getting started with the tool requires minimal training or experience. SAM is ideal for business use and has been designed to scale with your company as it grows. A 30-day free trial of SAM is available here.
*As of May 14, 2020