
When it comes to creating and deploying web applications and platforms, Java is one of the most widely-used programming languages. Although Java is based on C and C++ syntax, developers use it because it allows them to adopt and deploy their code to nearly any platform or machine, regardless of operating system or architecture.
Because of its ease of use, Java has become ubiquitous for web application development. As such, it’s important for developers and IT managers to implement reliable Java performance monitoring practices if they wish to maintain high performance standards for their organization’s critical web applications. To accomplish this goal, it’s important to monitor the right elements and choose the right tools for effective Java performance tuning. Here’s a list of our most recommended Java performance monitoring and optimization tools.
-
- Java Application Performance Management: SolarWinds AppOptics
- Java Server & Application Performance Monitor: SolarWinds Server & Application Monitor (On-Premises)
- Java Log Management and Analysis: SolarWinds Loggly
- Java Heap Analyzer: The Eclipse Memory Analyzer
- Web Tracer: LightStep
- Web Profilers: EJ Technologies JProfiler
- JMX Monitoring: Pingdom Server Monitor
- Real User Monitoring: Sematext Experience

1. Java Application Performance Management: SolarWinds AppOptics
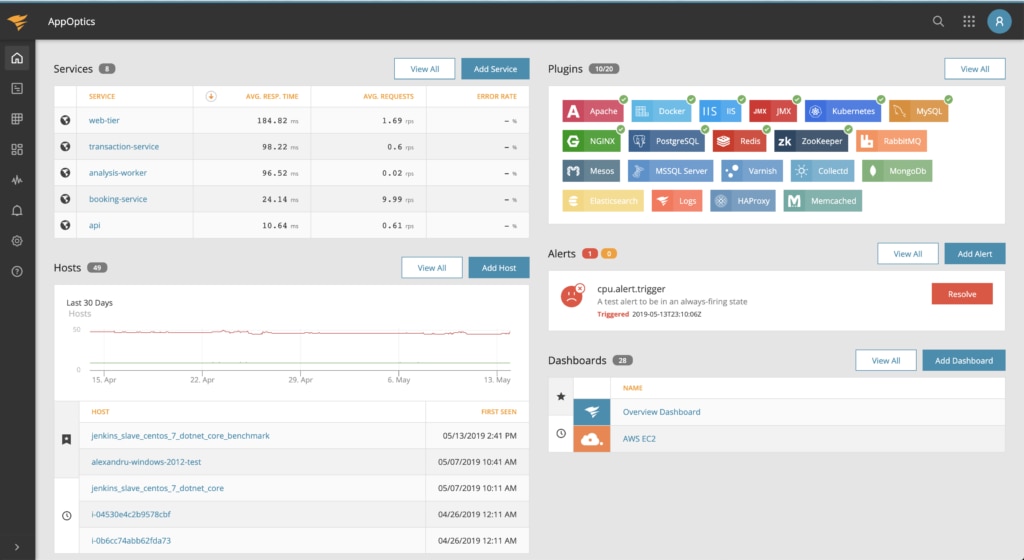
SolarWinds® AppOptics™ is a full-service infrastructure and application performance monitoring solution. It offers users distributed tracing, custom, and pre-configured alerts and metrics, and customizable dashboards. AppOptics also operates as a Java monitoring tool, enabling tech pros to analyze Java application performance all the way down to the code level.
AppOptics can also work as a Java performance tuner and help developers obtain end-to-end level insights into their Java infrastructure. This real-time information helps developers optimize their troubleshooting practices for any Java application. Java virtual machine (JVM) metrics mean developers can tune their applications by using granular insights into process availability, Java heap usage, active threads, and response times. Users can also collect performance metrics and in-depth transaction traces with the aid of built-in features for other different coding frameworks and libraries like .NET, PHP, Python, and more.
AppOptics’ Java performance monitor has an intuitive user interface that comes with open integrations for Snap and Telegraf ecosystems. Users can also add custom and pre-configured plug-ins or create their own, allowing for increased flexibility when monitoring Java web apps.
2. Java Server & Application Performance Monitor: SolarWinds Server & Application Monitor (On-Premises)
SolarWinds Server & Application Monitor (SAM) is designed to help you proactively monitor on-premises Java servers and optimize Java application performance. With SAM, you get the tools you need to more easily identify and act on performance-related issues affecting Java applications.
With SAM, real-time alerts let you troubleshoot issues before they escalate into larger problems. Using custom and built-in alerts, which can be configured to report issues across important metrics, developers can be notified about problems in production. With the option to run pre-made reports or create customized reports, SAM allows you to seamlessly run necessary reports to help you sustain Java monitoring best practices.
SAM evaluates critical Java application server metrics across memory, application, concurrency, and database. Memory metrics include garbage collections, memory heap size, heap used, and non-heap used. Application data such as compiler time and runtime uptime is also available with SAM. Concurrency metrics are tabulated according to blocked time, blocked count, threads started count, wait time, and wait count. Database metrics, meanwhile, account for classes loaded, unloaded, and total loaded count.
SAM provides a single, user-friendly interface for you to monitor multi-vendor Java applications. SAM’s Java monitoring tools rely on SNMP and JMX protocols that help you proactively monitor application servers such as WebSphere, JBoss, Oracle, WebLogics, and Tomcat. With over 1,200 embedded monitoring templates, as well as template customization tools, SAM allows users to monitor JVMs across different servers and vendors.
SAM also is built to carry out heterogeneous physical and virtual Java server monitoring. Infrastructure breakdowns serve as one of the leading causes for suboptimal Java application performance. SAM offers insights into JVM health, both virtual and physical servers, as well as the availability and performance of operating systems—including Linux, Windows, UNIX, Solaris, and AIX. Gain visibility into key hardware metrics such as temperature, fan speed, and power supply.
SAM also can effectively detect any web service APIs that may be adversely affecting Java applications. SAM’s Java web app performance monitoring tool helps you monitor and understand SOAP/JSON protocols, latency, and availability, and validate the returned content. Using out-of-the-box HTTP/HTTPS component monitors, SAM provides a complete picture regarding the health of JSON services operating across your servers. The HTTP/HTTPS user experience monitors mean you can monitor, POST, PUT, GET, and DELETE methods being run.
3. Java Log Management and Analysis: SolarWinds Loggly
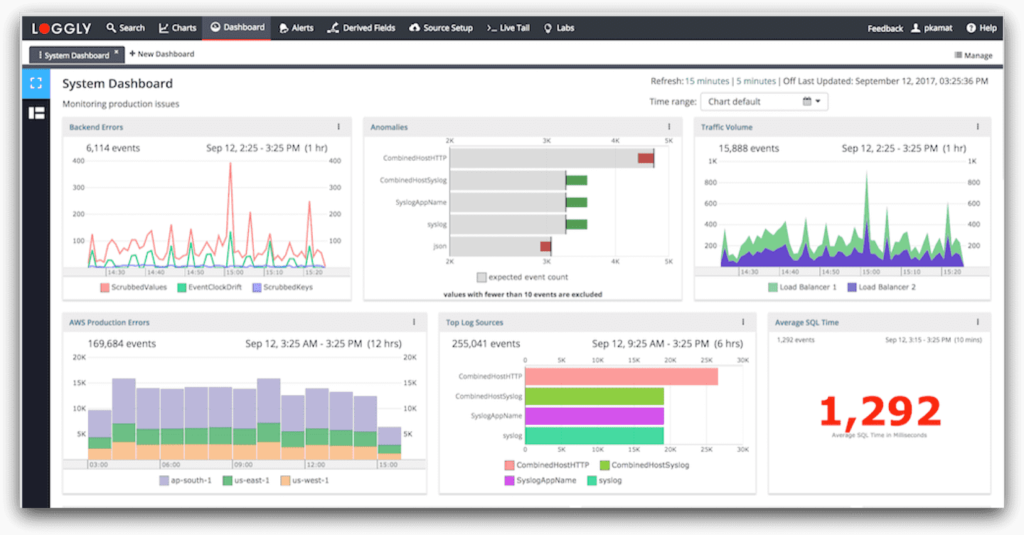
SolarWinds Loggly® is a cloud-based log management service designed to speed and improve the Java logging process. With Loggly, developers can consolidate logs from their different web applications and analyze them alongside infrastructure or network logs, all on the same UI. Loggly hosts all log data on a single dashboard, which comes with pre-configured charts and graphs to add detail to your Java logging overview.
Once Loggly collects, parses, and centralizes all the log data from Java applications, users can analyze such data with the help of automated log analysis tools. For example, Loggly helps enable users to parse partial and multi-line stack traces automatically, making it easy to search for specific logs across all Java web applications. With better querying capabilities, users can more quickly turn silos of raw Java data into actionable information.
4. Java Heap Analyzer: The Eclipse Memory Analyzer
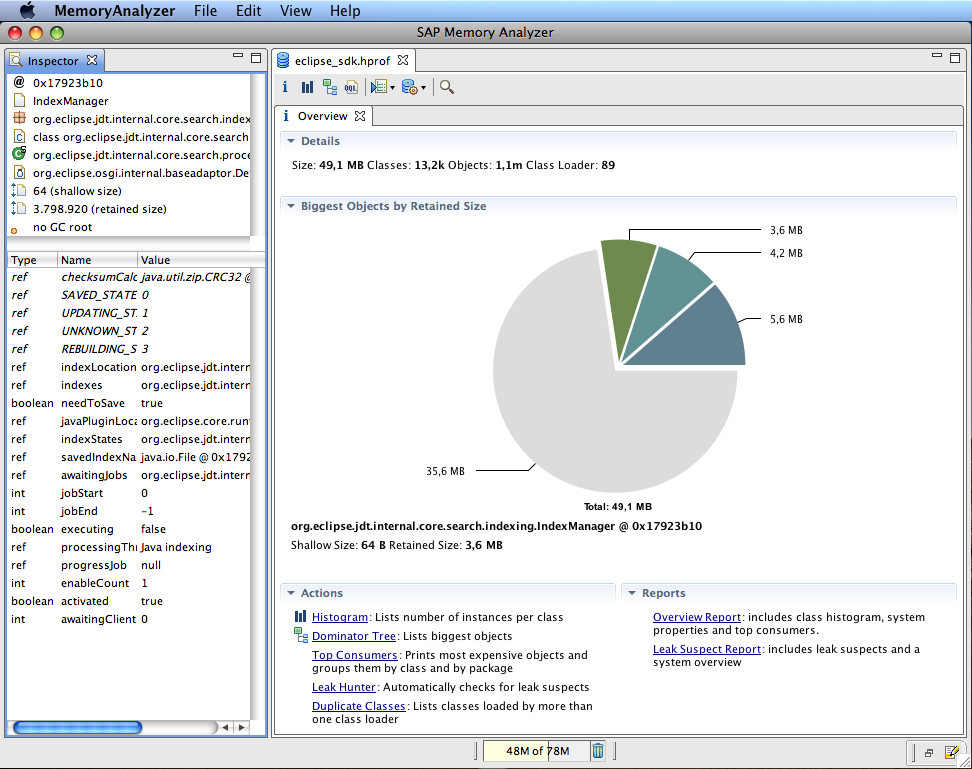
One of the most important metrics to monitor on a Java-based system is memory—by keeping tabs on your Java heap usage. Essentially, all Java objects are stored in an area called the heap. When an application runs, the heap’s storage will fluctuate in size. If the heap becomes full, objects are discarded to make room. But if your heap isn’t running smoothly, you risk having bottlenecks in your web applications.
The Eclipse Memory Analyzer is a full-stack Java heap analyzer specifically designed to help developers allocate memory consumption and set policies. Developers can use the Memory Analyzer tool to analyze heap dumps, even when millions of objects are passing through. They can also calculate the retained sizes of objects to help ensure the garbage collector is collecting the right objects from the heap. IT teams can also generate ad hoc reports to extract leak suspects.
5. Web Tracer: LightStep
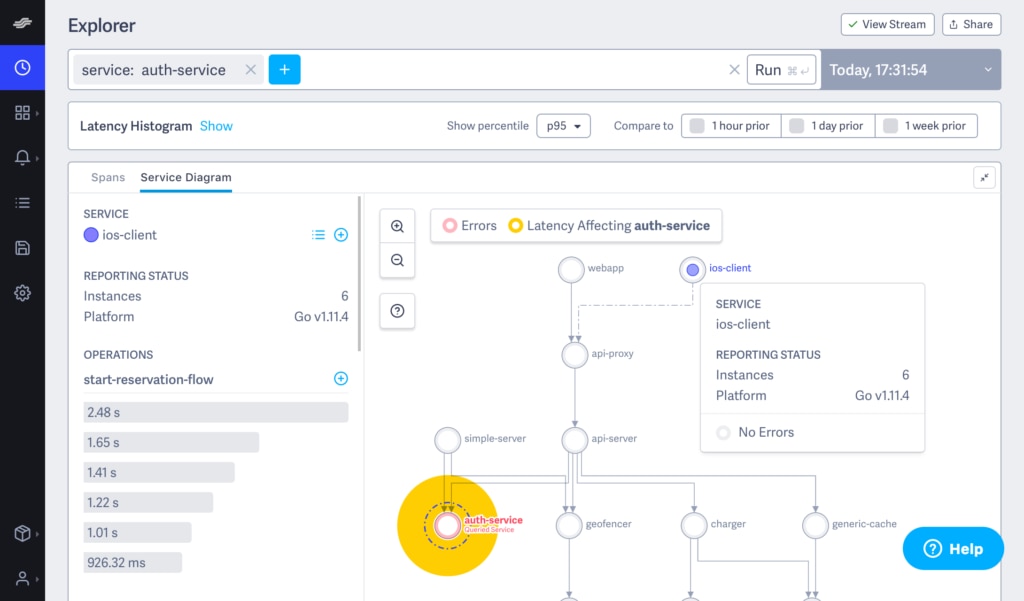
Web tracing is an important practice for IT teams who want to record and analyze information about a web application’s performance. But manual tracing can be tedious—developers have to inspect hundreds of packets, identify the protocols being used, and track down hundreds of IP addresses to gain a holistic understanding of how a Java-based web application is faring.
LightStep is a full-service trace viewer able to make things a bit easier by automating parts of the above process. With LightStep, developers can create custom system diagrams around services and tags, and share snapshots that collect and analyze thousands of related traces. Plus, LightStep can easily integrate into hundreds of projects or Java-based web applications.
6. Web Profilers: EJ Technologies JProfiler
Developers need to do more than just write functional code. An organization might want to know other things, like general performance metrics, how much memory is being used by a web application, or how concurrent executions affect a network. As such, developers will utilize profilers to gain these insights. For Java-based code, it’s wise to use a Java profiler to monitor constructs and the JVM level.
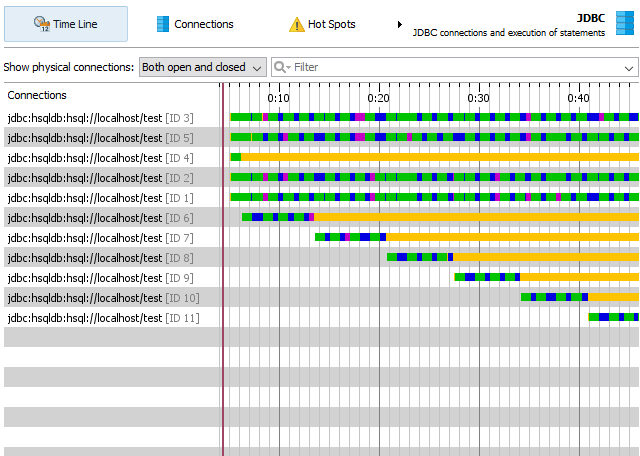
EJ Technologies’ JProfiler is a Java profiler tool that enables users to more quickly resolve performance bottlenecks, identify memory leaks, and obtain a better understanding of any threading issues. With JProfiler’s heap walker, developers can use a UI to view a set of objects from five different angles for better inspection. This allows them to solve memory problems more efficiently.
7. JMX Monitoring: Pingdom Server Monitor
When it comes to Java log management and analysis, many developers turn to the JMX console, which provides information about the health and resources of a JVM. JMX monitoring relies on real-time querying to gain information from the MBeans (Managed Beans) within the JMX console. This is another process that must be automated to be performed efficiently.
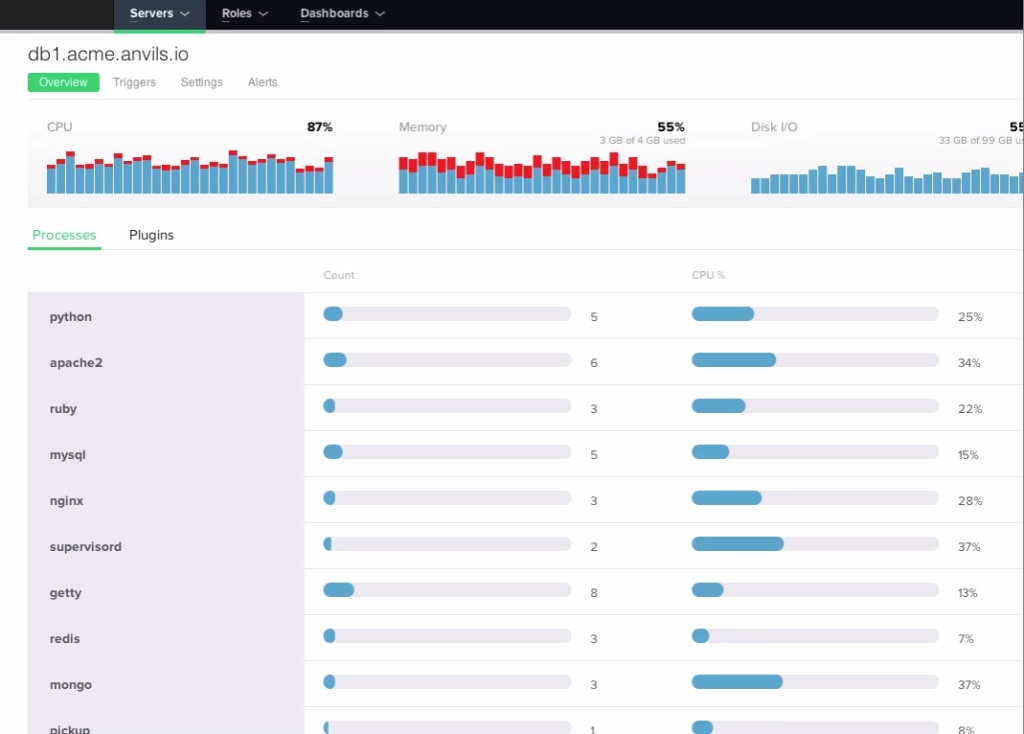
As a flexible monitoring tool, Pingdom Server Monitor collects key metrics from across a wide range of devices and services, including the JMX console. Users can add a JMX monitoring plugin that reports JMX values, including heap and non-heap memory usage and set the tool to monitor other Java metrics as well. Pingdom allows for a lightweight install, so there are no complicated configurations to get started. What’s more, users benefit from custom alerts that help flag potential Java issues.
8. Real User Monitoring: Sematext Experience
Sematext Experience is a monitoring tool built to analyze data from real user sessions. Sematext Experience is designed to diagnose anomalies and provide alerts in real-time, so your webpage and web app can always be firing on all cylinders. With key insights, Sematext Experience allows you to enhance front-end performance.
Real user monitoring differs from Sematext synthetic monitoring capabilities because it inspects page-level specifics and individual user sessions. By maintaining 100% visibility into the areas that might be affecting UX, Sematext Experience also helps minimize performance-related problems. Sematext Experience also connects Business Operations and Development Operations teams, providing real-time metrics to manage and further the customer experience. It sends alerts in real-time when it detects a bug that may adversely affect user satisfaction or performance. It can track HTTP requests, page loads, UI interactions, and resources, too.
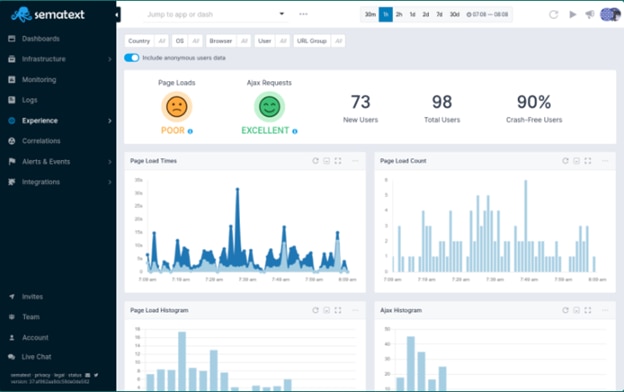
One of the tool’s main purposes is to identify slow-loading pages. The full resource waterfall shows the assets slowing down pages at any given time and includes a comprehensive load time analysis. You can inspect and analyze resources, including JavaScript files, stylesheets, fonts, and images, according to associated load times. User activity monitoring means every page-load event becomes captured and displayed within visualized charts, providing you greater insight into the time spent in the browser and on the back end. This software also helps you dig deeper into filterable data across browser type, URL, version, geolocation, and operating system.
Real user measurement drives support for single-page applications since you can keep monitoring the resource usage and page performance of your single-page applications. Sematext Experience also is designed to monitor Apdex Scores, so you can sustain high user satisfaction. In real time, you can detect performance bottlenecks by assessing the page load speeds of your web app or website.
Another core function of Sematext Experience tool is its ability to map out business journeys in real time. This enables you to retract real user journeys from beginning to end—providing you a view into where and why users might have encountered performance-related issues like slow page loads or errors.
Sematext Experience serves as a one-stop-shop for you to combine and harness the power of logs, metrics, and real user monitoring under one centralized and visual roof. Real-time data analysis helps you to proactively troubleshoot performance issues and diagnose their potential business impact.