The central processing unit (CPU) is the core component of any device on a network, and it has the potential to dramatically affect the performance and stability of the network. When it comes to network management, effective CPU usage monitoring could be the difference between network stability and network performance deterioration. A powerful and dependable CPU monitor is fundamental to every system administrator’s toolkit.
To help you choose among the many tools on the market, I’ve tried out and put together a list of the best CPU monitoring software. I found Network Performance Monitor rates most highly as a program to monitor CPU usage, with Engineer’s Toolset™ coming in at a close second. Read my CPU monitor tool review below to learn why.
How to Use CPU Metrics to Monitor Network Performance
IT administrators have a wide range of options for monitoring the performance of their networks and connected devices. Because of the central role of the CPU in any device, CPU monitoring is an incredibly effective approach to keeping a network functioning optimally.
The processing power of the devices on your network will define the capacity of the network itself. Processing power depends on several CPU metrics, including but not limited to:
- CPU load
- CPU speed
- CPU socket
- Idle time
- User time
- Processor time
- Drive size
A good CPU usage monitor will analyze these metrics, allowing you to identify how well a device is performing and how its performance might be affecting your network.
CPU Monitoring Tools Reviews
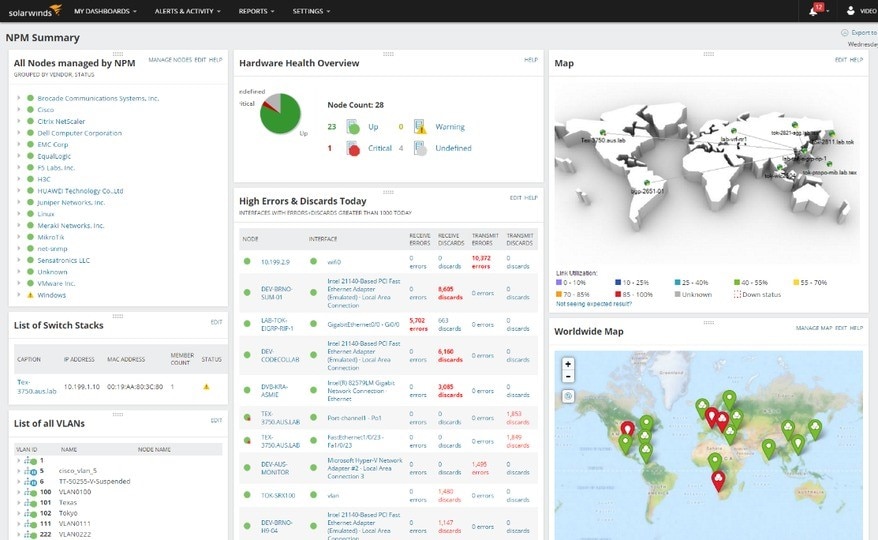
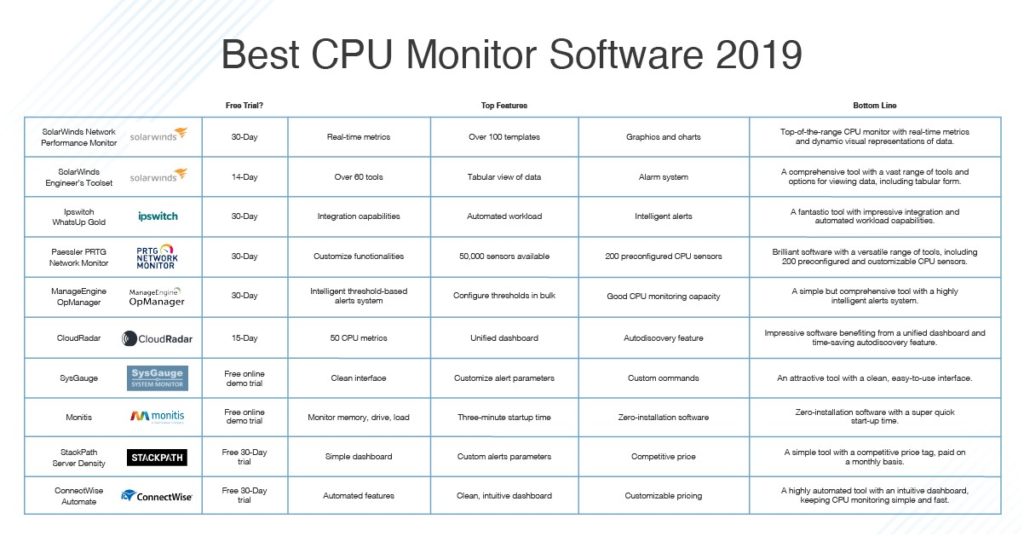
SolarWinds is known for its network monitoring tools being among the most reputable and leaders in the industry. The company lives up to its reputation once again with SolarWinds® Network Performance Monitor (NPM), a network performance monitoring software that also serves as a powerful Windows CPU monitor.
SolarWinds NPM has some fantastic wider network monitoring utilities, from hop-by-hop analysis along critical paths to cross-stack network data correlation. Though this guide focuses on determining the best CPU monitoring software on the market, a CPU usage monitor is at its most beneficial when it is harmonized with other key network monitoring functionalities. SolarWinds NPM stands out in this regard, as it offers an array of tools to complement its CPU monitoring capabilities.
NPM monitors, alerts, and reports on key CPU metrics, including utilization, load, temperature, and fan speed. Beyond this, the tool lets you customize performance and availability reports, scheduling and generating them with one of over 100 templates.
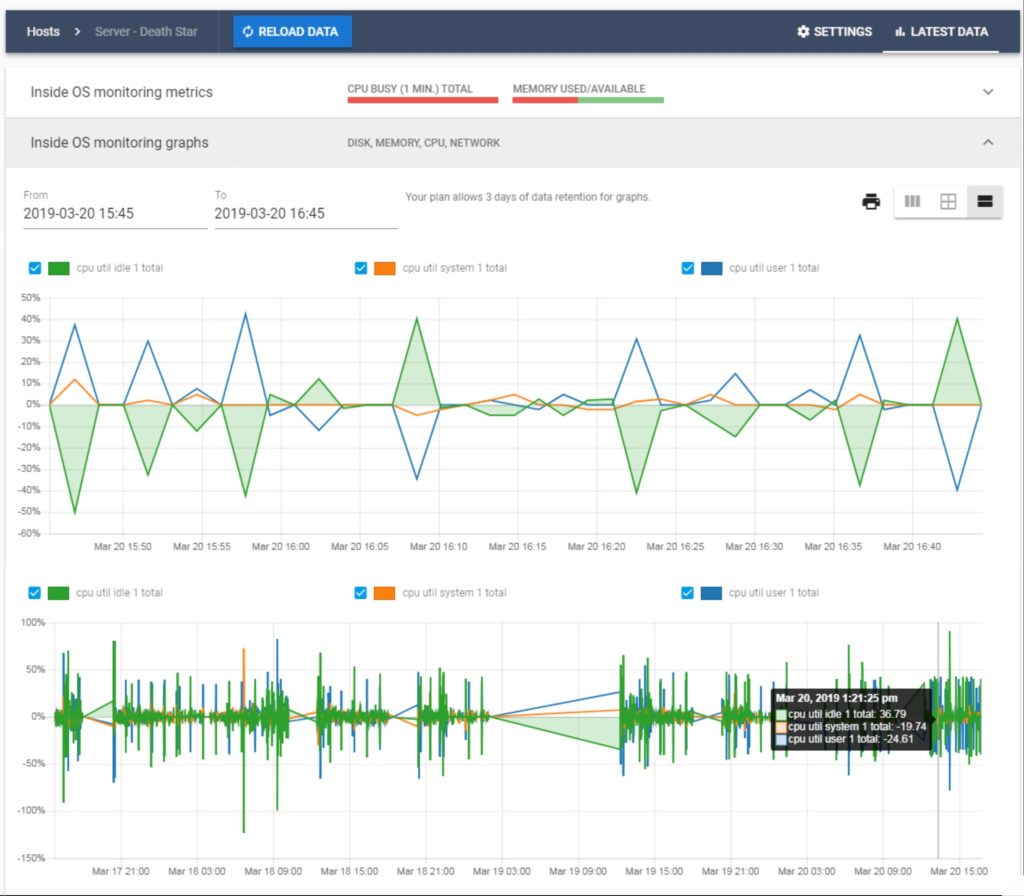
Where NPM most stands out in terms of CPU monitoring is in its capacity for delivering real-time metrics coupled with its graphic representation of data. Real-time metrics are accompanied by interactive charts and graphs, allowing you to view CPU usage data in a dynamic and visual way, with total and constant visibility. The Hardware Health Overview is another example of how SolarWinds cleverly uses visual representations to make data clear and accessible.
Regarding usability, I found the tool’s drag-and-drop function most interesting. This lets you assemble performance reports, observing either live or historical data, on your dashboard. The CPU load and memory utilization widget, which is one of many, can then be positioned front and center, according to your network performance monitoring priorities.
Overall, its high quality and wide-ranging capabilities make NPM the best CPU usage monitor on the market. See for yourself: the tool is available as a 30-day free trial.
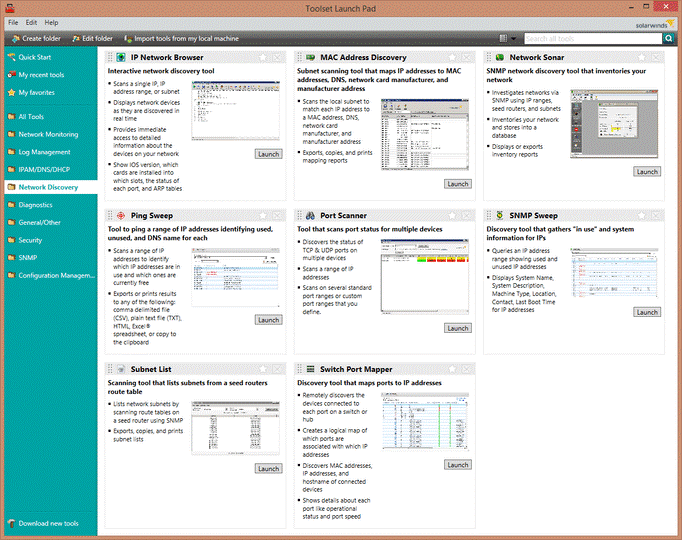
Another offering from SolarWinds, Engineer’s Toolset (ETS) combines over 60 of the most sought-after tools on the market for system administrators, covering DNS audits, MAC address scanning, memory monitoring, spam blacklist checking, traceroute, and response time monitoring.
For any informed reviewer, this raises the question of quality over quantity. Since SolarWinds ETS is so versatile, will the individual CPU tools live up to hype and expectation?
Put simply, yes.
Despite the vast array of utilities included in Engineer’s Toolset, I found the quality of the tools to be entirely undiluted. Its CPU monitoring offering is impressive, featuring a CPU Gauge, CPU Load Monitor, CPU Monitor, and Router CPU Load tool.
For the purpose of this article, I’ll focus on the ETS CPU Monitor. In addition to allowing you to monitor the current load against the maximum load, the tool stands apart from others through its visual representation of data. You can view your results in graphs designed to make a glut of numbers clear and digestible, and CPU and host statistics can be displayed in tabular form, organizing complex data so you don’t have to.
I valued this ability to view data in different ways, which can make data interpretation errors far less likely. Meanwhile, the graph representation of CPU load makes spotting viruses and faults less time-consuming. These visual representations have been designed to help users flag issues with little more than a cursory glance.
SolarWinds Engineer’s Toolset CPU Monitor is all about minimizing your workload. To this end, it features an alarm system to raise an alert if a threshold, defined by the user, has been reached. Thresholds can be established for CPU load, for example, and alert notifications can be delivered either by email or SMS, so you can stay on top of any changes and keep your network on track.
When combined with the other tools in Engineer’s Toolset, the functionality of the CPU Monitor is even more noteworthy. For example, ETS features an auto-discovery utility to detect connected network devices, complementing the CPU monitoring capabilities of Engineer’s Toolset: users can begin monitoring device performance—including memory utilization and CPU load—as soon as a device has been identified. This dramatically decreases the time wasted on continuous software configuration and updates.
To sum up, SolarWinds ETS more than holds its own as a CPU monitor and is a strong candidate for best program to monitor CPU usage on the market today. It’s simple and powerful and comes with a whole host of complementary tools developed to facilitate easy network monitoring. The icing on the cake is the 14-day free trial and ample support provided by the SolarWinds resource center and community.

WhatsUp Gold by Ipswitch is another tool with attractive CPU usage monitoring utilities. The thing I liked most about it was its seamless integration capabilities: the software features a robust REST API to facilitate easy integration with other systems and scripts, which means you don’t have to abandon your own. The suite of REST API calls lets you automate your workload by conducting basic data extraction from WhatsUp Gold or by transferring data from an alternate script or system. These integration mechanisms have been devised to assist users in simply and quickly extracting data for use by another system.
This integration capacity makes WhatsUp Gold a solid CPU monitor, but in my view, it lacks the range of capabilities to make it a top contender; its CPU monitoring functionalities are more like a side dish than a main course. Still, the array of features it offers—including highly intelligent alerts informed by topology-aware monitoring, an auto-discovery engine, and an interactive map view of the network—complement CPU monitoring and shouldn’t be overlooked. Indeed, the ability to view the minimum, maximum, and average CPU utilization of network devices is useful, as is the tool’s chart-view of data.
WhatsUp Gold is available as a free version, but this is limited to monitoring a maximum of five devices. If this isn’t enough to satisfy your network needs, you can upgrade to one of their priced packages, with each increase in cost corresponding to an increase in functionality.
 Next, we have the popular Paessler PRTG Network Monitor, which offers highly competitive and comprehensive CPU monitoring functionalities. PRTG offers a flexible network monitoring software in which users can customize functionalities according to the requirements of their system through sensor-based packages. Essentially, instead of purchasing a plan according to the number of network devices requiring monitoring, you purchase sensors. By personalizing your range of sensors, you can target whatever network monitoring components you want.
Paessler’s range of sensors is vast, with over 50,000 available, covering everything from ping sweeps and packet loss to sFlow and firewall monitoring. PRTG CPU Usage Monitor incorporates more than 200 preconfigured sensors. During the setup process, PRTG conducts a scan, which informs the automatic implementation of sensors aligned to your personal network needs. Sensors can also be customized according to user preference.
I’m a fan of the PRTG alerts system, particularly as it relates to CPU usage. If CPU utilization exceeds predefined thresholds, for example, you can be alerted by SMS or email. The main limitation of the PRTG software, and the reason it hasn’t ranked higher on this list, is the sensor-based price plan arrangement. While this offers flexibility, the relationship between price and monitoring capacity might encourage system administrators to skimp on range to save on cost.
PRTG is a Mac, Linux, and Windows CPU monitor. Its freeware version offers up to 100 sensors. A trial version is also available, reverting to freeware at the end of the trial period.
ManageEngine OpManager network monitoring software lends itself well to system administrators with their sights set on a CPU usage monitor. With this tool, you can monitor all the fundamentals of CPU metrics, including utilization, socket, speed, idle time, PSU redundancy, and processor time. This exceeds the basic CPU monitoring capacity offered by many other developers.
As I see it, the intelligent, threshold-based alerts system is the best feature of OpManager. It allows users to configure thresholds for each CPU metric, accompanied by a defined number of violations that triggers an alarm when exceeded. These alarms can be received via email or SMS to allow users to act on faults as quickly as possible. Moreover, the ability to configure these thresholds in bulk is a simple but time-saving utility.
Despite the notable benefits associated with this software, ManageEngine OpManager simply doesn’t match the capabilities of the CPU monitoring products ranked most highly in this guide. Still, it’s a solid Linux and Windows CPU monitor.
As a program to monitor CPU usage, CloudRadar holds its own among competitors. It covers all key CPU metrics, with more than 50 metrics displayed in a unified dashboard, providing a real-time overview. Like ManageEngine OpManager, CloudRadar has a threshold-based alerts system, and like SolarWinds NPM, it has an auto-discovery feature to gather performance data.
So, what sets CloudRadar apart from competitors? Primarily, its affordability and the effectiveness of its alerts system.
Let’s begin with affordability. CloudRadar offers pay-per-device monthly plans. I can see this being especially attractive to system administrators managing smaller networks, simply because you only pay for what you need. This could be cost-effective, depending on your specific network requirements, and such a transparent and simple price plan is intriguing.
The alerts system, on the other hand, is anything but simple—but its complexity isn’t necessarily a drawback. It defines thresholds for each device, with customizable alert rules per process, server, or service. On top of this, the system triple-checks all issues before alerts are triggered, to mitigate the possibility of false alerts. Perhaps most impressively, the CloudRadar alerts system can contact users through seven alerts channels, including Slack, Telegram, WhatsApp, Pushover, SMS, and webhooks.
Although CloudRadar has some distinctive features, it doesn’t compete with the top picks in terms of quality and range of functionalities. It’s available for use on Windows, Linux, and Mac.
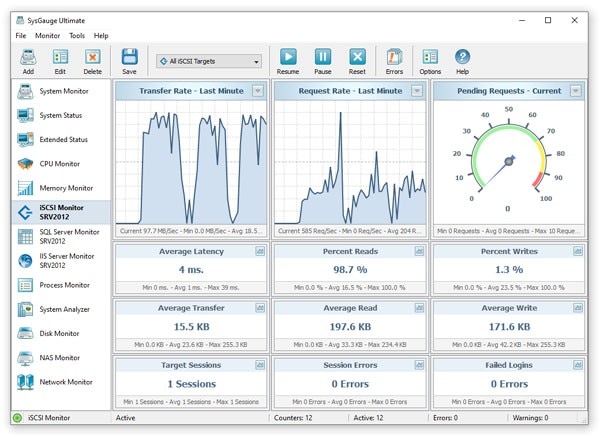
SysGauge is designed for simplicity over versatility. It’s easy to use and has a clean interface, but its features still pack a punch. The SysGauge CPU monitor, a GUI module, is rich in its CPU metrics offering. It can report on CPU frequency, interrupt rate, interrupt time, and overall usage.
This Windows CPU monitor is well designed and suited to purpose. I’d describe it as simple and functional. Though it doesn’t come with any especially exciting features, it offers users the ability to set their own alert parameters, which trigger email notifications when breached. In addition, users can execute custom commands, meaning the software could be used to respond to CPU performance issues within a live network in a highly responsive and efficient way.
This CPU usage monitor requires relatively low memory usage, at only 10 megabytes when running the 64-bit version of the application on a 64-bit Windows server. Despite its compact size, the SysGauge CPU monitor is feature-heavy and I appreciated its clean interface.
I would, however, have liked to see more dynamic and visual representations of data, for ease of interpretation—perhaps in the form of graphs, charts, or widgets. Real-time metrics would also be appreciated.
SysGauge offers three versions of its software. The most basic version provides up to 10 counters, monitors, and profiles, while the most premium offers up to 100.
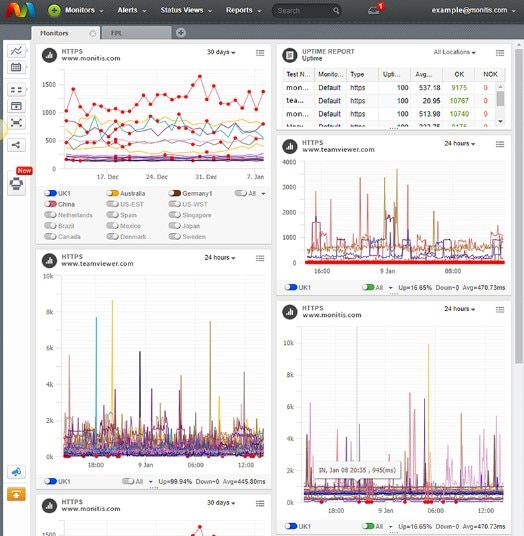
With Monitis, you can expect a powerful web performance monitoring platform, but you can also depend on the tool’s CPU monitoring capacity. Monitis CPU utilities have been designed to monitor and continually assess the overall health of every device on your network, on both a collective and an individual basis. The tool’s CPU functionalities are nicely complemented by other Monitis features, including the ability to monitor memory, drive, and load.
The thing I like most about Monitis is its quick startup time. The platform doesn’t need to be installed, and the developer claims you can have it up and running in under three minutes. Monitis can be accessed online, meaning you can use any device to monitor your network.
The tool’s cloud-based approach, however, comes with certain issues, which is why Monitis hasn’t ranked higher on this list. In my view, the network dependency of cloud-based programs, the potential for security issues associated with hacking, and the lack of control of your own data are significant downsides.
Monitis offers custom price plans, which can be tweaked to suit your individual requirements. Essentially, the cost correlates to a range of services, including uptime monitoring, full page load monitoring, and server monitoring, among others.
StackPath Server Density is a SaaS monitoring platform that also functions as a CPU usage monitor. Server Density features a dashboard with a simple design, which provides a view of basic CPU metrics, including load and speed, revealing whether a device’s CPU usage has exceeded healthy parameters.
Like many of the products on this list, Server Density allows users to define custom alert parameters and can deliver alerts via Slack, PagerDuty, SMS, webhook, and email.
One of the major benefits of Server Density is its accessibility to networks of all sizes. It’s a simple but powerful CPU monitor, with a highly competitive price based on the number of servers you want to monitor and paid on a monthly basis. Although I enjoy the simplicity of Server Density, the dashboard could benefit from being more user-friendly and intuitive, and I would have liked to see more features distinguishing it from competitor products.
ConnectWise Automate allows you to view CPU usage for each process on a device, affording maximum visibility. The tool’s automated features are its real selling point—including automated asset discovery, automated agent deployment to your supported endpoints, and automated network scans. All these functionalities can speed up and complement the process of collecting CPU metrics.
For me, the ConnectWise Automate dashboard is the tool’s best feature. While many dashboards can be cluttered, leaving users feeling overwhelmed, ConnectWise Automate takes a cleaner, more intuitive approach. This software classifies programs based on their activity, with denotations of “Good Program,” “Grayware,” and “Spyware.” “Good Programs” refers to those with satisfactory performance, while “Grayware” refers to programs with undesirable software, and “Spyware” means they could potentially expose the network to viruses or spyware. I appreciated the simplicity of this visibility, though I found it could be reductive at face value.
ConnectWise Automate operates on Windows, Linux, or Mac. The tool’s customizable pricing structure is attractive, but you have to contact ConnectWise directly to get a quote.
Best CPU Monitoring Software
All the CPU usage monitoring tools outlined in this guide have their merits, but in conducting my review, the SolarWinds product line—namely Network Performance Monitor and Engineer’s Toolset—stood out as the most sophisticated and user-friendly offerings currently on the market. Compared to the other tools on the list, these come with a greater range of functionalities, an impressive auto-discovery feature to save users time, and an accompanying host of highly complementary wider network monitoring utilities. In particular, the dynamic visualization capacities and real-time metrics of SolarWinds NPM set it apart, offering users an experience with maximum visibility and ultimate ease of data interpretation.