
The performance of your applications can have a significant impact on your brand reputation, revenue, and credibility in the digital marketplace. While many companies may still prefer to adopt a manual approach to application performance, doing so becomes increasingly challenging as your organization grows. As an alternative, many companies choose to adopt automated solutions for access to in-depth insight into the performance of their critical business components and processes. These tools can often deliver this information in real time.
AppDynamics is a popular application performance monitoring (APM) tool designed to connect application performance and customer experience to defined business outcomes. AppDynamics is one of the most well-known APM tools on the market, monitoring application performance, business performance, and end user activity. This tool delivers AI-powered insights and facilitates automated actions, in addition to providing enterprise-grade visibility into your infrastructure and cloud-native technologies.
Although AppDynamics is generally considered an effective APM solution, I believe it’s one of the more expensive products on the market. As such, AppDynamics may not be the most cost-effective option for small and midsize businesses. In addition to the high price tag, I believe AppDynamics has a relatively steep learning curve and the user interface isn’t especially user-friendly. Users with minimal training or experience are likely to find AppDynamics challenging. If you want a tool you can get started with quickly, there are plenty of tools like AppDynamics that may be better suited to your individual requirements.
For those in search of an AppDynamics replacement, this guide reviews the best AppDynamics competitors on the market. My top pick is SolarWinds® Server & Application Monitor (SAM). SAM is similar to AppDynamics, in that it offers a similar range of advanced capabilities, but without the initial learning curve. Read on to find out how SolarWinds SAM and other AppDynamics alternatives compare.
What Is Application Performance Monitoring?
How Does APM Work?
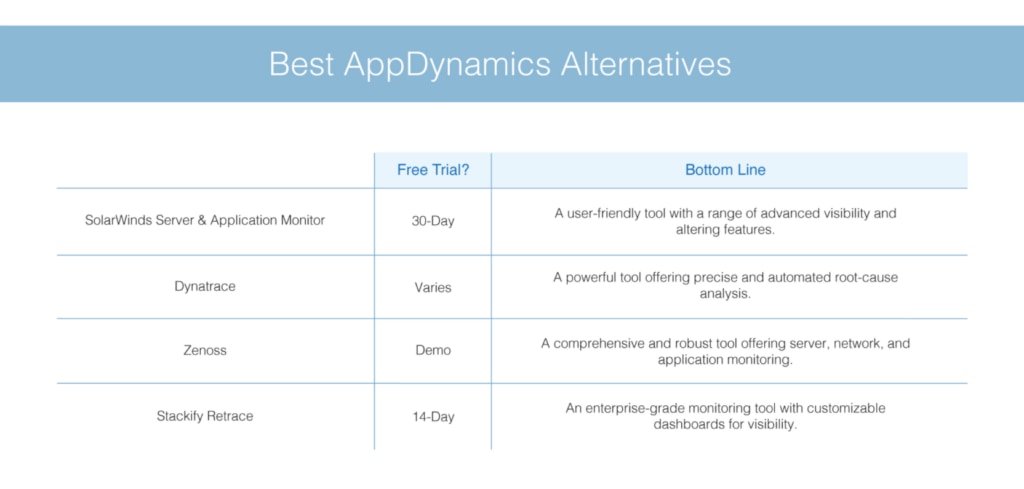
Top AppDynamics Alternatives
Choosing the Right AppDynamics Alternative
What Is Application Performance Monitoring?
Performance monitoring is a critical part of delivering a robust and dependable IT solution. If you have already implemented a network monitoring tool, you may feel your performance monitoring requirements are being met. Application performance monitoring, however, isn’t the same as network performance monitoring. While these solutions certainly complement each other, they’re not interchangeable. While network monitoring focuses on connectivity, application monitoring informs you when an application isn’t functioning as it should be, regardless of whether users can access it.
To elaborate, application monitoring tells you when your main line of business applications and their related databases aren’t performing correctly. Effective APM software will feature a visual dashboard, giving insight into trend usage, performance, and growth. APM is extremely important for meeting SLAs, capacity planning, and identifying problems before they cause outages. APM is also referred to as application monitoring and application performance management.
How Does APM Work?
The application monitoring process is usually delivered by specialized APM software integrated with the primary application being monitored. Application monitoring usually provides runtime metrics of system performance, which are passed on to the application administrator. Metrics are likely to include system response, transaction time, transaction volume, and overall health of the back-end infrastructure.
Metrics are typically displayed via an APM software dashboard in the form of statistics and graphical figures, like bar and line graphs. These figures make it possible for administrators to evaluate application performance or the state of the overall application infrastructure. APM processes also assess the end-user experience and component-level application performance.
As a rule, application monitoring tools work in one of two ways—they either use an agent-push method or a polling method. In some cases, they may use a combination of both. An agent-push approach uses a monitoring agent, locally installed on the server, to push monitored data. The polling method uses SNMP, WMI, and other similar methods of collating application information.
While the agent-push method has offered more powerful monitoring options in the past, it’s difficult to manage. You have to install agents on the monitored servers and keep them updated, which is time consuming and resource intensive. Polling has become the preferred approach because it’s easier to deploy and manage.
Top AppDynamics Alternatives
Application monitoring is an essential part of ensuring your infrastructure remains operational. It gives insight into how your applications are running, growing, and being used. This data allows you to plan for equipment acquisition in an informed way and helps you identify problems with your applications as quickly as possible. With application monitoring, you can rest assured your clients are able to complete their transactions smoothly.
If you’re concerned AppDynamics might not be cost-effective for your company, then these AppDynamics competitors are worth considering.
✔ SolarWinds Server & Application Monitor
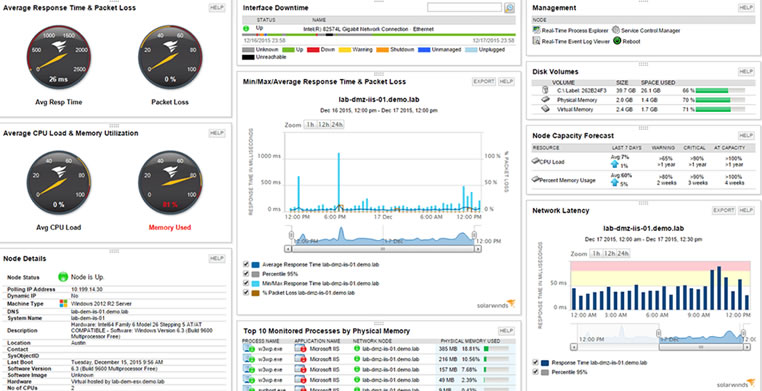
SolarWinds SAM is a popular solution among AppDynamics alternatives. Like AppDynamics, it delivers application performance monitoring for a wide range of systems and applications.
As an AppDynamics alternative, SAM allows you to replace multiple vendor monitoring systems by giving you access to detailed insights into performance and availability. Like AppDynamics, this tool delivers monitoring, alerting, and reporting capabilities for multi-vendor server hardware monitoring software—all within a single console. Both tools give you server, database, and network performance visibility, helping you ensure application performance is fully supported by your infrastructure.
Both AppDynamics and SAM combine application performance monitoring with server performance monitoring to give you a more comprehensive view of your infrastructure. As server health can impact the performance of your applications, this is an important feature. While AppDynamics uses agents, SAM uses an agentless approach to server monitoring. SAM leverages best practice thresholds for key server health monitoring metrics, including array status, hard drive status, fan status, fan speed, CPU, temperature status, and much more. This tool can track these metrics for an array of servers—including Dell PowerEdge, IBM eServer xSeries servers, and HP ProLiant—helping you get in front of availability problems.
Similar to AppDynamics, SAM can display real-time and historical trends. With SAM’s impressive scope of capabilities, you can address issues and manage capacity at the application layer in a proactive manner. I feel that these features place SAM among the most popular and well-regarded AppDynamics competitors.
One of SAM’s most sophisticated features is the Real-Time Process Explorer (RTPE). The RTPE feature means when you want to access metrics, you don’t need to manually log in to each machine, either remotely or physically, and run Task Manager. Instead, you can leverage the web console, which displays data for both monitored and unmonitored processes. You are given a central view, which helps you solve issues in a quick and efficient way. The web console features integrated monitoring tools, so you can kill rogue processes, natively start and stop services, and reboot servers. While AppDynamics offers deep visibility into your application, server, and infrastructure health, the interface is less user-friendly. This makes navigating and accessing information more of a challenge.
SAM’s dashboards, like AppDynamics, are customizable. The layout of SAM’s dashboards is clear and represents data graphically where possible and appropriate, for ease of interpretation. SAM lets you filter summary views by application and/or service, and the custom dashboard views allow you to prioritize the display of any nodes, applications, and servers you want to keep your eye on. The ability to organize dashboards to suit your needs is a useful feature, and is similar to AppDynamics, which also allows you to customize your display to home in on a specific set of metrics and data points on one screen.
SAM lets you monitor custom applications, both in the cloud and on-premises, with out-of-the-box support for multi-vendor applications. Like AppDynamics, this tool allows you to use APIs, scripts, and PowerShell to extend your monitoring and reporting capabilities via third-party vendors.
Overall, I think SAM is one of the top AppDynamics competitors on the market. This tool has a reputation for its user-friendliness, but still offers an impressive range of advanced features. This gives it the edge over AppDynamics, which is often reported as having a steep learning curve. SAM comes with ample vendor support, with an active forum of loyal users ready to answer any questions you might have, and 24/7 support technician availability for one year with a new license or active maintenance. AppDynamics also offers support, available through the AppDynamics community or by contacting one of their technical support agents 24/7. You can access a 30-day free trial of SAM here.
✔ Dynatrace
Dynatrace is another popular AppDynamics alternative, delivering both infrastructure and application performance monitoring capabilities. Dynatrace is an all-in-one tool that provides advanced visibility, supported by artificial intelligence (AI). Like AppDynamics, Dynatrace offers an impressive level of automation, helping teams save time and resources, in addition to providing better business outcomes.
The Dynatrace AI assistant is called David. David can automatically process more than 8 billion application changes in a single day, resulting in precise metrics and answers. According to Dynatrace, David can even be used to deliver a reduction in overall outages, saving approximately 100,000 minutes, and having a marked improvement on system health. Similarly, AppDynamics delivers AI-powered contextual insights about application and business health, predicting performance deviations, and alerting you before the user is impacted. In fact, AppDynamics was an early pioneer for APM machine learning.
One of the reasons Dynatrace is such a popular AppDynamics alternative is because it gives users access to an impressive number of automation capabilities. It features a utility called OneAgent, which collects high-fidelity data continuously and automatically. All data is gathered in context, which means there’s no need for manual scripting or configuration. OneAgent automatically discovers processes running on a host and activates instrumentation for your stack. New components are instrumented automatically, as and when necessary.
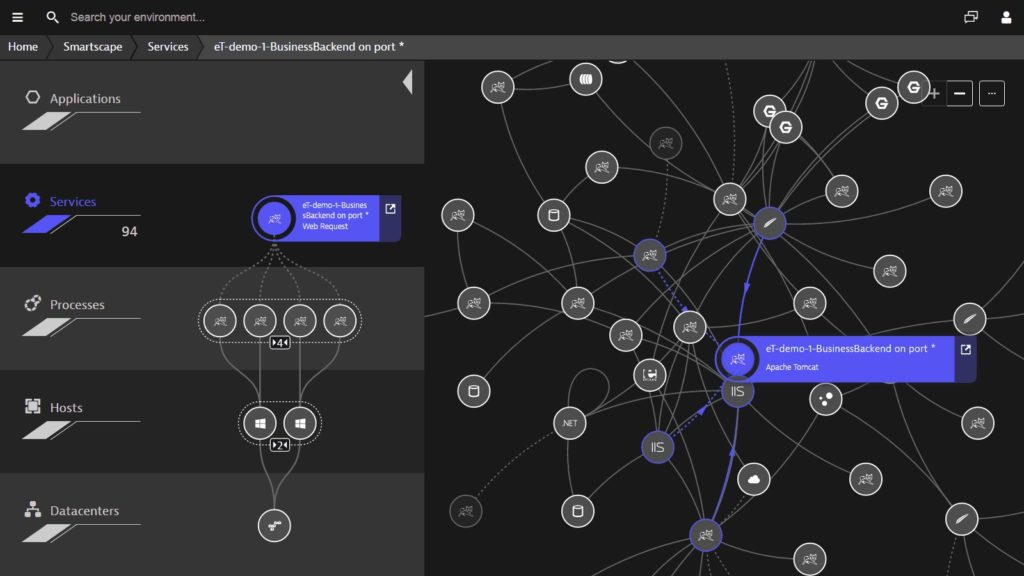
Dynatrace also features a utility called Smartscape, which maps data into a real-time dependency map. These maps display the dependencies and relationships for all entities, both up and down the stack, and horizontally between hosts, services, and processes. AppDynamics offers similar mapping capabilities.
As with AppDynamics, Dynatrace features machine learning technology, which automatically learns and establishes baselines, adapting dynamically to reflect changes in your environment. Like AppDynamics, Dynatrace keeps you informed with a proactive alerts system. This sophisticated alerts system reduces alert noise by determining the severity of an incident, based on user and business impact, so your team can prioritize the most important assets.
Dynatrace conducts precise and automated root-cause analysis, as well as auto-remediation. This is similar to AppDynamics, which uses machine learning to automate anomaly detection and reduce MTTR with instant root cause diagnostics. Dynatrace AI gives you clear insight into how it reaches its conclusions and, by integrating Dynatrace with your configuration management database and continuous delivery solutions, you can set up automatic remediation for many problems. Dynatrace APM also includes AIOps and infrastructure monitoring, making it a highly versatile AppDynamics competitor. A free trial of Dynatrace is available.
✔ Zenoss
Like AppDynamics, Zenoss is more than an application performance monitoring solution. Zenoss offers cloud monitoring, container monitoring and microservices, storage monitoring, network monitoring, server monitoring, virtualization monitoring, application monitoring, and more. It offers an alternative to the traditional approach to server monitoring, which typically involves separately monitoring silos of device types. With this AppDynamics alternative, you can monitor your servers as part of a complete IT stack, including your cloud and on-premises infrastructure. This versatility allows you to deliver optimal application, infrastructure, and server performance.
One of the reasons Zenoss is so popular as an AppDynamics competitor is because it combines operational insights from your physical, cloud, and virtual infrastructures to give you complete visibility into your whole ecosystem, at scale. Like AppDynamics, Zenoss automatically detects issues impacting an application and shows you how affected components interact with other system elements. This capability helps your team resolve issues, meet SLAs, and maintain continuous service delivery.
If resource management and capacity planning is a priority for your company, then Zenoss is a good choice. This tool gives you detailed performance insights and allows you to monitor devices at the component level. You can monitor performance and configuration information for different devices, assisting you in delivering service assurance.
Zenoss gives you clear insight into the health, performance, and utilization of the critical systems and processes your business depends on. Zenoss includes unified IT monitoring and analytics for your complete multi-vendor infrastructure, making it easy to map the service impact relationships between infrastructure and application elements. AppDynamics offers similar dependency mapping capabilities.
Zenoss is a comprehensive and robust tool offering numerous monitoring solutions, including server, network, and application monitoring. Its user interface could, however, be easier to navigate. To access Zenoss prices and request a demo, click here.
✔ Stackify Retrace
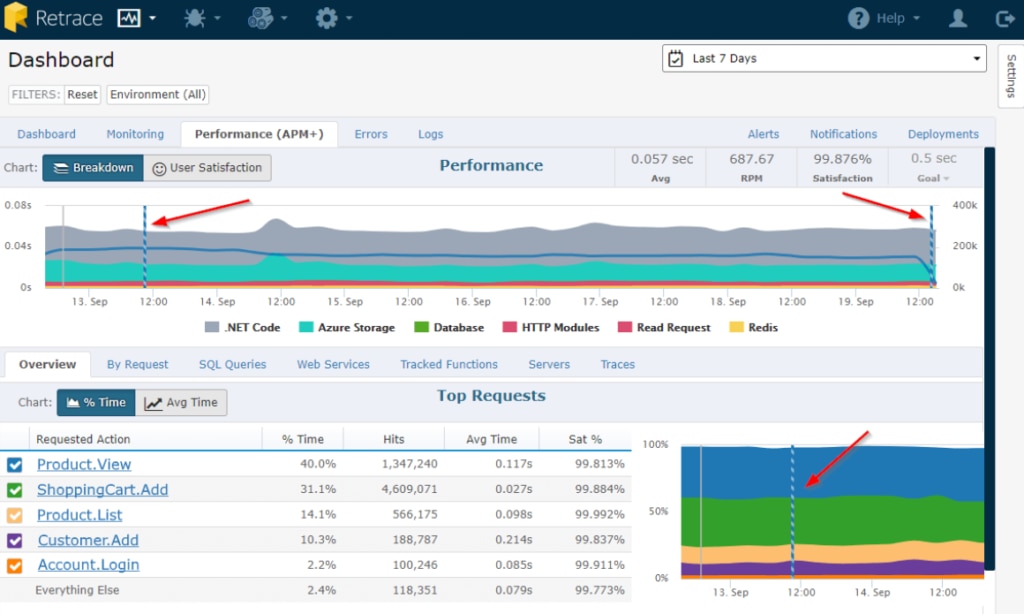
Stackify Retrace is an AppDynamics alternative offering an impressive range of application performance monitoring and management functionalities. This solution helps you quickly identify which part of your stack is responsible for a bottleneck, so you can continuously improve application performance. Like AppDynamics, Stackify Retrace lets you monitor Apdex user satisfaction, identify slow dependencies, monitor deployments, and gain in-depth insight into application performance.
As in AppDynamics, Stackify Retrace also features log features, providing you with a unified solution designed to aggregate your logs across servers and applications. You can view and search your logs from one place, boost the efficiency of analysis with structured logging and log tags, configure and track automated log queries, and go from a log statement to a complete transaction trace.
This tool also helps you detect and resolve exceptions in your code, minimizing the time to resolution. Stackify Retrace lets you view logs and exceptions side by side for comparison, helps you identify unique exceptions quickly, and facilitates exception rates monitoring. AppDynamics provides similar functionality, giving you visibility into application code that enables you to securely capture critical debug data, without performance overhead and on-demand.
The Stackify Retrace platform lets you retrace code with lightweight code profiling capabilities, giving your developers cost-level insights in addition to integrated logging capabilities. Key Retrace code profiler capabilities include viewing derailed snapshots of what your code is doing, collecting dependencies and frameworks automatically, tracking SQL queries executed, tracking performance and usage when your code makes HTTP requests, and profiling the performance of asynchronous code.
Stackify Retrace lets you monitor critical application and server metrics. It lets you create custom dashboards, similarly to AppDynamics, and share individualized app dashboards with the whole of your team. You can also adjust dashboard settings to align them with different goals. While there’s an initial learning curve when you get restarted with Retrace, it’s a powerful AppDynamics alternative. A 14-day free trial is available.
Choosing the Right AppDynamics Alternative
When it comes to overall user-friendliness and cost-efficiency, SolarWinds SAM is a cut above AppDynamics. SAM offers maximum automation capabilities, reducing the manual effort required and helping make your job significantly less time consuming. At the same time, SAM is highly sophisticated, delivering one of the best in application, server, and network monitoring. You can access a 30-day free trial for SAM here.
*As of June 19, 2020