
Nagios is an extremely popular network monitoring solution. It’s an open source program driven by a large developer community, with users including massive enterprises (like Yahoo, Amazon, and Google), ISPs, and governmental bodies. It was released in 1999, under the name NetSaint, and has been refined over the years by numerous contributors.
Nagios has certainly been around for a long time, but are there any Nagios alternatives out there today—a would-be modern Nagios, perhaps—capable of competing with the original? I, like many, think there are. Though widely used, Nagios has its limitations, which several monitoring tools like Nagios effectively address. This guide aims to help you choose the best of the best Nagios alternative to fit your needs.
Reasons to Consider Nagios Alternatives
What to Look For in a Nagios Replacement
8 Best Nagios Alternatives
Implementing a Nagios Alternative
Reasons to Consider Nagios Alternatives
There are plenty of limitations associated with the native Nagios structure, some of which can be rectified by third-party add-ons, and some of which can’t. There’s the GUI, which isn’t especially user-friendly; the lack of database and performance records; difficulties related to configuration; and the lack of automatic device discovery.
While in some cases a third-party add-on can solve these issues, there’s much to be said for a complete, unified monitoring solution that doesn’t require third-party add-ons to deliver excellence. With all the Nagios plugins and add-ons out there, keeping Nagios up to date and functional in a dynamic environment can feel like a nightmare.
But some disadvantages can’t be rectified by add-ons—like the fact that Nagios doesn’t distinguish between device types like servers, switches, and routers. Furthermore, some admins and engineers prefer working with Windows Server instead of the Linux/Unix commands affiliated with Nagios.
As software development continues to advance, with programs becoming increasingly easy to use, network administrators looking for an upgrade might want to consider a Nagios replacement. But where to start? I have put together this guide to help you sort through all the best Nagios alternatives out there.
What to Look For in a Nagios Replacement
In compiling this guide, I started out looking at premium, paid software, not least because of the support typically accompanying commercial solutions. For some admins looking for a Nagios alternative, open source programs are appealing for their transparency and price, and I have included several of these as well. It’s worth noting, open source tools tend to require additional know-how to get them installed and running.
The products in this list have been ranked according to the following desirable features:
- Alerts, notifications, and triggers, to keep you informed via several communication channels
- Network map and topology capabilities
- Built-in NetFlow network analyzer
- Analyzers for other flow protocols (e.g., sFlow, IPFIX)
- Automated network discovery
- Web interface based in GUI
- Windows OS configuration compatibility
- Overall user-friendliness
- Ease of setup
- Ease of migration from Nagios
Taking all of these considerations into account, SolarWinds® Server & Application Monitor (SAM) ranks first among the available Nagios alternatives. In a Nagios vs. SolarWinds SAM scenario, SAM was far easier to use, with integrated features making the system more maintainable over the long term. It has an impressive selection of automated features, and network mapping and topology utilities. SAM is also available as a free trial, which I consider a must when thinking about investing in software.
8 Best Nagios Alternatives
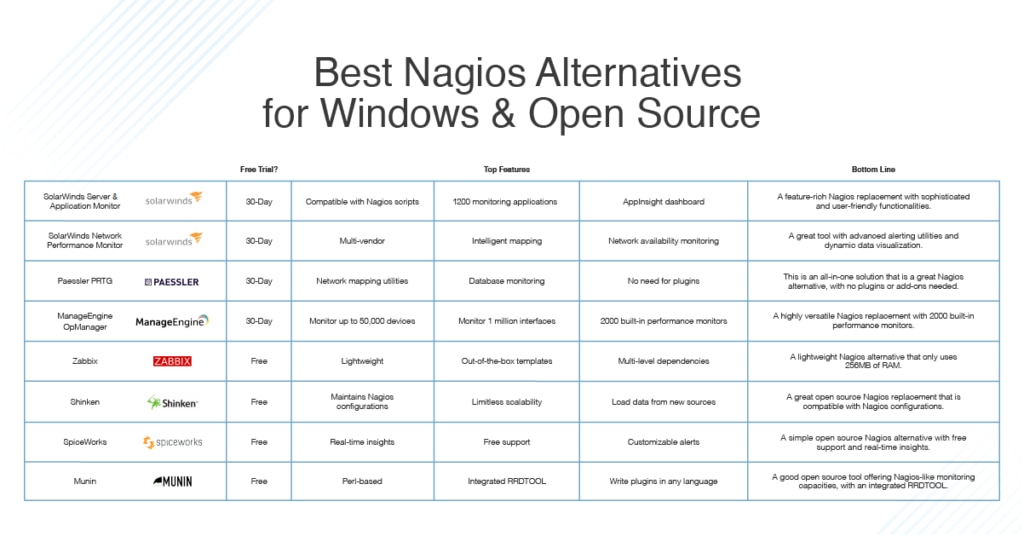
Here’s my guide to Nagios replacements, including a selection of paid and open source offerings.
This application and server monitoring tool recognizes itself as a Nagios alternative, and boasts utilities designed for this very purpose. Most notably, you can migrate from Nagios to SolarWinds SAM quickly and easily.
The first step is migrating your current Nagios scripts to SAM. You don’t need to change your scripts to do this; SAM has a built-in script processor letting you convert Nagios scripts into a compatible format, so you can make the most of the alerts, scheduling, and reporting functionalities of the program. This migration capacity is, in my view, one of the best things about SolarWinds SAM, making it a highly viable Nagios replacement.
Another benefit is SAM uses built-in application templates, offering you visibility of performance monitoring across over 1200 applications. This includes email servers, databases, web servers, application servers, and more. You can run all these templates to your existing Nagios scripts. No need to create custom scripts—just choose the template, then the script server, and you’re ready to start monitoring.
An important feature of any server and application monitoring tool is how dynamic and user-friendly its dashboard is, and this is where SAM excels. The AppInsight™ dashboard offers detailed and attractive visualizations of your application performance, and is extremely versatile with its functionality. Not only does the dashboard automate monitoring, but it also lets you rapidly troubleshoot the cause of performance issues by showing contextual metrics and mapping dependencies. It does this across servers, virtual layers, and operating systems, giving you unrivaled insight into your IT infrastructure.
When you’re choosing a program with Nagios-like monitoring capabilities, it’s easy to overlook the matter of scalability. As your network grows, you want your monitor to be able to cope with the added strain and complexity. SAM utilizes an entirely agentless approach, which makes discovering and polling metrics super easy. It doesn’t require any third-party interaction, and it can manage a network of any size.
For those who aren’t fans of the agentless approach, you can opt for the agent-based deployment. This lets you expand the scope of your monitoring capacities, so you can access remote and satellite offices, cloud infrastructure, and DMZ networks.
As a monitoring solution, SAM is extremely well supported, and its Nagios migration ability is exceptionally streamlined. It’s difficult to compete with a feature allowing you to keep your existing Nagios scripts, which you may have been developing over several years. This feature sets the tool apart from most of its competitors.
SolarWinds offers a fully functional, free 30-day trial of Server & Application Monitor.
The second product to make this list is also from SolarWinds. This comes down to the software developer’s knack for producing highly user-friendly, feature-heavy programs. Network Performance Monitor is another example of the company’s intelligent and intuitive design strategy.
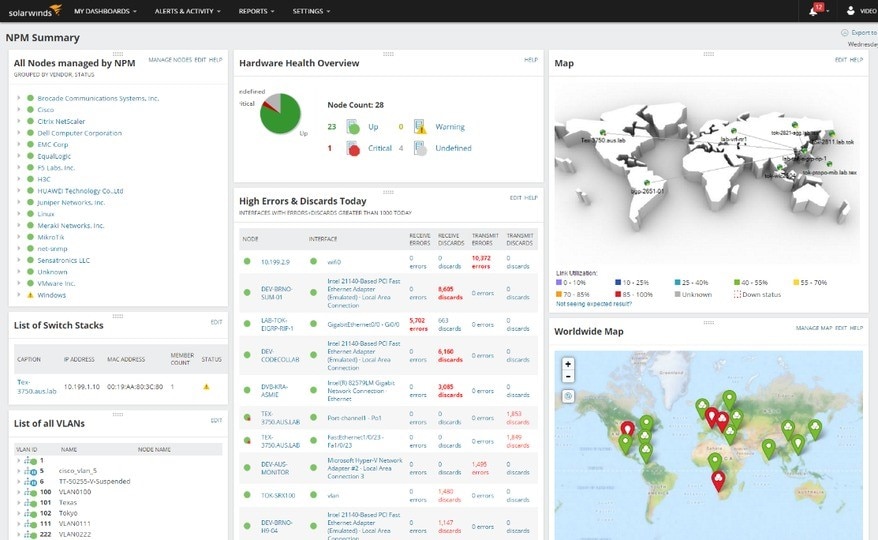
NPM is a multi-vendor, highly-scalable network monitoring solution offering critical path visualization, intelligent mapping, Wi-Fi monitoring, network availability monitoring, and advanced alerting utilities. To keep this guide concise, I’ll focus on my favorite features of the tool.
The alerting features are one of the best things about NPM. SolarWinds approaches alerts with the aim to reduce the amount of meaningless or irrelevant alerts you receive. Instead, the company aims to deliver informative and actionable alerts. With NPM, you can create your own alerts based on nested trigger conditions, which can be either simple or complex. You can also customize the times at which you receive certain alerts. For example, if you consider an alert to be non-critical but still worth having, you can personalize your alerts system, so you only receive that alert during certain hours.
In addition to being able to specify the time of day or the days of the week when you receive certain alerts, you can choose how you’re notified (e.g., via email or text message). And as an alternative to creating alerts, the tool gives you the option to save time by utilizing and altering built-in default alerts. Notifications are delivered in real time.
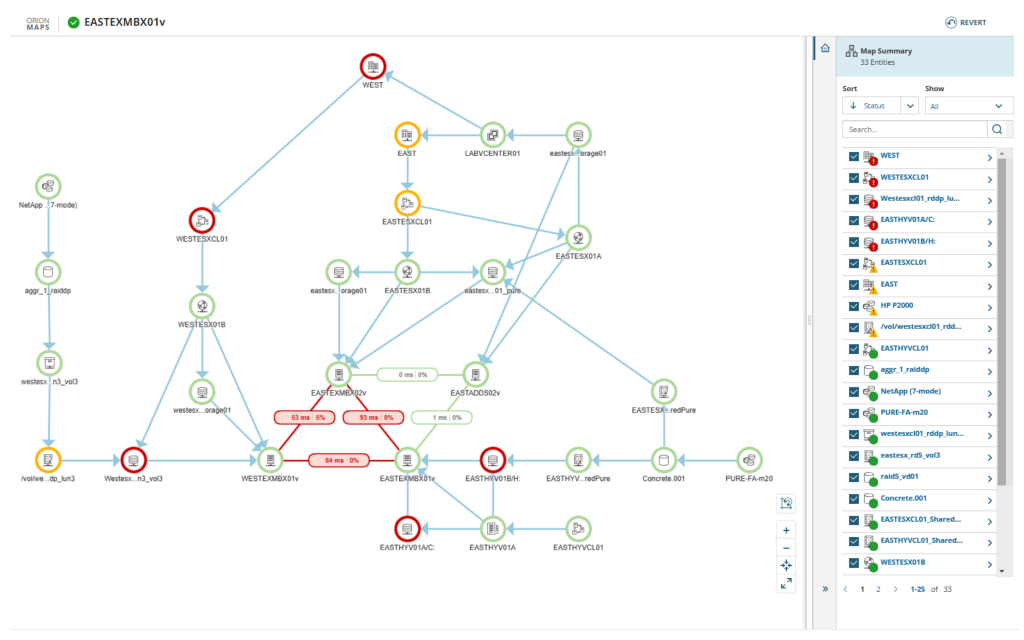
As with SolarWinds SAM, NPM stands out from competitors for its robust visualization capabilities. The dashboard provides you with a single, unified view of all your applications, network connections, dependency relationships, topology, and add-drop multiplexer information. These graphic representations of your data show you the physical relationships between everything on your network, including routers, servers, switches, interfaces, groups, and volumes. The visualizer updates automatically, so you don’t have to waste any time making manual adjustments.
With such an extensive visualization capacity, and with so many metrics to stay on top of, it would be all too easy for the dashboard to appear cluttered, as many other program dashboards do. But SolarWinds has a talent for maintaining a clean, manageable dashboard while also taking action to not overwhelm users. Instead of clustering information together, NPM gives users the option to dive deeper into each of the metrics, so you can view a greater depth of detail when you need it, as opposed to seeing it all at once.
I also really appreciate NPM allowing you to monitor logical components directly from your main network monitoring program. This includes all aspects of your SDN environment, like APICs, application profiles, tenants, physical entities, and endpoint groups. SolarWinds aptly refers to this as “single pane of glass” SDN monitoring. It negates the need to jump between your primary network monitoring software and the APIC GUI over and over again, which can become tiresome quickly.
Overall, SolarWinds Network Performance Monitor comes in at a close second on this list. It stands out in part for its cleverly designed dashboard, alerts system, and range of user-friendly features. As with SolarWinds SAM, a free 30-day trial of NPM is also available.
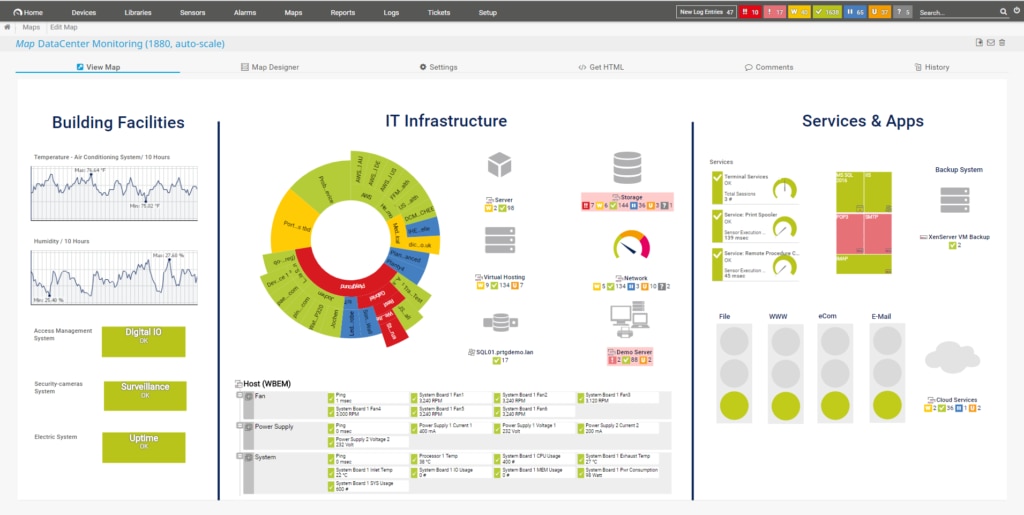
PRTG, by Paessler, is another popular network monitoring tool. Generally speaking, it’s an impressive monitoring solution, giving users insight into and absolute control over all their systems, including bandwidth, bottlenecks, and IP interfaces. PRTG users can expect network mapping utilities to provide dynamic, easy-to-interpret visualizations of their data, and a dependable alerting system, among other useful features. But in a Nagios vs. PRTG scenario, which comes out on top?
There are plenty of things PRTG and Nagios have in common. They both offer database monitoring capabilities, for example, and hardware health monitoring across CPU, memory, disk space, internal temperatures, and other metrics. The key difference between Nagios and PRTG is: Nagios requires add-ons or plugins for certain features, while PRTG does not.
Automatic network discovery, mapping, and topology diagrams, for instance, are key built-in aspects of the PRTG solution, but they require an add-on with Nagios. Wi-Fi monitoring, QOS and IP SLA monitoring, printer monitoring, and VMware and Hyper-V monitoring are further examples of features requiring a plugin or add-on with Nagios, but don’t with PRTG.
As I mentioned earlier, Nagios’ option of using plugins and add-ons allows you to personalize your monitoring approach. Nagios is, essentially, what you make of it—and with so many thousands of plugins and add-ons available, you could choose to make your monitoring system as versatile as you like. But the key disadvantage with this approach is systems with lots of add-ons and plugins become increasingly difficult to maintain and keep current. They’re more susceptible to lags and faults, and they’re not especially user-friendly.
With PRTG, there’s native support for major monitoring features. This is a much simpler alternative to Nagios and is particularly well-suited to those users who are not familiar with manually configuring files and plugins, which Nagios often requires.
One of the key drawbacks to PRTG is the sensor-based pricing model. The price jumps up when you reach a certain number of sensors, and if you are just over the limit, you could end up paying for sensors you don’t need.
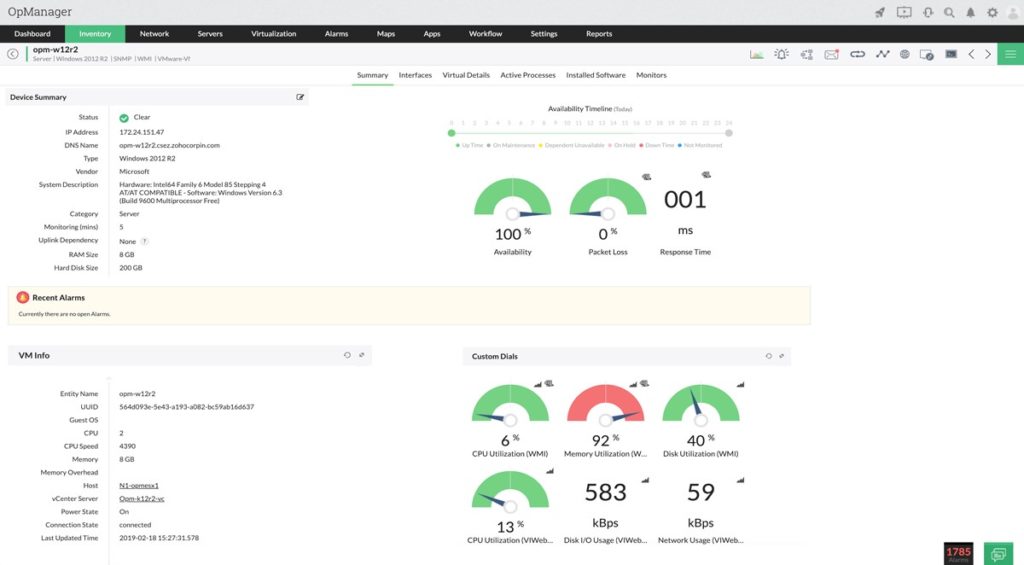
ManageEngine is an industry-leading software developer, with a focus on network monitoring and management solutions. The company’s OpManager is a decent Nagios replacement, with the advantage of functioning as an all-in-one tool for network administrators. With OpManager, you can monitor up to 50,000 devices or 1 million interfaces from a single server. The program offers real-time network monitoring functions with over 2,000 built-in performance monitors. These cover everything, from packet loss, latency, and speed to errors, discards, and bottleneck analysis.
I’m a fan of the tool’s multi-level thresholds approach, which lets you define numerous thresholds for every critical performance monitor and receive instant alerts when a violation occurs. And OpManager’s integrated mobile app, available on Android, iPhone, and iPad, makes this a truly modern Nagios alternative.
One of the tool’s strengths is its customizable dashboard, with over 200 performance widgets you can choose from and rearrange according to your preference. This means your dashboard can give you an instant overview of whatever metrics you consider to be a priority. However, although I liked the customizable dashboard, I found it became cluttered, and a bit overwhelming, when too many widgets were involved. I would’ve preferred a more intuitive dashboard.
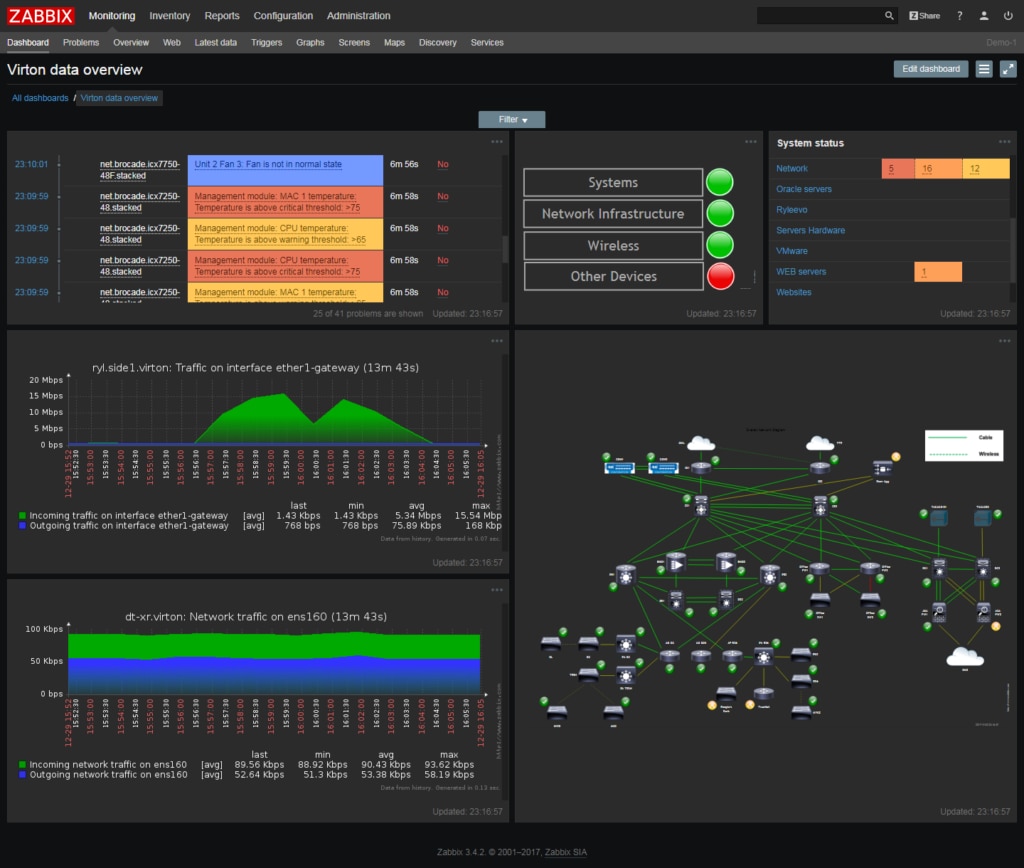
Unlike the previously mentioned tools, Zabbix is an open source Nagios alternative. Its competitive edge is largely due to its highly scalable design and light overhead. In fact, according to Zabbix developers, the program uses just 256 MB of RAM, which gives it a significant advantage over most other networking solutions.
Zabbix offers network monitoring, server monitoring, cloud monitoring, and application monitoring. With regard to network monitoring, it has several key merits: these include an auto-detect feature for network devices and for device configuration changes, which means you can stay on top of everything from a new switch being added to firmware being upgraded. Zabbix provides out-of-the-box templates, so you can start monitoring metrics almost instantly. And it gives you the ability to define multi-level dependencies between related network nodes.
Zabbix is most popular for its scalability, which is practically unlimited. Scaling is made a reality by offloading the Zabbix server, via Zabbix proxy. There are no hidden restrictions, so it works for any network size.
My favorite Zabbix feature, though, is the alerts system. The tool can deliver notifications via email, SMS, custom script, messenger, or Jabber, making it more flexible than most.
Despite its range of noteworthy features, Zabbix still lacks the user-friendliness of the more highly ranking programs on this list. Fine-tuning Zabbix and coming to grips with how it works can be tricky and time-consuming, and many users will find this off-putting.
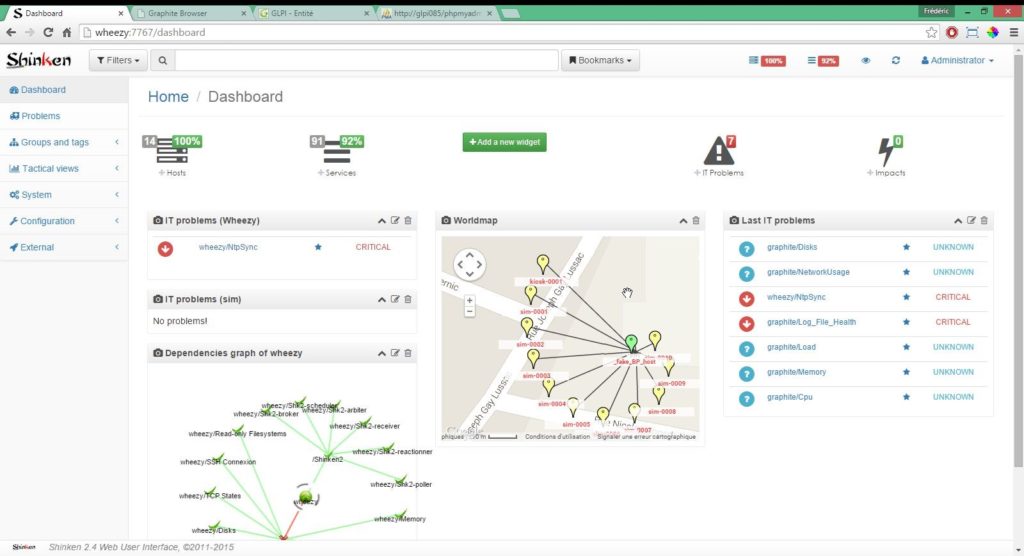
Shinken, like Zabbix, is open source, and it offers some of the best Nagios-like monitoring functionalities on the market. One of the best things about Shinken is it lets you keep all your Nagios plugins and configurations. It has limitless scalability, RAID-like availability, and out-of-the-box monitoring packs. You can also load data from new sources, like Puppet and MySQL, and new export methods, like PNP4Nagios and Graphite.
Another notable feature is when troubleshooting the root of a problem, the program filters out the consequences for you, reducing the number of red lines you get, so you can more quickly identify the cause. This reduces the amount of false or unimportant alerts you get, so you can be certain the alerts you receive are meaningful and actionable.
Shinken isn’t well suited to business use and isn’t as user-friendly as most paid solutions. However, in the Nagios vs. Shinken debate, Shinken is definitely a viable alternative.
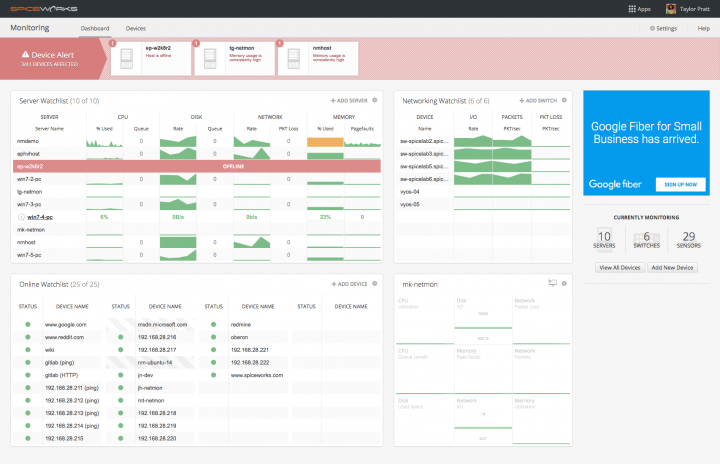
SpiceWorks is a well-supported program. It’s a Nagios alternative, open source, and entirely free to use. The free support includes contact with advice experts, which gives this tool a real competitive edge.
With SpiceWorks, you can expect real-time updates on switches, servers, and any IP device. These insights make it possible to identify slow, overworked systems and devices before they become an issue, boosting overall end-user satisfaction.
The customizable notifications system is another pro, giving you control of the type of alerts you receive and when you receive them. SpiceWorks also comes with a free help desk, which can be loaded in minutes and lets you manage whatever issues users raise quickly and efficiently.
SpiceWorks cannot support a large network, having been designed for companies monitoring 25 devices or less. Though it ranks among one of the simpler open source solutions, it’s still more complicated than the paid solutions higher on this list, which offer more of an all-in-one, intuitive experience for users.
Lastly, we have Munin, another open source monitoring solution. It is a Perl-based system integrating RRDtool, which makes for some impressive graphing utilities.
Munin allows users to install plugins, which are standalone executables. These plugins are easy to write, and you can write them in any language. Furthermore, the tool provides access to a contribution repository, where plugins contributed by other users can be found.
I also value Munin’s approach to changes. Its “What’s Different Today” focus makes it easy to rapidly pinpoint any important differences on a day-to-day basis.
The main problem with this tool, in my view, is it doesn’t have the same wealth of support available as other open source tools. Moreover, the dashboard and user interface aren’t especially intuitive, resulting in an overall user experience less dynamic and streamlined.
Implementing a Nagios Alternative
There are several good options out there if you’re looking to replace Nagios with an alternative monitoring tool. If you have a small budget, are comfortable with open source, and don’t require round-the-clock access to support, you might start with one of the free solutions.
Regardless of budget and the size of your network, when it comes to a Nagios alternative, Windows users can’t do better than SolarWinds Server & Application Monitor. The program is the most user-friendly, with sophisticated functionalities and an intelligent approach to the user experience.