Knowing the state of your network and server health is incredibly important for techs who want to optimize performance. Without insights into how your servers are performing, you increase the odds of encountering pesky software bugs or potential bottlenecks. That’s why it’s important to develop proactive server monitoring practices.
Monitoring servers can be a tedious ordeal; applications must be checked for responsiveness, storage can’t run above capacity, and web servers must be constantly protected from external threats. Although some monitoring can be performed manually, human efforts are less efficient and in many cases can’t match what proper tools can do. If you want to help ensure your server monitoring provides granular insight into key metrics, it’s highly recommended you invest in professional server monitoring software.
Not every software solution is built the same, so it’s important to invest in the right tool if you want to maintain optimal server health. In this blog, we’ll go over Windows server monitoring solutions and review the best products specifically designed for Windows-based environments.
1. Windows Server Performance Software: SolarWinds AppOptics
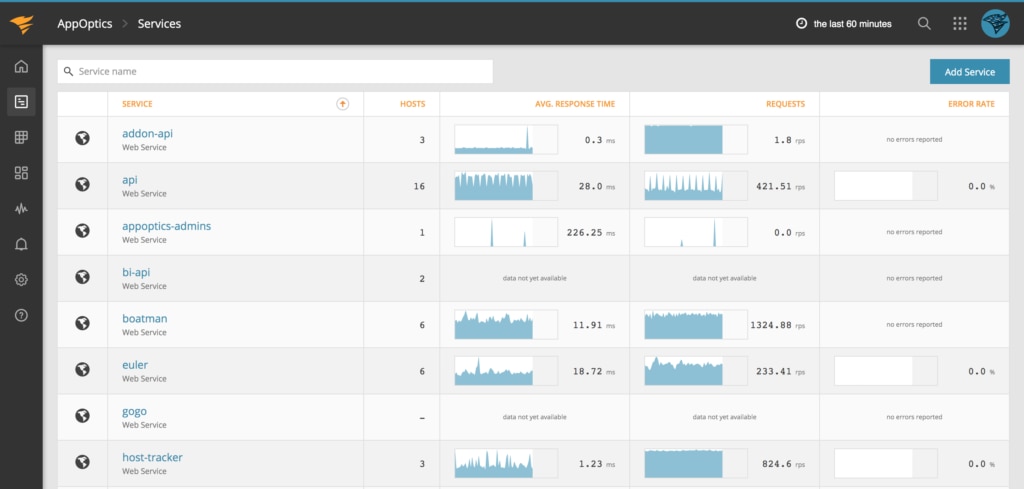
SolarWinds® AppOptics™ is a full-service infrastructure monitoring solution built to help you gain insight into server and infrastructure performance metrics. With AppOptics, users can quickly gain insights into their server performance by using an intuitive, centralized dashboard. The SolarWinds® Snap Agent plugin makes it possible for users to quickly collect, process, and publish data from various Windows servers, all on a single API.
With AppOptics, it’s easy to get insight into the metrics you need. The dashboard supports a robust set of Windows server health information, from CPU and disk storage to IO and memory. It’s also possible to create and monitor custom parameters. What’s more, this software allows users to cross-reference infrastructure and server metrics. This means you can more quickly identify hot spots and mitigate bottlenecks before they affect your end users.
This software also makes it simple to set custom thresholds and alerts that flag potential issues and send notifications to the right person. Integrate the AppOptics alerting system with Slack for seamless usability. With this added flexibility, admins can be sure they receive notifications of potential server problems more quickly, so they can get right to addressing any performance issues.
2. Windows Log Management: SolarWinds Loggly
All admins understand how important log data can be when it comes to monitoring server performance. They also know how time-consuming and tedious it is to keep track of log data in large networks. Unfortunately, most traditional tools aren’t equipped to perform event correlation in modern network environments, where logs might be generated 24/7 in several different formats. But SolarWinds Loggly® can help automate and optimize the monitoring process for even large numbers of logs.
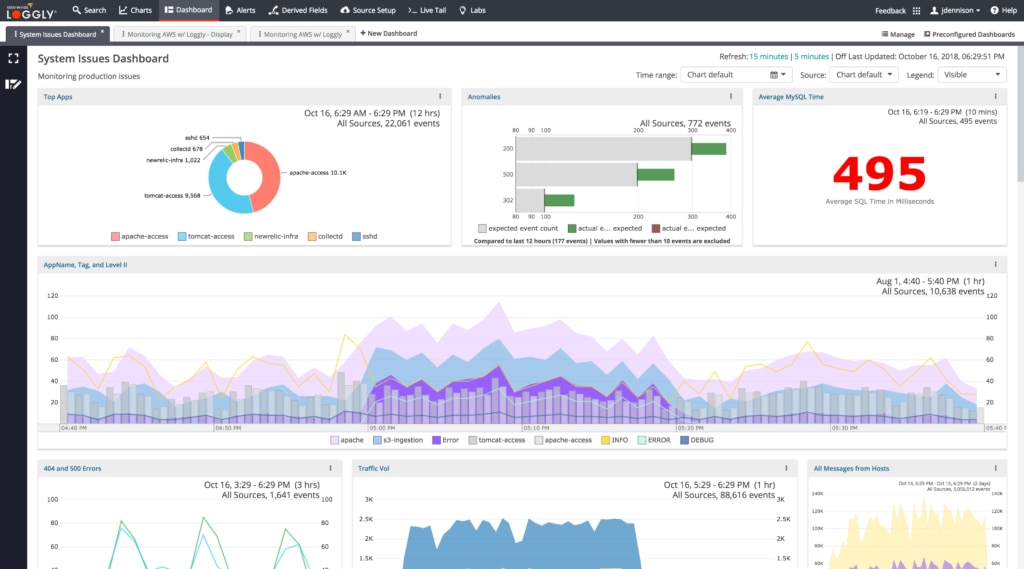
Loggly is a cloud-based log aggregation tool built to support an array of servers, applications, and cloud-based logs. With Loggly, users can centralize their log data with the Windows syslog analyzer, which is quick to install and roll out.
Loggly will store all Windows sylogs in a centralized location, making it easier to correlate events and resolve issues faster. And although Windows systems don’t natively support syslog data, Loggly allows you to use add-ons like NXLog to parse and send syslog data directly to the Loggly suite, letting you analyze it in comparison to other log metrics.
Once your Windows logs are all in one place, it’s significantly easier to help ensure servers are performing up to speed with the help of the dynamic field explorer. This feature enables tech pros to quickly browse and search through their log data. You can even inspect a trail of events when a critical incident occurs, all with the single click of a button.
3. Server Change Monitoring: Netwrix Community Edition
Server configuration monitoring is an important practice for those who want to gain more visibility into their system and server changes. The inability to track user activity can leave your organization vulnerable to potential external and internal threats. That’s why it’s important to be able to see changes and compare configurations in real time.
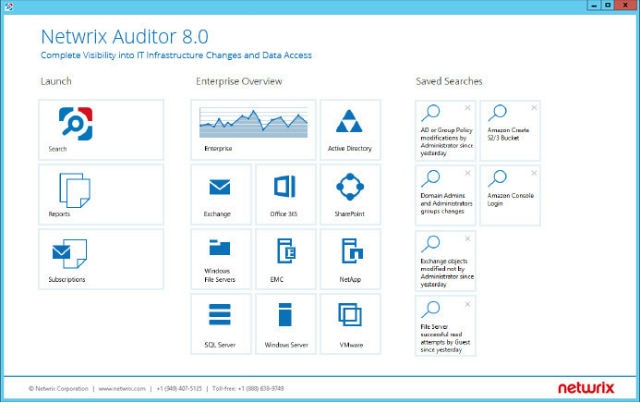
Netwrix Auditor Free Community Edition offers the ability to track changes and access events even in a hybrid cloud IT environment. With this visibility, IT teams don’t have to worry about missing critical changes to file server permissions, Windows server configurations, or other potential threats. And with Netwrix, you can automatically track all changes and access events on your servers and have any important information sent directly to the right tech’s mailbox, according to your schedule.
4. Domain Controller Monitoring: Lepide DC Monitor
Because domain controllers process security authentication requests, it’s important to keep them functioning well if you hope to avoid performance issues.
Lepide DC Monitor is a free software tool designed to make domain controller monitoring easy. It enables users to monitor many different domain controllers all from a single UI. With the tool’s streamlined interface, it’s easier to determine the health and performance of individual domain controllers on a network. It’s built to monitor tons of helpful metrics, from memory and disk utilization to CPU and page reads.
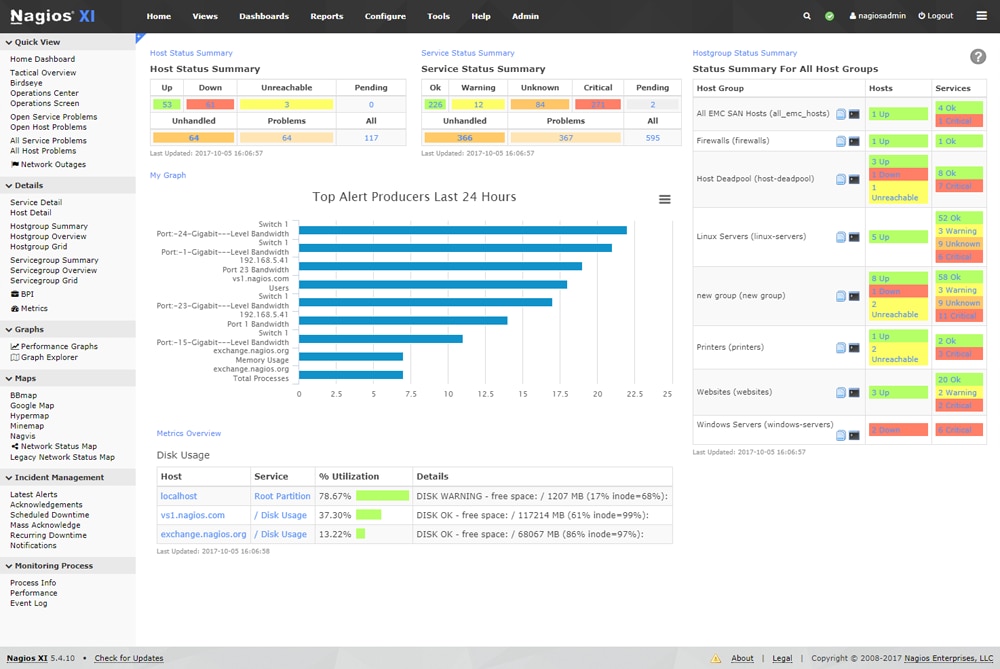
5. Windows Server Monitor (Open Source Option): Nagios
Another reliable network monitor is Nagios, an open-source monitoring suite running on the Linux kernel. Although it’s Linux-based, users can install agents on the platform, allowing them to monitor Windows servers with ease.
Nagios helps users obtain insights into Windows server performance by monitoring a wide array of metrics. From there, users can generate ad hoc reports from even the most granular performance data on any Windows-based OS.
Although Nagios is a solid option, it does have its downsides due to being open source. There are fewer customer support options and it can pose a challenge if you aren’t accustomed to operating Linux-based software.