
Keeping track of everything happening on your operating systems may sound daunting, but the right software allows you to monitor and manage every element and layer of your IT environment. Managing large enterprises and systems means sometimes things just get overloaded and fail. It’s impossible to prevent errors or issues, but you can keep a close eye on your network to troubleshoot as efficiently as possible.
Many businesses provide a guaranteed uptime to their customers and maintaining this isn’t just a matter of keeping promises. Businesses unable to meet their service-level agreements or keep things running smoothly can suffer lost trust from customers, lost revenue, and lost contracts if a customer has a bad experience.
Using an effective and comprehensive tool with good reporting features, alerting abilities, and uptime trackers will help you ensure service levels are met most of the time, and problems don’t affect your end users. By checking measurements constantly and preventing smaller problems from getting out of control, operating system monitoring tools go a long way toward minimizing overall failures and shutdowns of IT environments.
- What Operating Systems Should Be Monitored?
- What Should an OS Monitor Measure?
- OS Monitoring Best Practices
- Best System Monitoring Software—List
What Operating Systems Should Be Monitored?
You might be dealing with several operating systems in your enterprise, and most have tools purpose-built for monitoring them. When it comes to matching your OS with system monitoring software, Linux, Windows, Mac, and Unix each benefit from a range of options. If you’re using a more obscure operating system, you might not have appropriate tools at your disposal.
You’ll likely have luck finding a high-quality, enterprise-level OS monitor if you’re using one of the following systems:
- Windows XP, Vista, 7, 8, 10
- Windows Server 2008, Server 2012, Server 2016
- Windows Management Instrumentation
- Mac Os X
- Unix
- Red Hat Enterprise Linux, Ubuntu Server, Debian, and Fedora
What Should an OS Monitor Measure?
Before you install operating system monitoring software, you need to have a clear idea of the metrics you can and should monitor. These can give you key clues about the performance and health of your system.
- CPU utilization: Depending on which processes are running, your CPU consumption will be higher or lower: a lot of process means a lot of CPU use. If a process has an error and ends up in a hung state, it’ll keep running even when you think you’ve closed the related program. This can keep the CPU running unexpectedly, or could increase CPU usage past a typical point, leading to overheating.
- Network performance: Various aspects of your network can impact operating system performance for end users. This includes faulty network hardware, viruses or malware in the network, incorrect configurations, and protocol overloads or failures. If network bandwidth is high, this can affect all your network traffic and may cause applications or systems to run slowly.
- Memory: If you’re using too much memory at one time, it can affect your operating system, with performance issues or crashes causing major problems.
- Disk drives: If the physical disks you’re accessing for storage are too full, you can end up with high response times whenever you try to retrieve or save data. This can have a big impact on how all of your applications work (read more about checking hard drive health here).
- Events: With all operating systems, you need to monitor event logs, as this is a major factor in keeping your network and infrastructure secure. Unusual event logs or a sudden spike in logs can indicate an error or a network breach.
- OS services: For all operating systems, critical services run in the background—e.g., Windows Active Directory. If one of these services malfunctions or stops working, your whole operating system can stop working as expected.
OS Monitoring Best Practices
Before you start monitoring your operating systems, you need to ensure you have a clear understanding of the best practices involved. You could use the highest-quality OS tools in the world and still not get much out of them if you were using them incorrectly or weren’t monitoring the relevant metrics.
Below are eight key best practices to follow:
- Test configuration and rollout. Before you set up your monitoring system for your entire business, you need to test your configuration on a small number of devices to make sure everything is operating correctly. Have a set rollout process, during which you test changes and problems to see how the monitoring software reacts. Once you feel certain the tool is working as expected and is configured correctly, you can go ahead and roll it out business-wide.
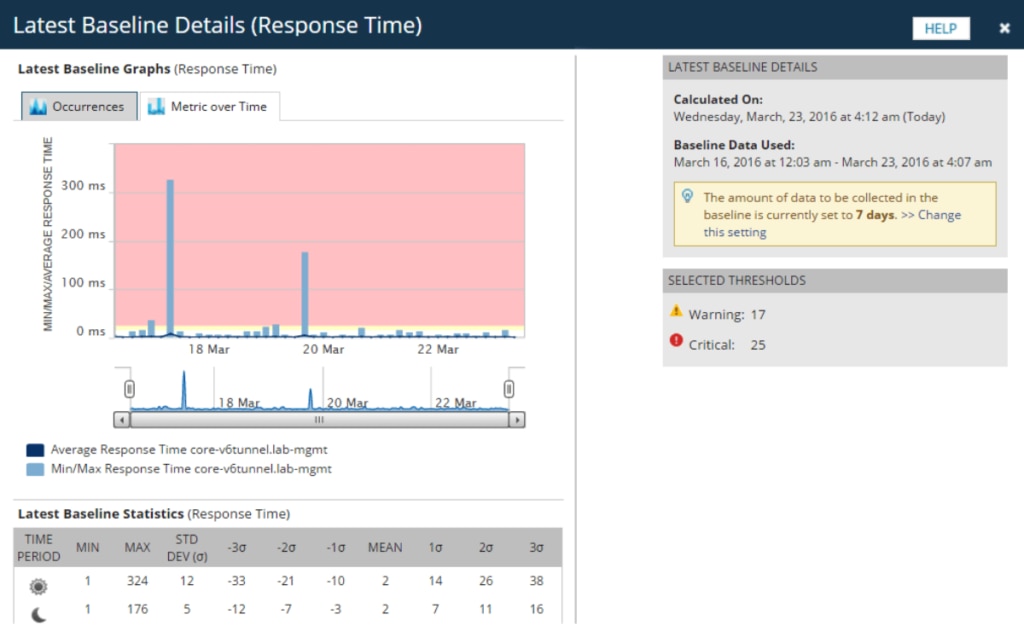
- Set baselines. Once you have your software set up, you need to monitor your systems to set baselines. Assuming no incidents during this time, the measurements you get will likely serve as a clear and accurate baseline for general operating system behavior. You can use these baselines later to detect security or OS health issues.
- Commit to constant monitoring. To get accurate measurements and spot problems clearly and quickly, you need to be monitoring your operating systems constantly. This will help you identify issues as they arise and build a bigger picture of more complex issues, such as potential blind SQL injections or DDoS attacks.
- Implement comprehensive security. The next step is to ensure your system monitoring software is set up as part of a larger, comprehensive security approach. This should include firewalls, network protection, and anti-malware software. OS monitoring software can form part of a system for security, but generally you should have other tools set up too.
- Set up alerts. Your alerts should be set up to focus on the main problems that are likely risks to your business and major hardware issues or declines in OS or hardware health. You can also obtain lists and repositories of common viruses and malware and set up alerts if your system shows any indicators of these issues. Configure OS tools to alert you only to the most necessary data to avoid being overwhelmed.
- Have an escalation plan. Within your business, you need to have escalation processes in place to pass issues on to the relevant people. This boosts the productivity of your team and stops your end users needing to go through an entire chain of people who cannot help them before their problem is solved.
- Complete audits and reports. If you deal with any sensitive data your users access through your operating systems or servers, you need to regularly complete compliance audits to ensure everything is operating as expected. In addition, you should be examining reports from your software regularly to check your configuration is correct, and you haven’t missed any vital alerts.
- Conduct regular reviews. Finally, your configuration, data collection, and monitoring setup should be reviewed frequently, to ensure it’s still working in the most suitable way for your business plans, your risk factors, and your needs.
Best System Monitoring Software
Now I’ll get into my picks for the best monitor program. In operating system contexts today, you need something comprehensive to ensure hybrid infrastructures and complex networks are completely covered. Most of the OS tools on my list provide free trials, so you can try a few to determine which one best suits your needs.
This guide focuses on helping you to identify the best Windows system monitor tool. If you need Mac system monitoring tools, some of these are compatible, while others are Linux or Windows only.
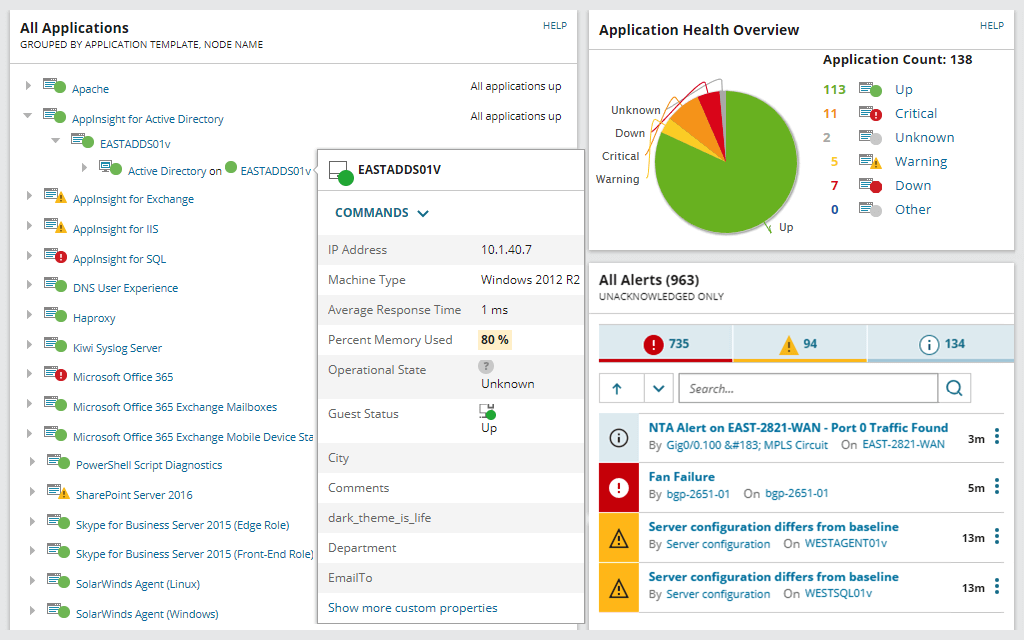
My top choice for operating system monitoring software is SolarWinds® Server & Application Monitor (SAM). In monitoring servers and applications, SAM looks at the metrics discussed above as factors with an impact on an operating system’s ability to function.
For example, SAM can monitor Windows and Unix servers and their physical health, including checking on disk capacity, measuring CPU utilization, and checking whether there’s sufficient virtual memory for the tasks you’re trying to perform. When tracked, these physical metrics can give clues as to why your workstation or server operating system may not be functioning as expected. Especially with historical data, you can more easily see when something is operating outside normal boundaries and resolve it quickly.
SAM includes specific measuring tools and templates for looking at Windows performance, such as page file usage, processor time, pages per second, and disk queue length. This makes it possible to spot rogue processes and stop them before they affect productivity too much. In addition, it can monitor Windows network load balancing, print service, remote desktop service, FTP service, and update service.
SAM’s hardware health monitoring utilities are also robust. They can look at the drivers and firmware you have installed and check hard drive performance, hosted virtual machines, network interfaces, processors, what version of Windows you’re running, and which updates have been applied. Moreover, SAM helps you determine whether system slowdowns are stemming from one greedy or malfunctioning application, or whether the issue originates in your network infrastructure.
Windows is just one of the operating systems SAM can monitor. The tool also includes out-of-the-box templates for Unix and AIX, Solaris, and HP-UX environments. In addition, it has templates for managing various Linux distributions, including Red Hat Enterprise Linux, CentOS, SUSE Linux Enterprise Server, Ubuntu Server, Debian, and Fedora. With this kind of broad applicability, you can use SAM for numerous operating systems, including networks or environments with different operating systems for different tasks. All this information can be displayed in one easy-to-use dashboard, with multiple tabs for switching between different pieces of relevant information.
You can try the full version of SAM free for 30 days.
Network Performance Monitor (NPM) is another great tool from SolarWinds. Any of the devices connected to your network need to be monitored by a network monitoring tool, because what you might think is a problem with your operating system or physical hardware could be a problem with bandwidth or a network slowdown—especially if you use centralized file storage systems accessed through a LAN or WAN. SolarWinds NPM can map your entire network, including all your devices and application dependencies, and provide you with a clear picture of your network topology. This can help you understand how one device can affect another, along with your risk factors if one device or operating system becomes infected with malware.
NPM includes LAN and WAN monitoring and optimization tools to ensure everything is functioning properly, and to help you improve your setup if something isn’t running as well as it could. It includes network uptime and availability tools, so you can pinpoint network spikes and preempt them if necessary. By continuously monitoring all network devices for faults, availability, and performance, you can improve troubleshooting efforts and set alerts to trigger when performance thresholds are met. When troubleshooting an issue for an end user, you want answers fast, and ideally before productivity goes down. These availability tools enable you to quickly determine whether network problems are behind the issue at hand.
Other key features include Wi-Fi analysis, which helps determine whether a device is simply in a low-access zone or whether there are critical issues with Wi-Fi devices, firewalls, or load balancers in your network. Many SolarWinds tools are part of the Orion® Platform, and as such can be used individually or in conjunction with each other. This allows you to mix and match as necessary or choose only the most critical tools to your setup. In combination with other tools, NPM can help you gain a full picture of your operating system and IT environment health, performance, and availability.
Like SAM, NPM has a 30-day free trial available.
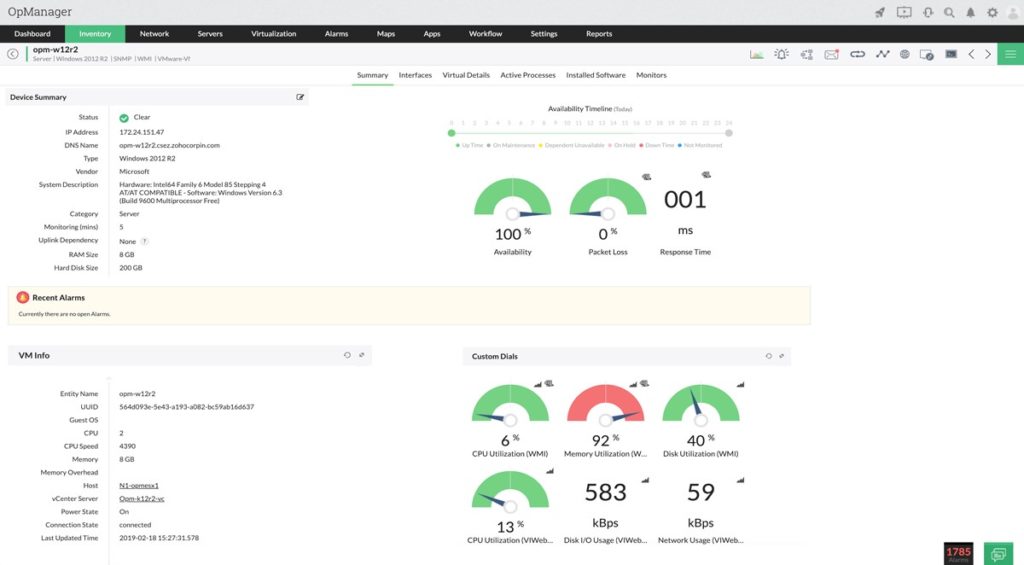
ManageEngine OpManager brings together a range of features in one package. It includes network monitoring, server management, and tools for dealing with fault and performance issues.
Tracking server resource usage can reveal the source of problems within your operating system. OpManager can keep tabs on your CPU usage, memory consumption, I/O, network, disk usage, and processes, to determine where physical health issues lie. Within CPU usage, for example, it can measure utilization, speed, idle time, and processor time. In addition, OpManager monitors Windows services to check everything is functioning correctly, with a significant amount of this monitoring done out-of-the-box. It processes Windows event logs to check for security breaches, and monitors guest operating systems hosted virtually to ensure they’re functioning correctly.
OpManager, like SolarWinds NPM, includes network monitoring tools for determining whether poor operating system performance is the result of bandwidth or network component issues. It also monitors your WAN and LAN closely to check for network performance issues and reliability. Each of these metrics can be measured over the long term to set historical benchmarks, and you can establish alerts to let you know when an issue has occurred.
Several add-ons and plugins are available for use with OpManager, including plugins for network traffic analysis, network configuration, application performance management, and firewall management.
You can access a free trial of OpManager for 30 days, or you can download the free version with limited features.
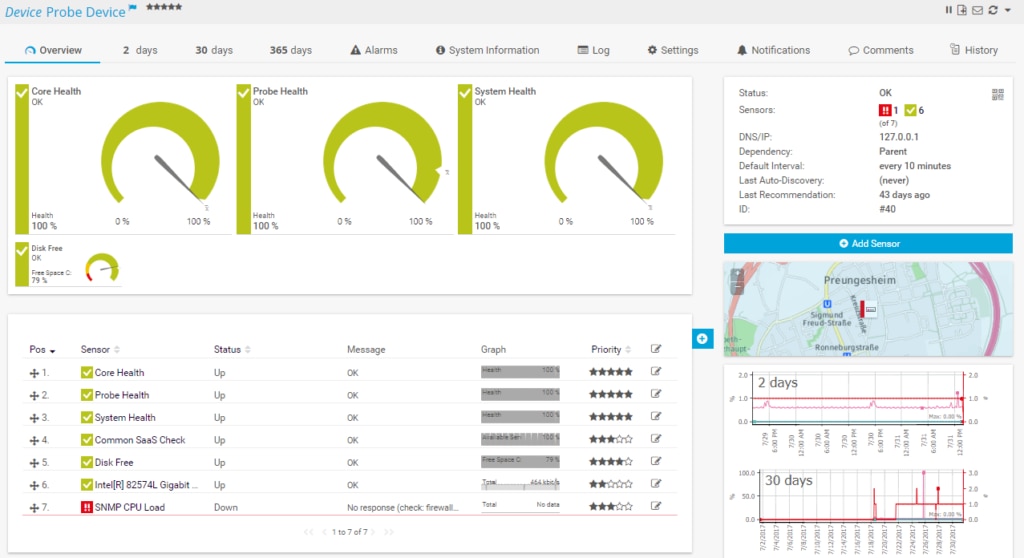
The next tool on my list is Paessler PRTG. It has several user interfaces, including the desktop app, a web interface, and apps for both iOS and Android. This means you can access the PRTG features wherever you are, and you can also use multiple interfaces simultaneously.
PRTG has flexible and easy-to-use alerting you can use through your normal client, or through SMS and email if you prefer. You can schedule alerts and set up systems, so you receive high-priority alerts at your preferred times. If you don’t want to receive floods of alerts when an issue occurs, dependencies and acknowledging can be used to streamline the alerting system.
One of the cool things about PRTG is its interactive and good-looking graphics and maps, as well as various dashboards to show live status information. You can create maps of your entire network and all your devices with the tool’s map designer. The map designer also allows you to use various map objects to display the status of devices, so you can get a full picture of your network layout and health.
You can use PRTG for distributed networks, with the ability to apply remote probes in different geographic locations. You can also spread the monitoring load by spreading probes out as much as you like. PRTG comes with a set of reporting capabilities, and you can request reports on demand or be provided with regular reports depending on your needs.
PRTG offers a 30-day free trial.
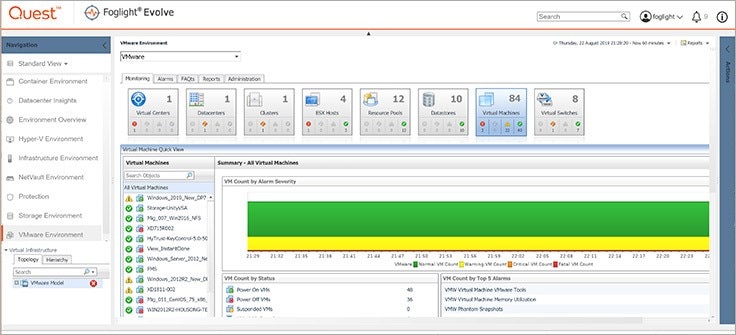
Quest Foglight is another good example of OS monitoring software. It provides monitoring across physical, virtual, and cloud environments, with the aim of serving as a complete monitoring service. It can monitor physical operating systems and virtual ones, and can help monitor VMware, Hyper-V, Azure, and AWS along with physical servers and the operating systems they use.
There are multiple versions of Foglight. Which one you choose will depend on whether you want to primarily monitor cloud environments with virtual desktops or you’re looking more at a server or database monitoring solution. Whether you use Oracle, SQL Server, MongoDB, PostgreSQL, MySQL, or Cassandra, Foglight can provide monitoring and performance optimization. It keeps an eye on every application, database, network device, and server tied in to your operating systems and shows you performance metrics for your entire IT environment in a centralized location with multiple dashboards.
Like other tools, Foglight measures storage capacity trends, top I/O users, memory availability and consumption, top system users, and CPU utilization. Keeping track of these metrics helps ensure your operating systems and hosts are under control and problems are spotted as early as possible.
Foglight is available as a 30-day free trial.
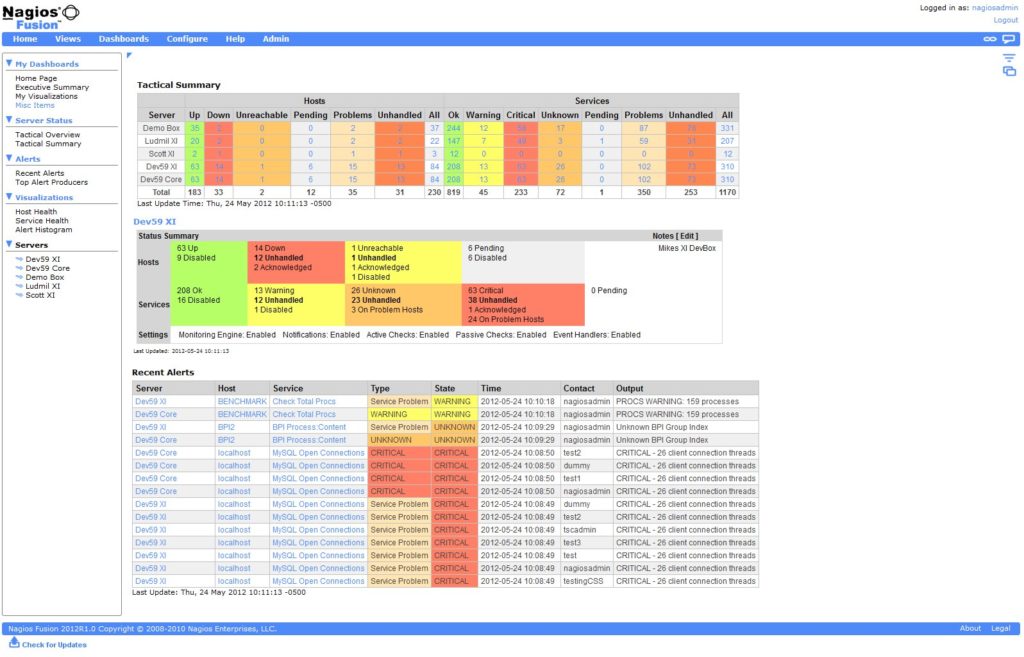
The final tool I want to talk about is Nagios XI. Nagios has a powerful engine designed for IT infrastructure and systems monitoring, with a high degree of scalability as your network grows. It provides several dashboards, with centralized information, so you can get a clear overview of your entire system at a glance. You can highly customize the GUI with mix-and-match layout and design preferences on a per-user basis, which helps make this tool your own.
Nagios includes infrastructure management and mapping, giving you a clear picture of network connections and dependencies potentially affecting the performance of any individual workstation or device. It also carefully monitors infrastructure metrics pertaining to applications, services, operating systems, and network protocols.
Nagios XI offers a free trial, good for 60 days. You can also access an online demo.
How to Choose the Best System Monitoring Software
There’s no shortage of good-quality operating system monitoring software on the market. Hopefully after reading this guide, you’re equipped to make an informed decision, accounting for your operating system and organizational priorities. My top pick is SolarWinds Server & Application Monitor. It provides a quick and easy setup for many useful features, which together enable you to consistently and comprehensively monitor your operating systems and troubleshoot issues well before they affect your end users. By taking advantage of the free trial, you can test the full software to see if it works for you.