
When a reporting application issue occurs and users begin to complain their screens are frozen, it could be a blocking problem. This is especially likely if the issue isn’t caused by an overactive A/C vent and if users report seeing an SQL-related timeout issue.
As a database administrator, you need to conduct some reactive, investigative work if blocking issues have taken you by surprise. Doing so can help you understand which processes are being blocked, which sessions are responsible for the blocking, which SQL Server was running at the time, and which locks were involved.
Ideally, you’ve already established SQL Server monitoring practices or implemented robust SQL Server monitoring tools. If you’re using a SQL Server monitoring tool, you should’ve received a notification giving you access to relevant diagnostic data. When you have an effective tool at your disposal, you can resolve issues before a help desk ticket is even registered.
This guide will help you understand what causes blocking, how to find blocking in SQL Server, and how to solve blocking issues. It’ll also recommend solutions to help you troubleshoot and resolve SQL Server blocking chain issues.
-
- What Causes SQL Server Blocking Chain Issues?
- The ACID Test
- The Impact of SQL Server Blocking Chain Issues
- Causes of Severe Locking Problems
- Blocking Issues and Solutions
- Choosing the Right SQL Server Blocking Chain Tool
- How to Find Blocking in SQL Server With SolarWinds DPA
- Getting Started With SQL Server Blocking Chain Analysis

What Causes SQL Server Blocking Chain Issues?
If you’re wondering how to find blocking in SQL Server, you should start by developing an understanding of what causes SQL Server blocking chain issues.
In busy databases, multiple user transactions often compete for access to the same indexes and tables. Typically, SQL Server mediates the access to shared resources with locks. Blocking happens when one or more sessions ask for a resource lock—such as a page, table, or row—but SQL Server is unable to grant it because another session already holds a lock on the resource.
Blocks are the logical result of locks being issued against various database objects. If a request is made against an object that already has a lock issued against it, then the request will be put on hold until the original lock is removed. Blocking refers to this delay or prevention of a transaction.
For example, let’s say request A is trying to insert a row into a specific table. Before request A is completed, however, request B submits an update to the same table. If the row being requested by request A is impacted by request B, then a block will occur. This is because the row impacted by request A has an exclusive lock issued against it for the full duration of the transaction.
Locking and blocking processes usually don’t last long and are entirely normal. Sometimes, locking and blocking are even desirable, as they contribute to the overall integrity of the database. Blocking helps ensure, for instance, a transaction doesn’t read data considered to be in flux. In other words, blocking prevents something often referred to as “dirty reads.” It ensures two distinct transactions are unable to modify the same row of data. Without blocking, this could cause data corruption.
Locking is an essential part of successful transaction processing for any relational database management system (RDBMS) because it helps maintain data integrity. An RDBMS maintains data integrity by ensuring every transaction passes the ACID test, which addresses object locking.
The ACID Test
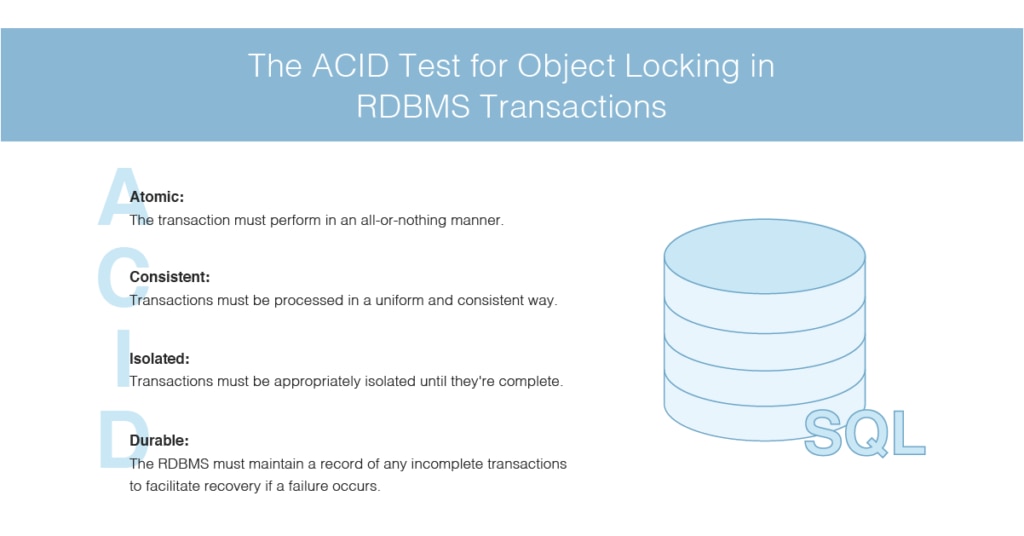
The four criteria for the ACID test are as follows:
- Atomic: The transaction must perform in an all-or-nothing manner.
- Consistent: Transactions must be processed in a uniform and consistent way.
- Isolated: Transactions must be appropriately isolated until they’re complete.
- Durable: The RDBMS must maintain a record of any incomplete transactions to facilitate recovery if a failure occurs.
The isolation element of the ACID test is addressed by object locking. This usually involves locking one or more rows of data until the associated transactions are finished. Object locking stops all other processes from being able to modify the objects until the lock has been lifted.
The Impact of SQL Server Blocking Chain Issues
Although they’re necessary and desirable operational characteristics of a database, locking and blocking can negatively impact the performance of many user processes. High levels of blocking can become a major problem when left unresolved, as it can affect an organization’s ability to keep its data current. It can also impact end users, such as clients visiting an organization’s website.
One of the most common results of high levels of blocking is high SQL Server wait counts. These high wait counts cause slow response times to database requests.
In the most severe cases, numerous sessions can be blocked at different points in a lengthy blocking chain, which causes SQL Server responsiveness to dramatically decrease. This situation is often mistakenly thought of as “deadlock.” However, there’s a key difference between deadlock and blocking. While deadlock causes a specific error (with one of the transactions being rolled back), blocking doesn’t raise errors no matter how severe it is. The session at the head of a blocking chain won’t be awaiting a lock. Instead, it might be waiting for memory allocation, I/O, or a latch. The blocking chain will clear when the resource becomes available, and the head blocker will then be able to complete its processes.
Causes of Severe Locking Problems
Locking is unavoidable in SQL Server. It happens when a session maintains a lock on a resource while other sessions try to simultaneously acquire conflicting locks on the resource. The second session must wait on one of the LCK_M wait types. Under certain conditions, this can severely degrade performance. Serious locking problems can be caused by one or both of the following circumstances:
- A session maintains locks for a long period of time before releasing them. This usually occurs when a session acquires locks and tries to execute different, inefficient SQL statements before the locks are released. Generally, this locking type fixes itself over time, but it can result in long waits depending on the execution times associated with the inefficient SQL statements.
- A session maintains locks and doesn’t release them. This may not resolve itself, and it can prevent resource access on an indefinite basis. To release these lock types, you may have to terminate the session entirely.
Blocking Issues and Solutions
One of the most common blocking issues is caused by long and inefficient SQL statements running while locks are being maintained. There are two steps involved with rectifying this:
- Optimize the poorly performing SQL statements so locks are kept for the shortest time possible.
- Identify whether the locks can be released before the inefficient SQL statement is executed by the session.
For example, if locks are acquired because a DELETE statement is being executed and a SELECT statement then attempts to perform a complete table scan, you should determine whether it’s possible to execute a COMMIT statement between them. This should help the locks release earlier.
Sleeping sessions that have lost track of the nesting level of the transaction are another example of a common blocking issue. If an application cancels a SQL statement or is timed out but doesn’t issue a COMMIT or ROLLBACK statement, then resources could remain locked indefinitely. The solution to this is as follows:
- Following any error, submit an IF@@TRANCOUNT > 0 ROLLBACK TRAN statement via the client application’s error handler.
- For the connection, use SET XACT_ABORT ON. This should also be used in any stored procedures that start transactions and aren’t cleaning up after an error. If a run-time error occurs, this setting will ensure any open transactions are aborted and return control to the client.
- When connection pooling is being used in an application that opens the connection and runs a limited number of queries before returning the connection to the pool, then you should temporarily disable connection pooling. This may be the case for web-based applications. Disabling the connection pool may solve the issue until the client application has been reconfigured to manage errors more appropriately.
When connection pooling is disabled, the SQL Server connection is physically logged out, resulting in the server rolling back any open transactions. - When connection pooling is enabled and SQL Server 2000 is the destination server, you should try upgrading the client computer to MDAC 2.6 or a later version. This version of MDAC adds code to the OLE DB provider and ODBC driver, resetting the connection prior to reuse.
Bear in mind the connection is not reset until it’s been reused. When a user opens a transaction and releases the connection to the pool, it may not be reused for several seconds. - If the root cause of the issue is inefficient SQL statements resulting in queries timing out, then tune the responsible SQL statements.
One issue many SQL Server users encounter is applications not fetching all result rows in their complete form. There’s a simple, one-step solution to this problem:
- When a query has been sent to the server, all applications must be able to fetch all result rows to completion. If this doesn’t happen, locks can be kept on tables, which results in blocking for other users.
Another prominent blocking issue for SQL Server involves sessions rolling back data. If a data modification query must be rolled back, this can take a significant amount of time. Oftentimes, data modification queries can’t be rolled back any quicker than the initially applied modifications. Given the importance of rollback, SQL Server marks the session in a rollback state, so it can’t be selected as a deadlock victim or “killed.” In this instance, the ROLLBACK status will be indicated in the sysprocesses status column. This will also appear in the sp_who output. - Unfortunately, there’s no surefire solution to this problem. You’ll have to wait for the session to finish rolling back the implemented modifications.
Orphaned sessions are a common blocking problem. If the client workstation is restarted or the client application crashes, the network session to the server will not necessarily be canceled instantly. As far as the server is aware, the client may still appear to be present, and all locks will be retained. - In this instance, if the client application has disconnected without cleaning up its resources, use the KILL command to end the session.
Choosing the Right SQL Server Blocking Chain Tool
SolarWinds Database Performance Analyzer (DPA)
SolarWinds Database Performance Analyzer (DPA) is a database management software built for SQL query performance monitoring, analysis, and tuning. It’s a highly scalable, user-friendly tool offering a range of sophisticated features. It allows for easy drill-in and context setting, and it provides consistent navigation, so minimal training or experience with IT software is required.
DPA gives you insight into what’s being blocked and the root cause of the block, and it provides you with the information needed to optimize your indexes, database, and queries. It alerts you to SQL deadlocks and identifies failed processes, giving you complete visibility. DPA captures deadlock data as XML files and allows you to download them so you can view them within the SQL Server Management Studio. This provides you with comprehensive and easily accessible visibility.
You can also easily identify the root blockers and cumulative impact on response times. DPA calculates the total impact of a root blocker down the blocking chain so you can focus your tuning efforts on the queries needing the most immediate attention. This saves time and helps you clear blocks faster. DPA offers complete visibility, letting you see into queries and programs waiting on blockers and slowing transactions.
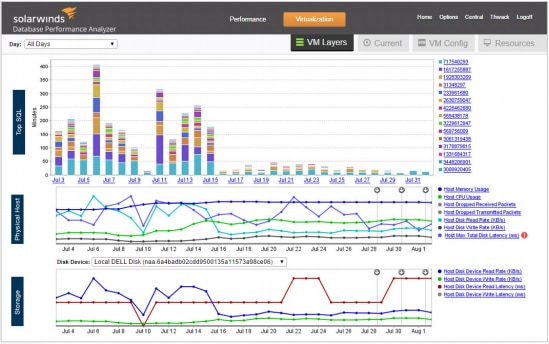
One of the best features in DPA is its advanced response time analysis, which allows you to rapidly analyze SQL statements. This feature gives you insight into wait time and response time, helping you identify problematic SQL queries and index recommendations as quickly as possible. DPA collates the data associated with your SQL statements and ranks them according to response time.
This data is displayed in graphs and charts, making it easier to interpret them at a glance. The graphs are color-coded by the type of wait, and DPA gives you the option to see more detailed information and potential resolution strategies.
Other DPA features include the following:
- Real-time SQL Server monitoring
- SQL database server performance tuning
- SQL performance analysis capabilities
- SQL Server indexation
- SQL Server memory usage optimization
- MySQL reporting solution
- MySQL query analyzer and optimizer
This list is by no means exhaustive. DPA is one of the most effective tools for rectifying locking and blocking issues. To make the most of the software, follow the guidelines below.
SolarWinds® SQL Sentry
SQL Sentry is built to help you more easily tackle performance problems and effectively monitor SQL Server for locking issues. It can be difficult to troubleshoot the issues after they have occurred. However, SQL Sentry allows users to review performance over a period of time and identify when the issue occurred and troubleshoot it immediately.
Other SQL Sentry features include:
- Top SQL and SQL Server blocking views – See specific moments in time, what queries are running, and review historical blocking
- Baselining – Set individual baselines, and compare what’s on screen to what’s expected
- Read-only views – Grant read-only access to users, allowing support teams the ability to review dashboards as well
A free 14-day trial of SQL Sentry is available to download.
How to Find Blocking in SQL Server With SolarWinds DPA
SolarWinds DPA monitors SQL Server instances on a continuous basis, collecting data on any locking issues. Blocking issues usually manifest as sessions and SQL statements accumulating high wait times for LCK_M wait types. You can use DPA to collect blocking session details and waiter session details—this includes information on the SQL statements executed and wait time accumulated while blocking other sessions as well as the SQL statements being blocked and the associated wait times.
When endeavoring to rectify blocking problems, you can use DPA to capture key information by following these steps:
- Identify where the blocking instance occurred and drill into the day and time frame.
- Go to the “Blockers” tab, where you’ll see the session/SPID at the top of the blocking tree. If you can see multiple top-level blockers, this means more than one session has acted as a blocker during the time frame selected. The “Details” link for the blocking sessions will show the top SQL statements executed while other sessions were being blocked.
If excessive wait times have occurred for one or more statements, you should tune the affected statements. This can help reduce the amount of time the session holds on to the locks. The faster the statements can be executed, the sooner the blocking session will release the locks. It’s also possible the blocking session is idle, meaning it was sleeping during the selected time frame. You might need to terminate the session to release the locks. - Lastly, expand the main blocking session and you’ll see a list of all the sessions waiting for it during the time frame. The SQL link alongside each session displays the statements trying to acquire locks held by the main blocking session.

Getting Started With SQL Server Blocking Chain Analysis
Locks and blocks are a normal (and desirable) functionality of SQL Server databases. Unfortunately, keeping blocks from impacting performance—and identifying the root cause of a block—can be challenging. To save yourself time and frustration, I recommend employing SolarWinds DPA to help you find and solve blocking chain issues in SQL Server.
This tool was designed to scale with your business, so it’s suitable for small and large enterprises. With minimal training required, you can get started right away; there’s even a 14-day free trial available to download.