
Oracle database performance tuning is an important part of facilitating and maintaining rapid data retrieval and application functionality. For database administrators (DBAs), finding Oracle database performance issues and solutions is key to their role. To do their job effectively, DBAs must have a comprehensive understanding of how their database is organized, and how all of its components work together to meet their business goals. This includes knowledge of both the database itself and the computer language designed to retrieve, remove, and alter information within it.
This guide provides a set of Oracle database performance tuning best practices to assist DBAs in identifying Oracle database performance issues and solutions and optimizing overall performance. It includes tips for SQL query performance tuning, and a look at how Oracle database performance tuning tools can help in achieving optimization. For those who don’t have time to read the full guide, SolarWinds® Database Performance Analyzer is my top recommendation.
Understanding Oracle
The Basics of Oracle Database Performance Tuning
Oracle Database Performance Tuning Best Practices
SQL Query Performance Tuning Tips
Oracle Database Performance Tuning Tools
Getting Started With Oracle Database Performance Tuning

Understanding Oracle
Oracle is a relational database management system that uses Structured Query Language (SQL) to facilitate communication between the database and applications. Before we dive into the basics of Oracle and Oracle database performance tuning, it’s important to understand the terms involved.
What Is a Relational Database?
A relational database is an information system. In other words, it’s a computerized method of using and storing information.
Relational databases are designed to store, retrieve, and consolidate information as required, on behalf of applications. For example, a company might store customer personal data in a database. A segmentation application could then query the database for the phone numbers of customers who have made a recent purchase. This extracted information could be used to target a specific customer group.
A relational database stores information in tables, which are referred to as “relations.” This is similar to a standard spreadsheet: rows represent individual entries, and columns are “fields” with varying attributes.
What Is a Relational Database Management System?
A relational database management system (RDBMS) is software designed to generate and manage relational databases. Oracle defines a database management system as having several defining features, as follows:
- Kernel code: This determines the settings of the system and allocates memory
- Data dictionary: The data dictionary is a repository of metadata offering a real-time view of the database’s information
- Query language: The query language is what allows database information to be accessed by applications
What Is SQL?
The query language used by Oracle is SQL, which is a popular database language for many reasons. SQL allows you to input, alter, retrieve, and remove data in a database, which gives you a significant amount of control. It allows DBAs to attribute and revoke database access and can be used to create functions and views.
One of the benefits of SQL is it’s nonprocedural. This means SQL statements inform the database management system of what should be done, instead of defining a course of action. SQL is easy to learn and can be embedded within alternative host languages, making it a highly flexible database language choice.
What Is Oracle?
Oracle is a portable RDBMS available on every major platform, including Windows and Unix. Its architecture is relatively generalized, which means learning how to use it with each of the platforms isn’t too tricky. An Oracle database is made up of several logical storage structures, like schema objects, data blocks, and segments. Physical storage space is allocated and unallocated logically within the data files, as data blocks.
There are three types of physical database files:
- Control files: The control file outlines the database’s physical structure, containing details like the name of the database and the time of its creation
- Data files: Data is stored within the data files and represented in the form of indexes or tables
- Redo logs: Redo logs record all database alterations—there must be at least two redo logs in every Oracle database for it to function properly
When the database is initialized, background processes are created. Some of these background processes are necessary for normal system operation, while others are used to facilitate recovery and perform maintenance operations.
The Oracle database uses two main types of memory structures for retrieving and storing system data:
- Program Global Area (PGA): The Program Global Area is a collection of memory regions that aren’t shared, each of which contains data and control information for a single server process. When a server process is initiated, PGA memory is allocated.
- System Global Area (SGA): The System Global Area is a memory region that is shared, used to hold the database’s data and internal control structures.
Basics of Oracle Database Performance Tuning
Performance tuning in Oracle involves optimizing the performance of the database by streamlining the SQL statement execution process. To put it simply, Oracle database performance tuning makes accessing and changing database information easier, resulting in improved application operations and query response times.
Oracle tuning is used to troubleshoot performance issues. When a network user reports slow-loading pages and application delays, it can often be difficult for DBAs to identify the root cause. Database bottlenecks can be caused by multiple system elements, including the computer, the optimizer, and query statement coding. Oracle database performance issues and solutions become clearer when tuning best practices are implemented.
To effectively troubleshoot the cause of an issue, DBAs must consider all the components of their relationship database management system. This can be a time-consuming and frustrating process, with comprehensive performance tuning operations touching on every component of the system from top to bottom. This starts with system-level tuning.
Without system-level tuning of the objects, instances, and servers in your database, individual tuning of SQL statements will be largely obsolete. DBAs should assess the following before tuning individual SQL statements:
- Instance settings
- Input and output measures
- Optimizer statistics and parameters
If these components aren’t assessed appropriately, SQL tuning may be reversed by the optimizer later.
Oracle Database Performance Tuning Best Practices
There are six best practices DBAs should follow when conducting Oracle database performance tuning:
- Improving SQL execution efficiency
- Increasing availability
- Managing operating system resources
- Optimizing storage performance
- Using the query optimizer
- Using and configuring memory
Best Practice One: Improving SQL Execution Efficiency
Understanding how to deliver SQL execution efficiency is a crucial part of the system development process. It’s especially important during the design stage. Every single database connection comes at a cost, which is why DBAs should always endeavor to use the smallest number of concurrent database connections as possible without compromising the system. If you’re using multi-tiered applications, you should ensure database connections are pooled together.
To reduce parsing activity, it’s important for user connections to be appropriately maintained. Parsing refers to the process of creating an execution strategy by analyzing SQL statements. This involves loading shared structures, in addition to checking syntax and security.
A “hard parse” involves performing all the operations associated with a parse. Hard parses are resource-intensive and difficult to scale. Soft parses, on the other hand, require security checks which can unnecessarily consume your system’s resources.
In other words, parses aren’t ideal, which is why they should be reduced as much as possible. To do this, developers should design applications capable of parsing SQL statements a single time, and then executing them multiple times. You can use cursors to achieve this. When opening and re-executing cursors, developers should ensure SQL statements are shared with the shared pool. Bind variables, which represent query parts, can be used to do this.
Best Practice Two: Increasing Availability
Enterprise applications are expected to offer maximum availability, with near constant access. To achieve this, safeguards should be established to protect the application from unanticipated downtime. Typically, this involves employing architecture with redundant elements. Oracle provides a blueprint called Maximum Availability Architecture, which features all the components required to eradicate data center complexity.
Oracle’s Maximum Availability Architecture uses redundant components to boost the efficiency of production systems. Real Application Clusters offer great scalability possibilities for enterprise applications and protect against potential server failures. The architecture uses built-in Data Guard technology, which facilitates effective disaster recovery, along with an Active Data Guard, which allows certain processes to be offloaded to standby systems. This includes backup and reporting operations.
Within the Data Guard environment, users can be easily transferred between standby and production databases. Both the operating system and database version variations are supported, which means a standby database can be upgraded, along with any users of the earlier version.
Best Practice Three: Managing Operating System Resources
There are numerous causes of operating system performance issues. Many are tied up with scheduling, process, and memory management. If you’ve tuned the Oracle database instance and find you still need to boost performance, then you may lower the system time. Ensure there’s a sufficient amount of swap space, CPU power, and input/output (I/O) bandwidth.
Many platforms provide resource managers for operating systems, which can reduce the impact of peak load use patterns. It’s important to note operating system resource managers aren’t the same as domains, which can create entirely distinct environments within a single system. Provided the partitioned memory resource allocation is performing appropriately, Oracle is able to run within domains, and other constructs using a less partitioning model. The allocation of resources within a global pool is usually prioritized by administrators.
If you have nodes with multiple instances and intend on distributing resources between them, you should assign each instance to a resource manager group. If you plan on running numerous instances in the managed entity, the distribution of CPU resources among instances should be managed by instance caging. When CPU resources are being managed, the Oracle Database Resource Manager requires a fixed number of CPU resources for each instance. When instance caging is used, the Resource Manager assumes the amount of available CPU resources is equal to the total number of CPUs within the managed entity.
If you think there might be a CPU issue to address, you’ll need to identify whether sufficient CPU resources are available. It’s essential to recognize when too many resources are being consumed by the system. Oracle features three utilities—Statspack, UTLBSTAT, and Automatic Workload Repository—which can be useful for capturing various workload snapshots.
While 90% CPU utilization with 10% waiting time may be acceptable during peak hours, it’s important to note there’s a significant problem if your system displays high use during ordinary workload levels.
Best Practice Four: Optimizing Storage Performance
IT management teams will always strive to minimize the need to use additional storage. If reducing storage costs is a priority, you can do so by partitioning underneath big databases.
Typically, enterprises employ two storage tiers. One is a high-end storage array used by mission critial applications. The second is a lower-cost storage array used by less demanding applications. Most databases include a combination of active data (such as call records) and more passive data (like orders taken in the previous year). Active data might only take up 5% of your database storage.
Sizing your disk storage to match the workload is a key part of optimizing your storage performance. Random I/O operations are actuated by deletes, inserts, and updates activated by queries scanning the table in bulk portions. These random I/O operations are calculated in I/O operations per second, while sequential I/O operations are calculated as several megabytes scanned per second (MB/s). Storage arrays should be sized according to the number of I/O operations per second they can deliver.
You can work out the total number of I/O operations per second and MB/s required for your existing databases by checking the workload repository reports.
Best Practice Five: Using the Query Optimizer
The query optimizer is a built-in software component responsible for choosing how SQL statements are executed. They can be executed by a database in multiple ways, including through nested loops, hash joins, index scans, and full table scans. While examining the execution plan, the query optimizer can acknowledge numerous factors related to the conditions and objects within a query. This is a key part of SQL processing, and when done right, it can significantly reduce execution time.
There are three main components of a query optimizer:
- Query transformer: Every query portion is a query block. The input into the query transformer is a parsed query defined by a collection of query blocks. The transformer is responsible for determining whether rewriting the existing statements into semantically equivalent statements is beneficial.
- Estimator: The estimator examines the cost of the execution plan. It uses the statistics available to make its calculations. Ultimately, the estimator can improve accuracy.
- Plan generator: The plan generator considers a range of plans for a query block by testing different join methods and access paths. The plan with the lowest cost is then selected.
Best Practice Six: Using and Configuring Memory
Oracle usually advises users to employ automatic memory management, but you also have the option of altering memory pools manually. Information is stored on disk and in memory caches. Memory access is faster than disk access, which means the disk access can increase the amount of CPU resources required.
To boost performance, you can configure your system so the data requests of frequently accessed objects are managed by memory instead of disk. Keep in mind the aim is to reduce the physical I/O overhead as much as possible, by optimizing the data retrieval process.
Oracle’s Automatic Shared Memory Management feature can make SGA configuration much simpler. To make the most of it, you’ll need to set your SGA_TARGET initialization parameter to a non-zero value. You should also set the STATISTICS_LEVEL parameter to TYPICAL and the SGA_TARGET parameter to the amount of memory you’d like allocated for the SGA.
Appropriate configuration and use of the buffer cache can also boost database performance. Oracle will bypass the buffer cache for specific operations, including parallel reads. However, you can use the buffer cache by tuning SQL statements for the application. If you’re using parallel queries, alter your configurations so the buffer cache is used instead of direct reads being performed into the PGA. If your server has a large memory capacity, this configuration is especially useful.
You can analyze buffer cache activity by using the Buffer Cache Hit Ratio or V$DB_CACHE_ADVICE. If you need to use the latter, then the DB_CACHE_ADVICE parameter should be ON. The buffer cache hit ratio expresses how often a requested block could be detected in the buffer cache without the disk being accessed. This ratio should be used to verify the physical I/O.
The configuration of your redo log buffer is another important element to consider. Redo data is created when a server process alters data blocks in the buffer cache. While the log writer writes the redo entries into a redo log, the new entries can be copied over earlier entries in the memory because of user processes.
Nine SQL Query Performance Tuning Tips
The above list of Oracle database performance tuning best practices takes a broad approach and isn’t exhaustive by any means. This section digs deeper to offer nine tips specific to SQL query performance tuning.
- Remember SQL query performance tuning is an ongoing process, and there’s always something to do. It can feel never-ending, which is why it’s important to isolate high-impact SQL statements at the start of the tuning process. These cost-intensive queries are the ones executed most regularly and require the most I/O and database activity. Prioritizing the isolation of these high-impact SQL statements will offer the greatest performance improvement returns.
- Always try to minimize the amount of data to be scanned during an operation. Many query statements will send a prompt to the database asking it to perform a full-table scan. This uses more I/O than is necessary and can slow down operations. You can streamline the process of data retrieval by doing the following:
- Add indexes to tables if the data you need to access comprises less than 5% of the total data stored. Don’t apply this tip to small tables, which are searched in full more expediently.
- Avoid including the asterisk symbol (*) in your SELECT statement queries, unless it is necessary for retrieving data. Note this symbol will load the system.
- Restrict the size of the data set by using filters in WHERE clauses.
- In a column-oriented system, only select the columns needed to perform the query.
- Delete unnecessary tables from query statements.
- Use EXISTS in subqueries. This tells Oracle it can halt the search, rather than complete a full-table scan by default, when a match is discovered.
- Don’t use indexes in tables undergoing a large number of INSERT or UPDATE operations, as indexes can reduce the speed of data input. It’s also recommended you drop indexes when conducting batch updates or insertions. Instead, re-create the indexes after one batch event, or avoid indexes on tables regularly experiencing batch loads.
- Don’t mix data types and avoid converting numbers to characters.
- In some cases, it can be easier to create a new field than to perform a calculation function on a WHERE or JOIN clause. The new field should contain the calculated value, which the statement would SELECT instead of making the calculation itself.
- Go through your SQL syntax and ensure statements have been written so they’re aligned with the data structure.
- By using procedures instead of single statements, you can institute a protocol. A procedure is a collection of statements. Using a procedure can reduce the cost of executing a query occurring regularly.
- Use global temporary tables where possible. This simplifies complicated summarization queries and can improve database performance.
- Make tuning a routine process. Habitual maintenance can prevent database performance from deteriorating over time.

Oracle Database Performance Tuning Tools
Implementing these Oracle database performance tuning best practices manually is difficult. Fortunately, there are plenty of Oracle database performance tuning tools designed to streamline your tuning operations. These tools can automate database performance tracking and help you identify the source of performance bottlenecks.
One of the best Oracle database performance tuning tools currently available is SolarWinds Database Performance Analyzer (DPA). This tool was designed specifically for Oracle and delivers a range of highly advanced features through a simple user interface. DPA offers response-time analytics, which help you correlate activity, SQL statements, wait events, and numerous other dimensions. With the ability to drill down into database monitoring data, identifying the root cause of database slowdowns becomes simple.
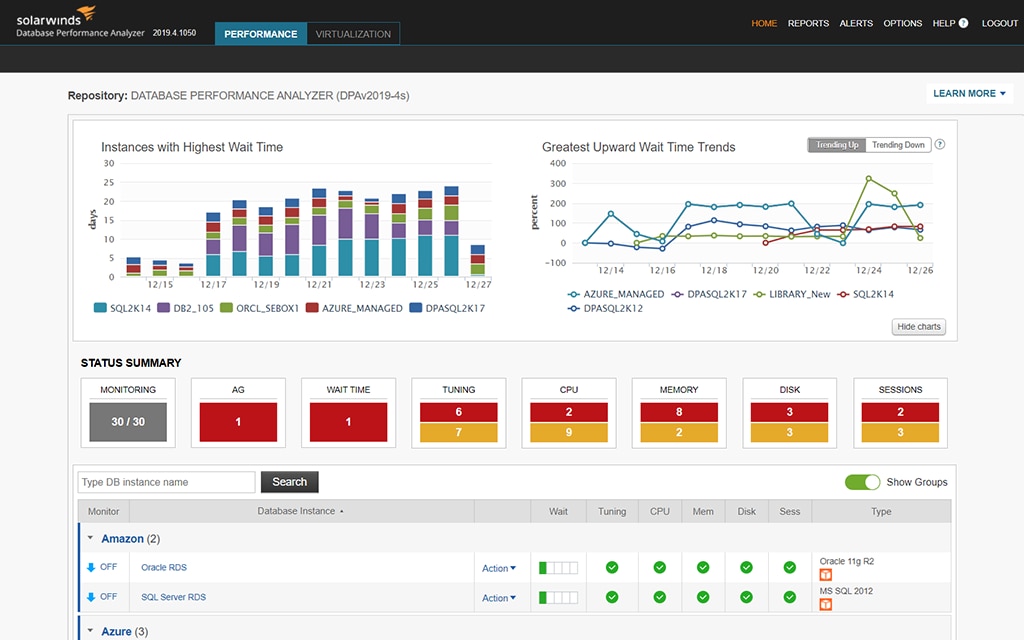
This tool helps you understand your Oracle performance by giving you an at-a-glance view of key dimensions, including waits, applications, SQL statements, client machines, users, and much more. You can gain insight into your database performance in a matter of seconds, with data displayed graphically, in the form of charts and dials.
DPA includes a blocking analysis capability, which allows you to view your Oracle blocking hierarchy along with the overall impact blocking has on your database performance. It also features anomaly detection powered by machine learning. With DPA’s intelligent algorithm, which improves over time, you can gain a comprehensive understanding of your Oracle wait behavior.
The query performance analysis capabilities of this tool are highly advanced. You can conduct SQL and plan analysis, in addition to correlating query wait time with resource metrics, statistics, blocking data, and so on. DPA even gives you access to tuning advisors, who can help you achieve your Oracle database performance tuning goals and pinpoint areas needing to be prioritized.
With DPA’s management API, you can automate and scale the management of your database environment. The management REST API can be used to programmatically manage the ability to license, register, stop and start monitors, annotate, and more.
One of the reasons DPA is so popular is its agentless architecture supports collaborations between teams. Developers, DBAs, and operations teams can use the simple web interface to work together. With read-only rights, you can restrict access to certain functions, so DPA is safe to use across multiple teams.
DPA comes with comprehensive alerting and reporting utilities. The alerts have been designed to prevent your inbox from being overloaded with irrelevant notifications. You can use pre-built monitoring alerts or create your own, setting thresholds so you can choose exactly what behaviors you’d like to be informed on. This keeps noncritical notifications, or notifications your business doesn’t consider a priority, to a minimum.
With ample maintenance support, including custom metrics, index advice, and intuitive dashboard features, DPA is a flexible and cleverly designed tool. It requires no training or experience to get started and is highly scalable, making it suitable for small-scale and large-scale business use.
Getting Started With Oracle Database Performance Tuning
Oracle database performance tuning is a challenging and time-consuming task for DBAs, which is why using an effective tool is so important. If you’re looking for a simultaneously scalable, easy-to-use, and highly functional tuning tool, then SolarWinds DPA comes highly recommended. A 14-day free trial is available.