
Node.js, due to its advanced push technology, lightweight architecture, event loop, non-blocking I/O feature, and faster execution speed has been rated among one of the most popular Javascript frameworks. However, like any other application, Node.js applications aren’t immune to performance issues and errors. Debugging applications is still one of the most important, and at the same time, one of the most annoying tasks a developer has to undertake on a daily basis. While application logs can offer crucial insights and lead developers to the root cause of a problem, searching through log files isn’t always a simple job. It’s important for developers to follow the best practices for logging to extract actionable intelligence from their logs. In this article, we’ll discuss the best practices for Node.js logging, along with some popular tools for the purpose.
Node.js Logging
Best Practices for Node.js Logging
Use Logging Libraries
Add Timestamps and Tags
Make Use of Logging Levels
Use Structured Logging Format
Implement Centralized Logging
Node.js Logging With Papertrail
Conclusion
Node.js Logging
Like most applications, Node.js applications also produce logs in plain text format. One can use open-source logging libraries to create these logs. For example, Winston is a popular logging library for Node.js applications. It offers custom log formats, colorized logs, and logging levels. One can send logs to different destinations using the Winston logger. Bunyan is another common logging library used by developers. It’s also possible to transmit logs to a centralized logging server using remote_syslog2. Some third-party logging applications offer logging agents to help collect Node.js logs.
Best Practices for Node.js Logging
The choice of logging method depends on individual business requirements and resource constraints. However, configuring a logging module is only the first step; teams also need to consider several factors to control the log volumes and ensure the logs are readily available for quick analysis. Here are some of the common best practices, which can help developers make the most of their Node.js application logs:
Use Logging Libraries
Bunyan and Winston, which we mentioned above, can make Node.js logging simpler and more efficient. It’s a better approach for logging than using logging agents, as agents increase resource consumption and can also lead to latency. On the other hand, logging libraries help in structuring, formatting, and transmitting the log messages without adding any considerable overheads. Installing a library doesn’t take too much time. Also, as they’re part of the source code, they ensure logs are transmitted to the desired destination, no matter where the application is deployed.
Add Timestamps and Tags
It’s important for developers to monitor all events leading to an error or performance degradation in a sequential manner. Keeping track of events in the order of their occurrence becomes even more crucial when developers have to correlate log data across multiple apps and services. This is where timestamps come into the picture; they help developers trace different events and find the root cause of an error. When using Winston, one can use the format option to configure log messages and add timestamps to them. Similarly, adding tags to log messages can help in analyzing logs quickly. Teams can easily filter tagged logs using the grep command to find information of their interest during troubleshooting. Further, log management tools also recognize these tags and can help in processing the data for quick search and visualization.
Make Use of Logging Levels
When monitoring production environments, developers don’t want to sift through an endless stream of irrelevant log messages. They need to get to the root cause of issues faster and want to view the most critical log messages. Logging libraries can help make use of logging levels (warn, error, info, debug, etc.) by categorizing log messages according to their severity, and filtering the information.
Use Structured Logging Format
As teams need to monitor multiple application and infrastructure logs, they need solutions to help in the unified analysis of log data. However, due to the differences in log formats, their analysis becomes challenging. This is why most IT practitioners advocate structured logging formats such as JSON. It has become a standard format for logging as JSON logs can be read easily by both machines and humans.
Implement Centralized Logging
In modern application environments, there are multiple virtual machines and distributed sources. As it isn’t easy for teams to tail logs from individual hosts, they need to collect all logs in one place to stay on top of their applications. Cloud-based log management tools or Logging as a Service (LaaS) providers simplify log aggregation and analysis. With centralized logging, it’s easier to filter, search, tail, and visualize logs for quicker troubleshooting.
Node.js Logging With Papertrail
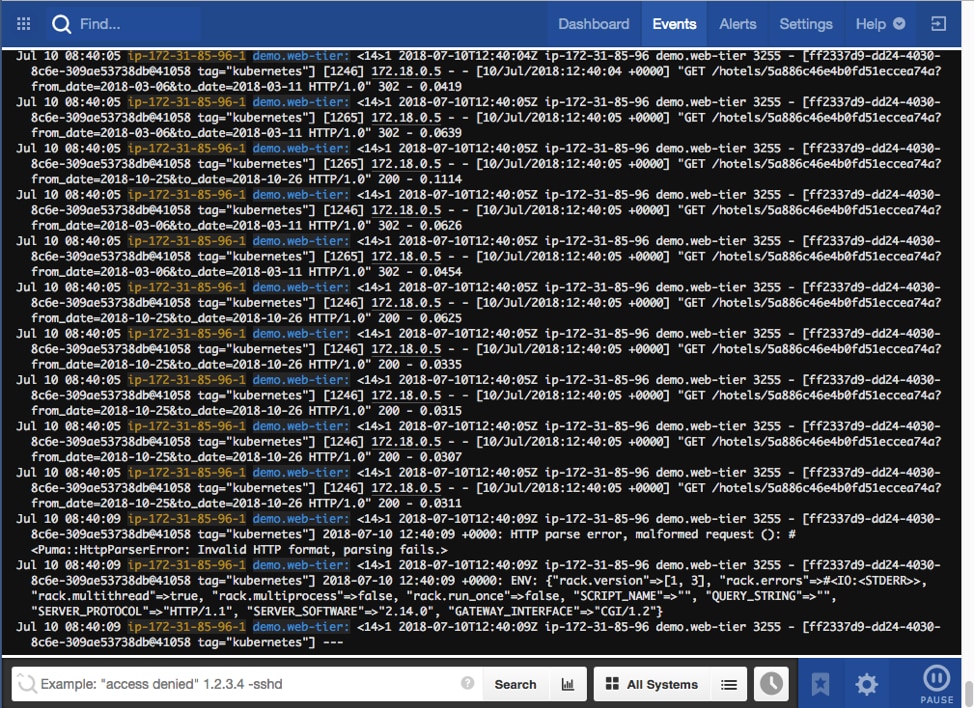
Papertrail is a cloud-based log management tool, designed to help keep track of Node.js applications. The tool can be set up within minutes and can accept logs from any Node.js app in the form of a text log file or with the use of logging libraries. It also collects logs from a wide range of networking and infrastructure sources. With all logs in one place, developers can easily tail logs in real time with its event viewer, providing a continuous feed of events in an infinite scroll. Developers can color-code their messages, pause the feed at any moment, and skip to a specific time, within a few clicks. Papertrail also makes log messages clickable; one can click an element (IP address, transaction id, etc.) to filter its log messages. Its Google-like search also makes it easier to search through a large volume of log messages. One can save important search queries and create alerts to track critical events. These alerts can be forwarded to a third-party tool such as Slack, HipChat, etc. for quick collaboration and response. Learn more about the cloud logging tool here.
Conclusion
We’ve discussed how developers can aggregate and monitor their logs in real time using the best practices for logging. Most of these practices are also applicable for logging and monitoring other applications. Tools like Papertrail further enhance the logging experience and can reduce the time to detect and resolve issues significantly. We recommend a free trial of Papertrail to organizations seeking a simple and powerful solution for their basic and advanced logging needs.