
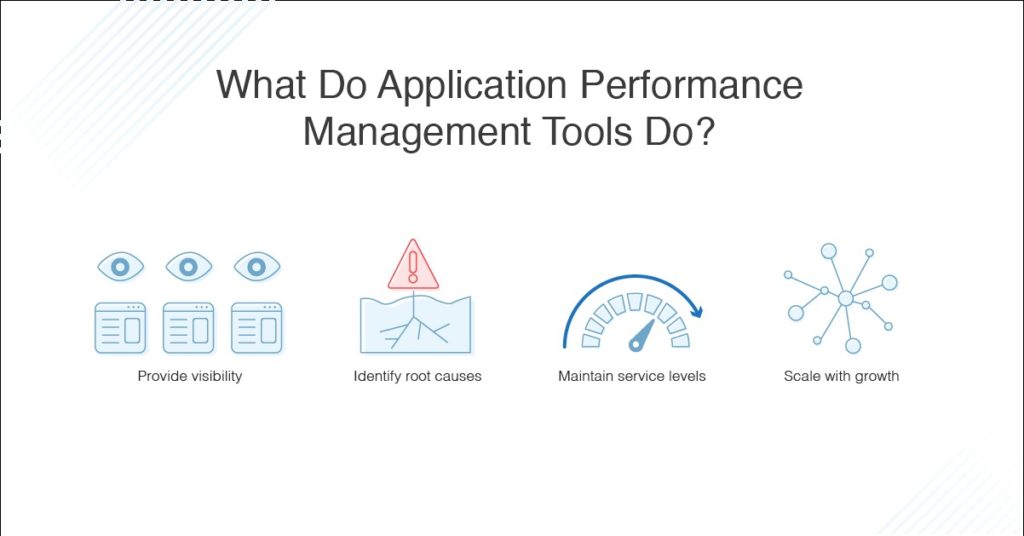
Application performance management is the process of managing and monitoring applications to ensure they’re behaving normally and aren’t impacting service levels. Ensuring good application performance keeps your end users happy and prevents low-quality experiences like slow applications or bugs. Using a professional application performance tool is critical to managing your systems and ensuring all your applications are performing as they should.
What Is Application Performance Management?
Best Application Performance Management Tools
Key Concepts for Application Performance Management
What Is Application Performance Management?
The concept of application performance management is each application, regardless of whether it is stand-alone, server-client, or cloud-based, having several metrics capable of being measured to determine whether or not the application is working properly.
For example, an application performance management tool would examine the hardware on which the application is running, whether the application is running on any virtual machines, the JVM hosting the application, the application itself, or any other supporting infrastructure.
Best Application Performance Management Tools
There are several application performance management solutions available for enterprise use, and if you’re making a case for which one your business should use you’ll need to know your stuff. Application performance management software should have several different key features, including robust alerting, application performance baselining and monitoring, and the ability to map and trace your application environment.
Below is my ranked list by best application performance monitoring features.
This is my top choice for application performance management tools. SolarWinds Server & Application Monitor (SAM) is easy-to-use, reliable, and has several core features making it extremely useful for application monitoring, reporting, and planning.
First, SAM includes application and server response time monitoring for over 1000 applications, such as IIS, Exchange, Active Directory (AD), and more. This monitoring also examines server performance, including response time, hardware issues, and server load. You can determine performance issues and where they have originated by looking at application and network response time.
Second, another one of SAM’s great features is its application dependency mapping, which discovers and maps all of your applications, network connections, and associated dependencies. This way you can see what inbound connections are connected to the application and information about these connections. You can also see the response times for dependent applications and determine whether network response time issues are causing application service delivery delays or problems.
Other than these application-specific features, SAM also includes file monitoring capabilities, and general infrastructure and server monitoring tools, so you can get a complete picture of the health of your environment. You can try a free trial of SAM for 30 days from the SolarWinds website.
Applications Monitor from ManageEngine is another great centralized console for monitoring your applications and associated network environment. It monitors your application and server performance to provide statistics in real time, so you can get a consistent view of the health of your environment.
Applications Monitor supports over 100 applications, including cloud applications and application servers, and applications for servers, virtual machines, databases, web servers, web services, middleware components, and big data stores.
For Java, .NET, and Ruby applications, ManageEngine Application Monitor can provide code-level diagnostics, so you can see how your applications are performing and any potential issues—before they affect your service levels. It can even integrate and function with homegrown applications, with custom scripts you can use for performance monitoring.
It can also trace transactions across your application environment, so it can find out whether particular transactions are slowed down and why. Applications monitor can also track application performance before and after optimizations, so you can determine what the effects were.
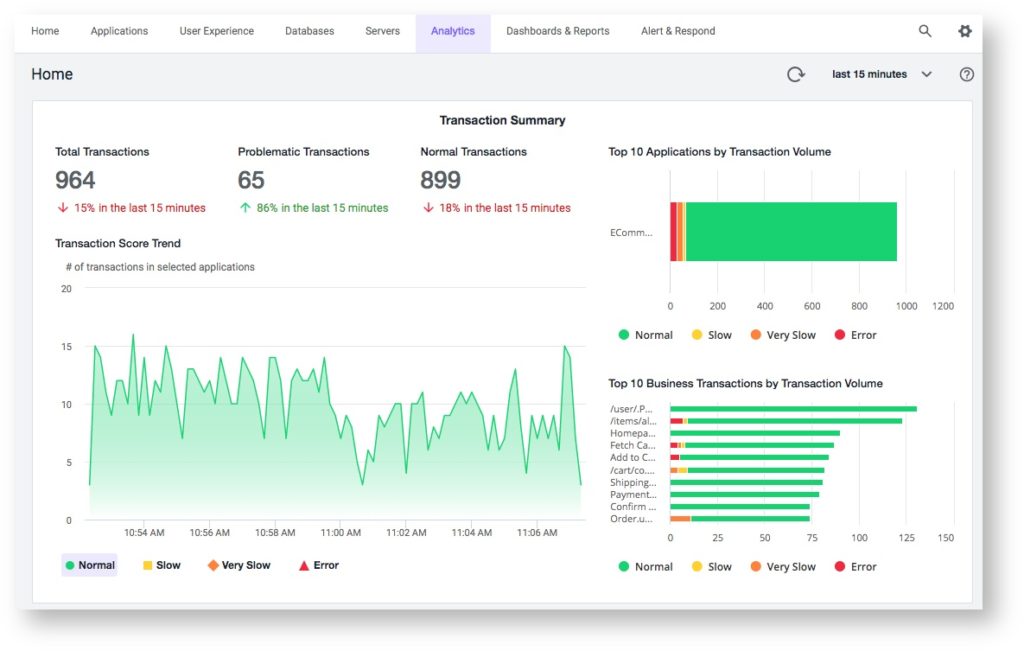
Site 24×7 Application Performance Monitoring is another good piece of software, and it can perform monitoring for Java, .NET, PHP, Ruby, node.js, and iOS and Android applications. It also works for cloud-based platforms, user monitoring, and log management.
It allows you to identify the root causes of slow applications and optimize their response times. The entire code flow for your application is captured by Site 24×7, which means you can look at all errors and exceptions for your application. This means you can pinpoint whether slow application performance is caused by failed transactions, failed database calls, and delays from external components.
Like many other tools, it also provides application discovery and topology mapping, so you can understand how your different applications connect to the network, your environment, and each other. It also uses what they call “AI-powered alerts,” in which their anomaly engine detects unusual behavior in your applications and notifies you immediately, so you can resolve these issues. This also gives you greater insights into user experience, to ensure your service levels stay constant.
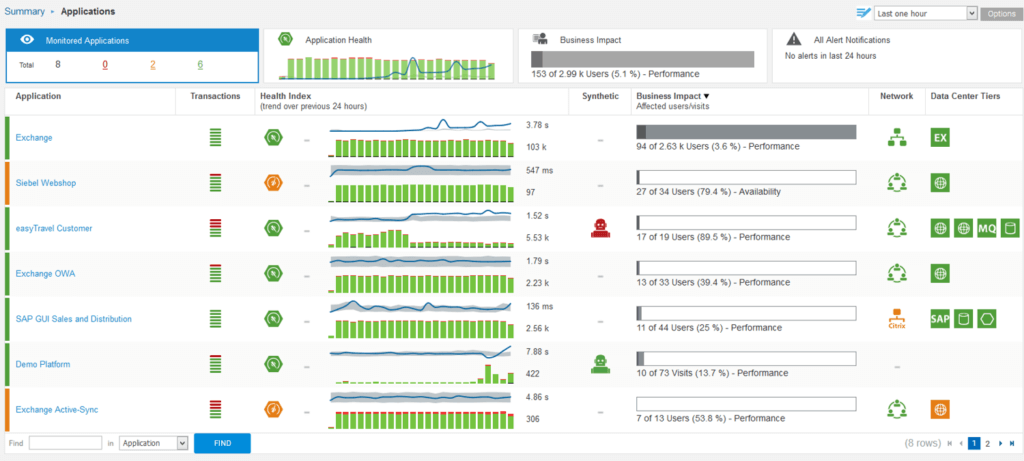
AppDynamics Application Monitoring is an application performance management solution performing application mapping, dynamic baselining, and code-level diagnostics. It maps your applications by automatically discovering them, creating a map of their connections, and then creating visualizations for you, so you can get a clear overview of how your applications and environment are connected. This also allows you to follow through and examine end-to-end performance for your applications.
AppDynamics uses a special engine called Cognition Engine to detect anomalies in application performance, providing root-cause diagnostics. This tool uses machine learning to create performance baselines and alerts, so you can gain the benefits of reduced mean time to resolution without needing to configure alerts and static baselines manually.
Like other tools I’ve discussed, AppDynamics also provides code-level analysis, so developers and IT teams can avoid sifting through log files. This is a huge time-saver and allows much faster diagnostics for issues.
Finally, it includes real-time visualizations to show business and application performance in an easy-to-understand format.
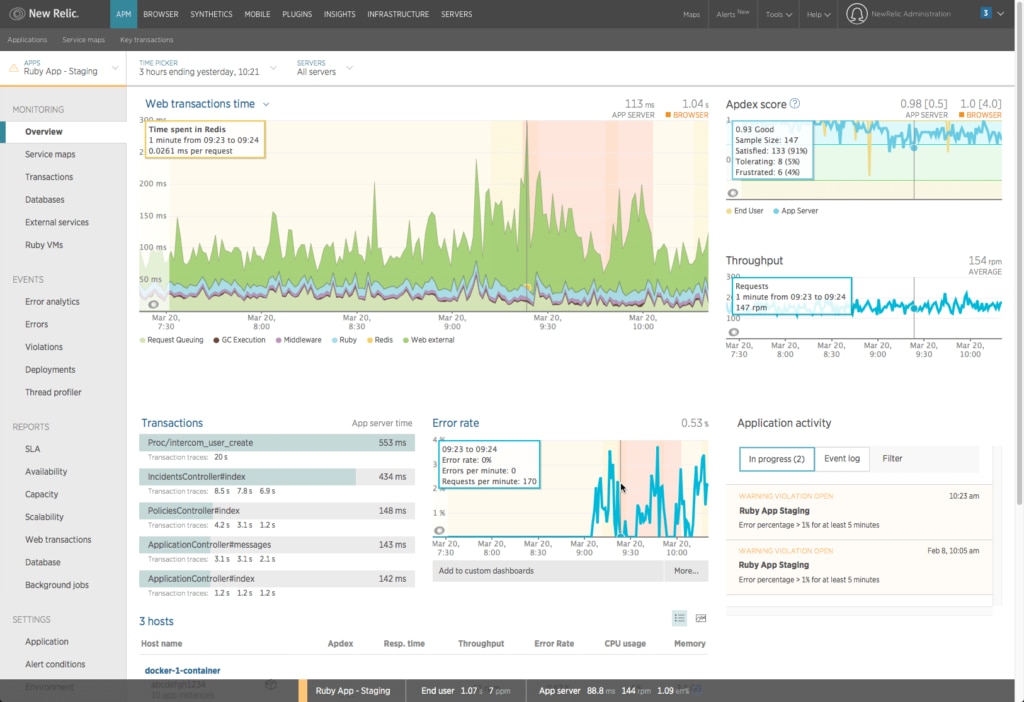
New Relic APM provides core understanding of application performance, bottlenecks, and dependencies for a complete view of your applications and operating environment.
It provides auto-instrumentation for seven programming languages, so you have insights into most industry-leading application environments. In-depth application transaction details allow you to fix problems quickly and identify the root of issues. New Relic APM provides details down to exact method calls with line numbers, including external dependencies.
They note they can “optimize performance holistically” due to their combined approach of cross-referencing metrics from mobile and browser apps, along with datastores, hosts, and supporting services. It allows you to benchmark performance before and after each step of application migration and look at end-to-end performance for application requests through distributed tracing. New Relic APM works with other New Relic products, including Infrastructure, Insights, and Browser.
Dynatrace is another popular tool on the market providing automatic application discovery and mapping, including being able to discover dynamic microservices within containers. It can look at how your applications communicate and detect poorly performing services.
Their code-level transaction analysis feature is called PurePath Technology and it also looks at the method level to determine hotspots and pinpoints slow application response times.
This software supports a large number of languages and is able to analyze different application architectures, such as on-premises, cloud, or hybrid applications. Dynatrace provides insights into databases, their usage and access info, and whether there are any bottlenecks or problems in this process.
To ensure new applications, optimizations, or changes to your infrastructure don’t affect your end users, Dynatrace also offers tracking for new builds, operations deployments, user behavior, and impacts on supporting infrastructure. This allows you to make changes to your environment with confidence.
Key Concepts for Application Performance Management
Application performance monitoring and management should be a key part of your day-to-day business operations, as it checks to make sure your applications are always performing as expected, with features to help you track, report, and resolve performance issues. Slow performance of applications can massively reduce productivity and can have large impacts on your end users.
The right application performance management tool can take over this process automatically, so you won’t have to spend large amounts of time manually sorting through log files and determining application performance. This way you can ensure you’re the first, rather than the last, to know an application needs troubleshooting. With a great tool—like my top pick SolarWinds Server & Application Monitor—you can even help prevent your end users from knowing a problem happened using insights from the tool to perform proactive analysis and quickly resolve issues with real-time alerts.