
The use of container technologies is on the rise. To make the most of this technology, however, you need a way to monitor those containers. Container monitoring solutions provide an automated way to track important metrics for your containers, often with user-friendly visuals. This article will look at what container monitoring is at its core, why monitoring is essential to container management, and I’ll provide my picks for the seven best container performance monitoring tools currently available.
If you’re looking for the top tool on the market today, check out SolarWinds® Server & Application Monitor—an excellent, enterprise-grade tool with customizable alerts and strong data visualization to make container monitoring easy.
What Is Container Monitoring?
Why Is Container Monitoring Important?
Top Container Monitoring Tools
How to Choose the Best Container Monitor
What Is Container Monitoring?
Containers are a lightweight, virtual method for packaging software code, so it can run independently. This ensures the software will work the same way each time, no matter what type of infrastructure is used. Containers are ideal to support regular software releases or rapid scaling.
The challenge comes with container monitoring. Since containers aren’t processes or hosts, traditional ways of monitoring aren’t enough. Container monitoring solutions work by gathering and tracking the metrics you need to keep performance levels high. These metrics include:
- CPU usage
- CPU limit
- Memory utilization
- Memory limit
- Real-time logs
Monitoring solutions also provide analytics and visualization, giving you clear visibility into the status of the container and alerting you to any issues. This may include alerts after hitting limits on utilization, which lets IT teams know it’s time to scale up.
Why Is Container Monitoring Important?
Like other technologies, containers are subject to performance degradation. Rapid software deployment means constant change, in some cases with the potential for patches or new releases on an almost daily basis. This increases the likelihood of problems creeping in.
Container monitoring allows you to avoid those problems. Benefits include:
- Preventing production risks and outages by identifying issues early on
- Tuning applications for improved performance
- Upgrading and applying changes safely
Container monitoring also provides visibility into information from different layers in the stack. Some of these could be text-based errors, such as “unable to connect to database.” These errors are often in logs and contain important information about the container.
Top Container Monitoring Tools
When reviewing and choosing a container performance monitoring tool, here are some questions to consider:
- How easy is it to deploy and configure?
- What level of detail does it present?
- Does the visualization give you the right information to review your data?
- Can you create custom dashboards and reports?
- How easy is it to configure alerts?
- How much does it cost?
This isn’t a complete list, but these questions are a good starting point for evaluating your options. With those questions in mind, here are seven top tools for container monitoring.
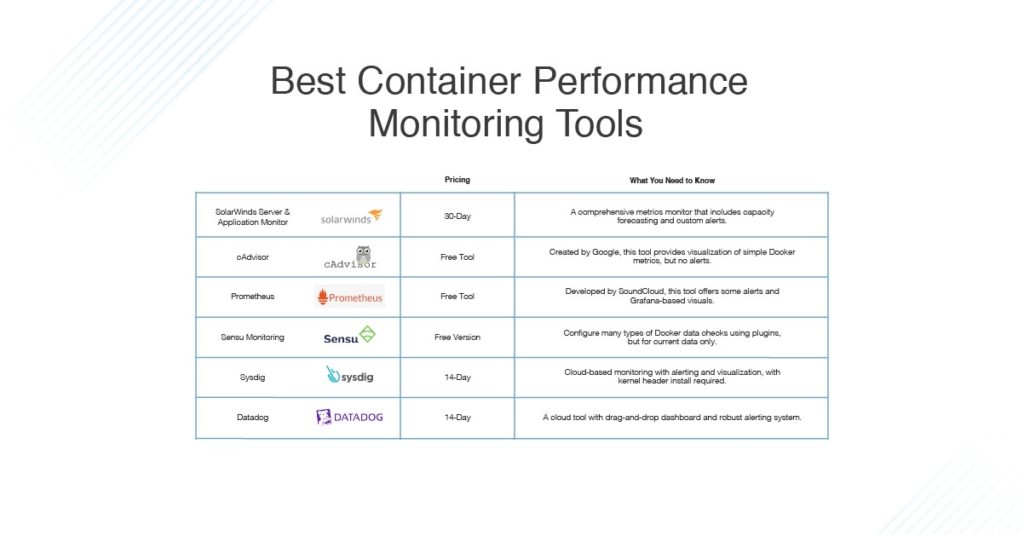
SolarWinds Sever & Application Monitor
SolarWinds Server & Application Monitor (SAM) is a comprehensive monitor you can use to maintain your containers and applications. For example, with SAM you have the option to monitor basic Docker container information, such as CPU and memory usage, but you can also monitor other critical applications on your network. The monitor includes both current and past information, allowing you to make comparisons with earlier periods.
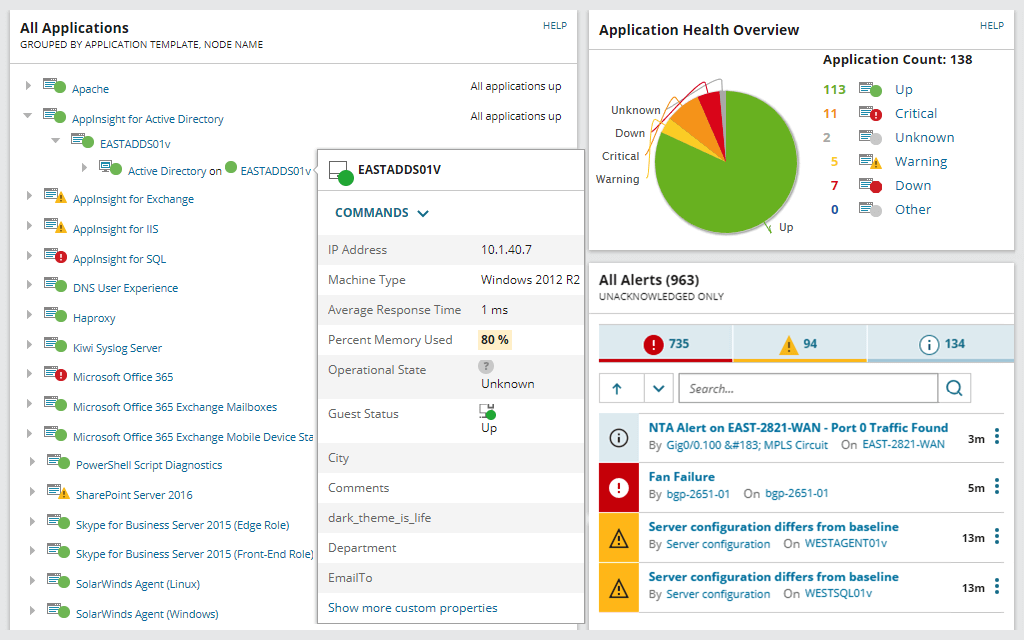
Additionally, you can take it one step further with forecasting. Based on your usage, SAM can let you know ahead of time when you’ll need to increase capacity, giving IT the opportunity to scale up before running into utilization issues.
Alerts can also be easily customized, and they can be configured to avoid false positives by using thresholds and comparing against a defined baseline. All the information is available in a user-friendly dashboard, including performance graphs, so you can see changes over time.
SolarWinds SAM gives you everything you need for your container and application monitoring, starting with a free 30-day trial. After that, pricing depends on your business needs.
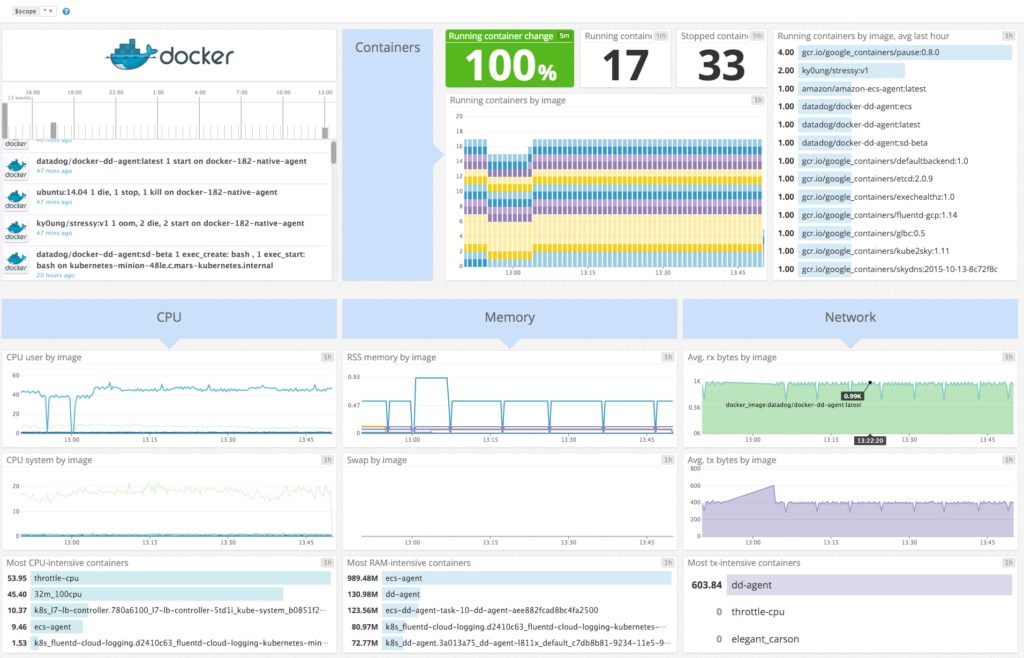
cAdvisor
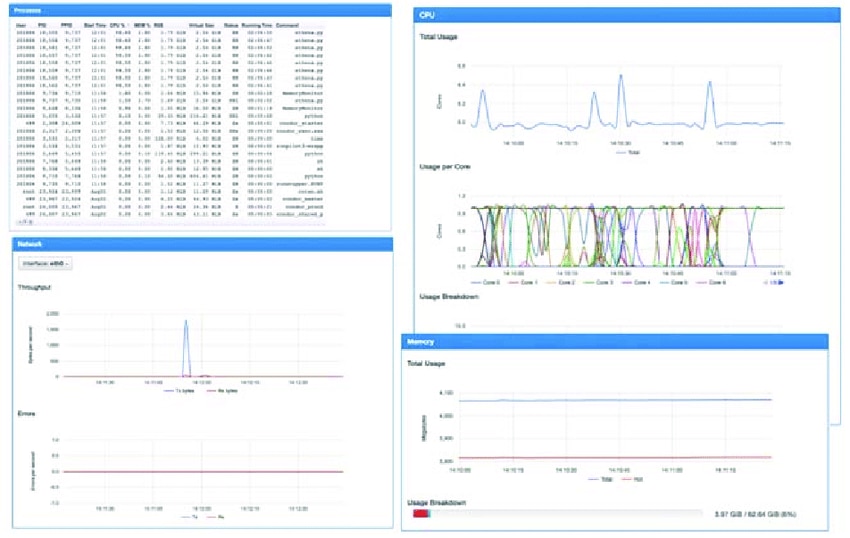
Another open-source container monitoring solution is cAdvisor, which stands for container Advisor. Created by Google, cAdvisor has native support for containers and provides a graphical way of viewing API information.
cAdvisor is a container itself and has the benefit of being extremely easy to launch. After running a single command, it’ll connect to a running daemon to gather metrics on all running containers. You’ll then have easy visualization of your CPU, memory usage, and network input/output.
cAdvisor is also free and easy to integrate with other environments. But what cAdvisor can’t do is generate alerts or provide a deeper look at the history of your data. It’s also difficult to use if you have more than one host. But if you export cAdvisor data, you can use other tools to set up alerts and view the data over time.
Prometheus
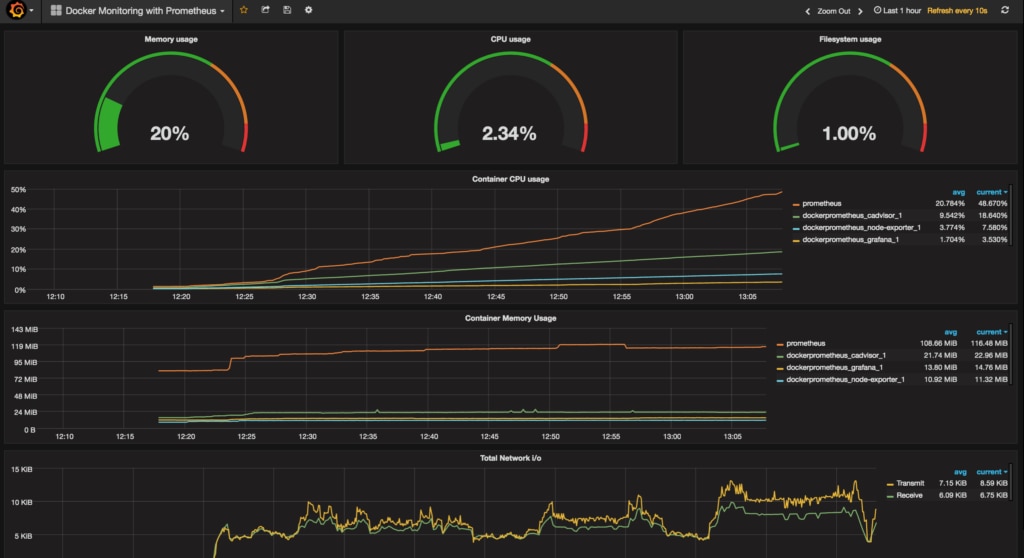
Prometheus is an open-source system for monitoring and alerting, developed by SoundCloud. It uses a group of tools called exporters to capture and store metrics, provide alerts, and support visualization and aggregation. If the existing exporters don’t meet your needs, provided libraries allow you to create custom exporters.
The container exporter works by scraping data to gather the information from the container. You can also create any alerts needed and use the Alert manager to direct them to the correct endpoint. This includes the option of displaying them in the UI.
One important note is while Prometheus can create dashboards and graphs, it depends on using Grafana for the dashboards. Additionally, Prometheus isn’t the most straightforward solution to deploy or configure. It requires significant effort to get it up and running. Still, as a free tool with good analytical capabilities, you may decide this is worth the extra time needed for deployment.
Sensu Monitoring
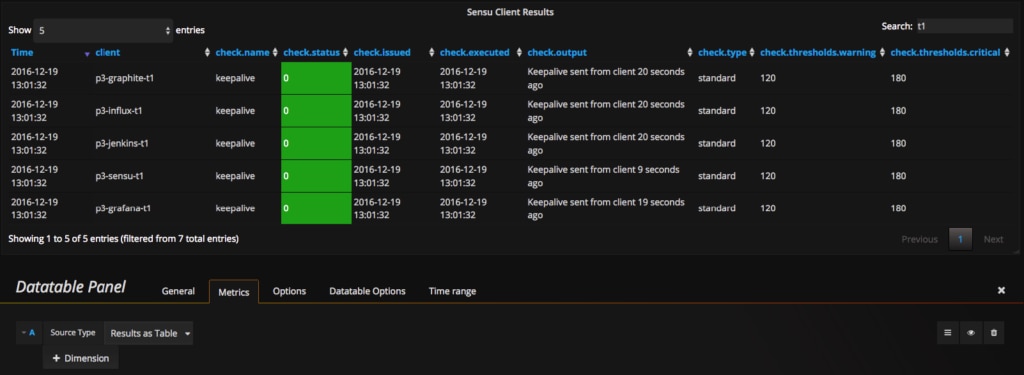
Sensu offers a free, open-source tool capable of effectively monitoring both simple and complex environments. One of the biggest benefits of this system is you can configure as many types of data checks as you want for your containers and hosts. One important note with this is if you want to add a check after launching the container, you need to restart the Sensu server before it can collect the new metrics. Once you have your checks defined, you can configure alerts to find out if anything failed.
Sensu doesn’t store all the information over time, but it does allow you to use Handlers to send the information to another tool where you can get a better visualization of the data over time.
The main challenge comes with deployment. It also requires launching and maintaining separate processes for other systems, such as a Sensu API and Sensu Core. Once it’s deployed, however, Sensu offers comprehensive monitoring for your containers.
Sysdig
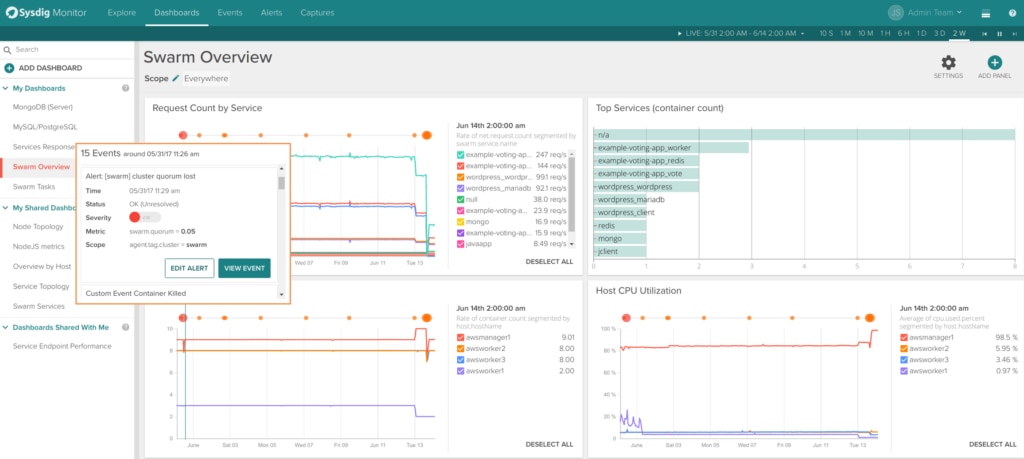
Sysdig provides all the basic requirements for a container monitoring system. It collects and stores metrics, provides alerts, aggregates the data, and supports visualization.
Sysdig has a user-friendly interface where you can see the information about CPU, memory, and network usage. You can view the information in real-time and configure a comparison between the current usage and historical usage. If you want to view the same information more than once, you can create a saved dashboard for easy reference. Sensu also supports creating alerts from the interface. This includes specifying a description, severity for the alert, and who should receive the information.
The only thing about Sysdig is it requires you to install kernel headers in the host operating system. This is fairly straightforward, however, and the rest of the deployment is easy to do. You also have the option of deploying Sysdig on-premises, or it can be hosted in the cloud. Sysdig offers a free 14-day trial, after which you’ll need to pay a monthly fee.
Datadog
Datadog is a cloud-based monitoring and alerting tool you can use with containers. Like many of the other container monitoring tools, Datadog tracks CPU and memory usage, as well as input and output. You can view this information on customizable dashboards with drag-and-drop functionality. From the dashboard, you can also create any graphs you need for specified metrics.
The alert system is more robust than many others and goes beyond simply identifying failures. By setting up thresholds for the alerts, you can take a more nuanced approach to the system and accommodate expected ups and downs. This allows you to avoid situations capable of generating a false alert.
Overall, Datadog is a powerful, easy-to-use tool and provides good visualization. You can start with a free trial, and after, you have different pricing options available based on your needs.
How to Choose the Best Container Monitor
Businesses using containers have several options when it comes to container performance monitoring tools. Some of the simpler, open-source tools may be enough to get you started, but most companies will need a more robust approach.
Your best bet for business-grade container monitoring support? You can’t go wrong with SolarWinds Server & Application Monitor, an all-around container monitoring solution with easy deployment, customizable alerts, and clear visualization of the data.