
Cloud computing is now an integral part of business IT infrastructures, and Microsoft Azure SQL is one of the forerunners in providing cloud computing services. Using Azure, you can build, test, deploy, and manage applications in your IT environment to support better service delivery with overarching service, application, and database management.
No matter how useful and feature rich Azure SQL is, however, you still need to manage and optimize it appropriately to reap its full benefits. With a database monitoring tool such as SolarWinds® Database Performance Analyzer (DPA) or SolarWinds Server & Application Monitor (SAM), you can feel confident your Azure SQL database is performing at its best.
What Is Azure SQL, and How Is It Different From SQL Server?
Guide to Database Performance Monitoring
Best Azure SQL Database Monitoring Tools—List
What Is Azure SQL, and How Is It Different From SQL Server?
Microsoft Azure SQL Database is a relational database capable of being used as a service. It’s offered as a cloud-based computing platform and shares many similarities with SQL Server, which is essentially the on-premises version of Azure SQL. Like other cloud services, you pay for what you use with Azure SQL. You can choose between two different pricing models depending on whether you prioritize flexibility or dependability.
Azure SQL can host databases from various clients who use the service. With SQL Server, the database only holds instances from the on-premises setup. SQL Server also uses your LAN and the Tabular Data Stream protocol instead of HTTP or TCP/IP to allow your applications to talk to the server, another important difference. Azure SQL, on the other hand, only uses TCP/IP to talk to the Azure gateway through the internet.
Because Azure SQL is a subset of SQL Server, Azure doesn’t have several features SQL Server has. This includes, for example, master data services, data auditing, data quality services, database snapshots, a SQL server browser, extended stored procedures, PolyBase, policy-based management, and semantic search. This doesn’t mean Azure SQL is inferior; it simply means they’re used for different purposes.
Though SQL Server has more features, for example, it’s also much more difficult to set up and manage than Azure SQL. It also provides high availability, supports business continuity with automatic backups, and is easily scalable for larger or growing businesses.
Whether you’re using Azure SQL or SQL Server, you need to make sure you’re performing regular database performance monitoring. This is due to the vital role monitoring plays in keeping your database functioning as expected, and monitoring supports your business in delivering services to your customers with high uptime. Without a functioning database—whether on-prem or in the cloud—you’ll run into major issues with application, network, and service performance.

Guide to Database Performance Monitoring
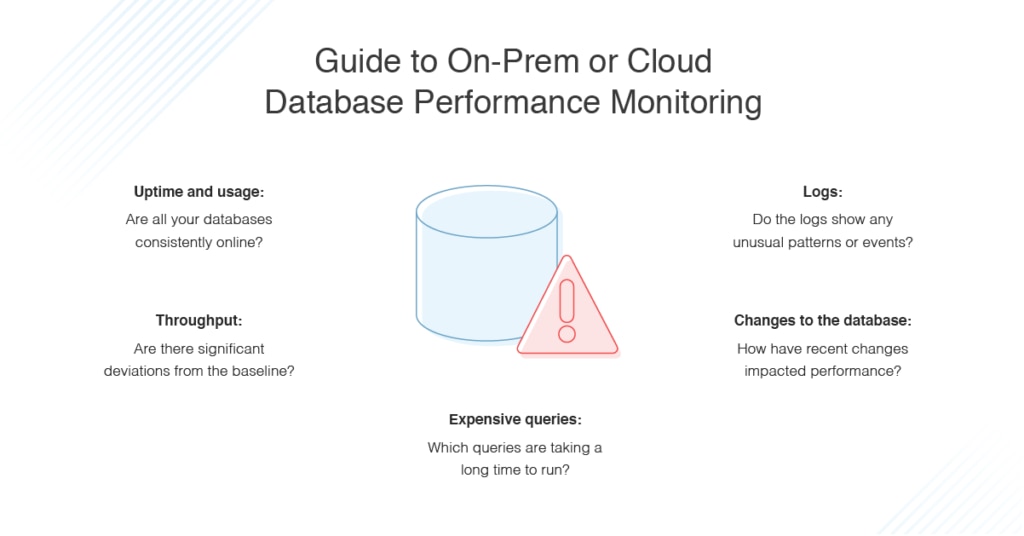
There are several key factors you should be monitoring for your databases, particularly for Azure SQL database performance.
- Uptime and usage. You first need to check whether your databases are consistently online. Checks should take place during nonbusiness hours and business hours—for example, they could take place once every hour. This is one of the most fundamental tests for your databases; without a regular online check, you may experience outages without knowing about them. A good database monitoring tool will alert you when an outage occurs.
Once you’re sure everything is online, you should also check resource consumption. This includes CPU, memory, disk, and network functioning, all of which you should check regularly to ensure issues aren’t affecting end users. - Throughput. “Throughput” refers to the amount of work typically going through the database. This could include transactions completed per second, connections per second, or various measures of queries and latency. Any significant deviation from baseline throughput could indicate a problem, so it’s vital to constantly monitor this. If you take baseline readings over a period of a few weeks or months, you’ll get a good idea of what a normal throughput looks like so you can easily set alert thresholds.
- Expensive queries. Even when everything’s online and resources and consumption are all normal, you can still experience poor database performance. Some causes of this might include inefficiencies, problems with indexes or statistics, and poorly designed databases. These issues are much harder to troubleshoot. Start by determining which queries are taking a long time to run—the “expensive” queries. This can help you pinpoint the issue.
- Changes to the database. You need to monitor any changes made to the database and any applications dependent on it. A new application can affect the way a database runs, especially if there’s a bug in the application with repercussions for database tables, functions, or views. If a new application is installed or a new data source is added, make sure the database is still functioning as before. You can monitor throughput baselines before and after the change to ensure continued performance.
- Logs. Finally, check your logs. Logs can show the database queries running and the time they’re taking to finish, and they can flag any unusual patterns or events. Make sure you examine a range of log types, including system-generated logs, slow query logs, logs for scheduled tasks, backup logs, and routine maintenance logs.
Best Azure SQL Database Monitoring Tools
When undertaking Azure SQL Database monitoring, it’s crucial to use a relevant tool for your business. If you work in a large enterprise or professional environment, you’ll want to choose a professional tool with good documentation and support. Below are my top picks for ensuring optimum Azure SQL performance.
My favorite Azure SQL database monitor is SolarWinds Database Performance Analyzer. This is the case for several reasons, not least of which is because DPA includes utilities specifically for handling Azure databases. You can use SolarWinds DPA for three main purposes:
- To identify anything going wrong in your Azure databases
- To troubleshoot and analyze root causes
- To optimize databases for maximum performance
With 24/7 monitoring, DPA can easily spot spikes in monitored metrics, and you can set alerts to notify you as soon as this happens. In addition, you can use correlated resource metrics to more easily pinpoint issues and determine where they’re stemming from. From an optimization perspective, you can see which queries are more expensive than they need to be, so you can change configurations or fix tuning or indexing issues.
Alongside these Azure-specific tools, DPA includes numerous general database monitoring and performance features, and it can work with cloud and on-premises setups. DPA offers a free trial for up to 14 days.
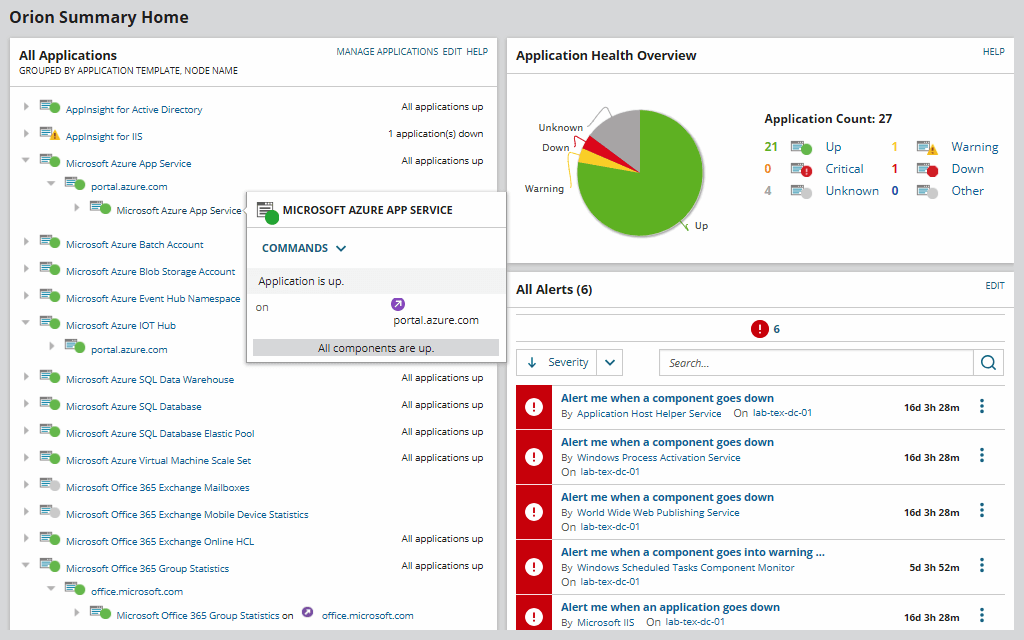
This is another great solution from SolarWinds. SAM is a broad tool capable of examining your servers for performance and capacity planning and keeping track of application dependencies and application performance. It can also monitor all Azure and Amazon Web Services infrastructure as a service (IaaS), platform as a service (PaaS), and software as a service (SaaS) solutions.
For Azure, SAM offers performance monitoring from a single dashboard and the ability to view and correlate performance metrics through the entire environment, including the role your databases are playing. With dynamic baselining, you can determine what normal performance looks like for your system and receive alerts when something deviates. You can also keep track of all your Azure VMs and visualize maps between VMs and your applications.
With critical Azure component monitoring for CPU, memory, requests, and response time, you can keep an eye on how these core database metrics are tracking. You can try out SAM for up to 30 days.
Both SAM and DPA are part of the SolarWinds Orion® Platform, which means you can integrate them with other SolarWinds tools.
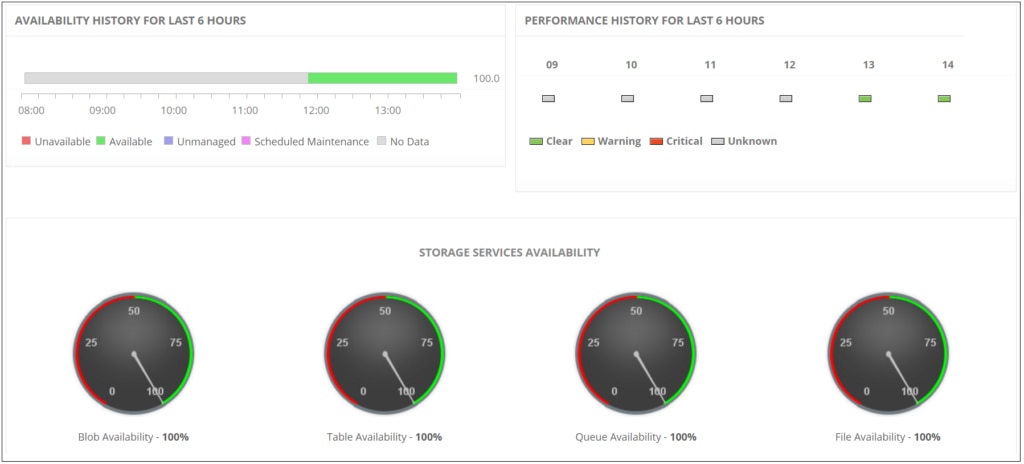
With ManageEngine Applications Manager, you can track key database metrics like DTU usage and R/W utilization and learn whether your database has excess capacity or whether resources are functioning at their maximum. You can also look at CPU function, storage, I/O, and so on.
Applications Manager allows you to keep tabs on how your queries are tracking, including query execution, historical long-running queries, and blocked queries. Performance graphs help you monitor how well your workload is tracking with performance levels, and you can use custom SQL queries to track specific data as it’s received from the database. Like other tools, it also includes core baselining and alerting features.
You can try a 30-day free trial of the professional version of ManageEngine Applications Manager, after which it reverts to a free version with limited features.
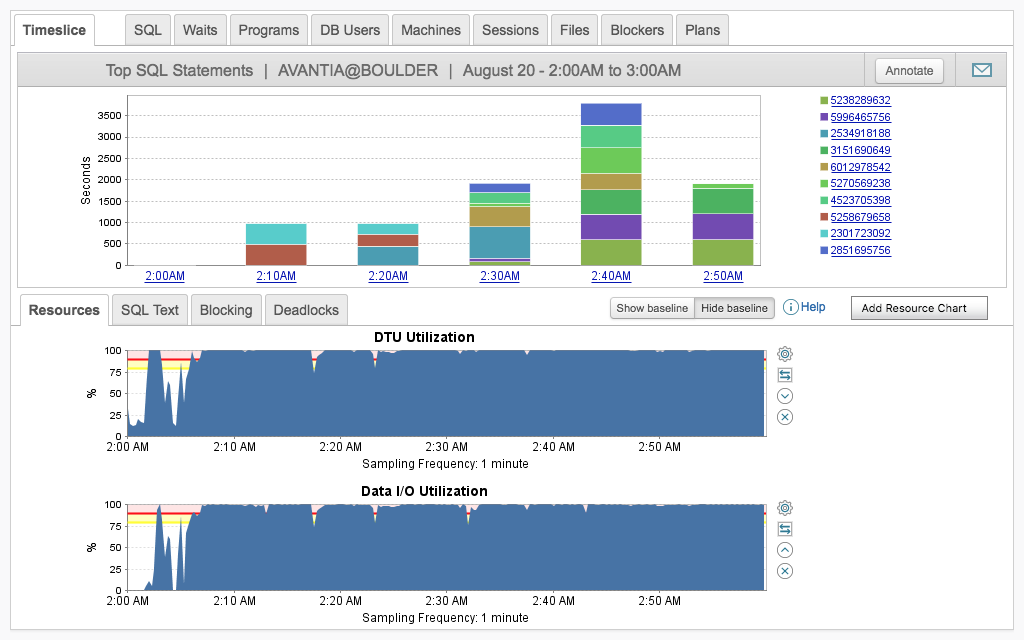
My final tool recommendation is SolarWinds SQL Sentry. It can monitor performance metrics such as DTU usage, and it includes an alert system to let you know when unusual metrics or events occur. When set to “Top SQL” view, SQL Sentry displays query performance problems in the dashboard, enabling you to easily troubleshoot these issues in your Azure SQL database.
You can also examine historical procedure and statement executions and organize them by duration, CPU consumption, or I/O usage. This helps you pinpoint slow or expensive procedures or statements.
The free trial of SQL Sentry lasts for two weeks.
How to Choose the Best Database Monitoring Tool for On-Prem or Cloud Databases
Azure SQL and SQL Server have many similarities, but they’re ultimately intended for different purposes. In either case, engaging in on-premises or cloud database monitoring is a vital part of IT performance management. If your database isn’t functioning well, other parts of your IT environment will cease to perform and delivering services to end users will become slow or even impossible.
By using high-quality database performance monitoring tools, you can spot problems before they affect your end users, maintaining customer happiness and your business reputation. My recommended tools come from SolarWinds: Database Performance Analyzer and Server & Application Monitor both provide database monitoring with capabilities specific to Azure SQL. Furthermore, they can be integrated with other SolarWinds tools through the Orion Platform to create a tailored, comprehensive monitoring solution.