
If a computer or device is overloaded or working too hard, its productivity and performance will be affected. By checking, monitoring, and testing server load, you’re better able to evaluate server resources and ensure they’re sufficient for running your applications and processes. Server load testing gives you insight into a computer’s limits, which allows you to accurately pinpoint server resources needing your attention and to troubleshoot any performance issues.
This ultimate guide to server load testing and server load monitoring will provide tips for reducing your server load, in addition to outlining how to check the server load and how to monitor server load. To support your server load testing and server load monitoring operations, I recommend SolarWinds® Server & Application Monitor (SAM). SAM is a Linux– and Windows– compatible tool for server load monitoring and combines business-grade functionality with a dynamic, user-friendly interface.
What Is Server Load?
How to Check the Server Load
How to Monitor Server Load
Tips for Reducing Server Load
Choosing the Right Server Load Monitoring Tools
What Is Server Load?
The word “load” refers to the number of processes waiting in a queue to access a computer’s processor. The load is calculated over a specific time period and is often expressed as an average. The “load average” is usually expressed as three numbers—representing the load one minute earlier, five minutes earlier, and fifteen minutes earlier.
The smaller the load average, the less strain is being put on your server. A load value of less than 10 is generally considered to be acceptable. Once the server load exceeds this number, it could highlight a potential issue.
If you discover an unusually high load value when you check server load, several factors could be at play. High server load is usually caused by CPU and disk utilization. It could be a hardware error, but this is uncommon.
How to Check the Server Load
If you want to check server load, the process will differ based on the operating system. In Unix and Linux, for example, you could check server load by using the “w” and “uptime” commands. When a result is generated, it might look something like this:
14:23:20 up 42 days, 2:06, 3 users, load average: 0.31, 0.42, 0.12
The first figure, 14:23:20, refers to the time at which the command was executed. The second part lets you know the server has been up for 42 days, two hours, and six minutes. Three users are logged in. The three values at the end represent the load average. As this output demonstrates, load averages can significantly change in a matter of minutes.
How to Monitor Server Load
Checking server load and monitoring server load are slightly different processes.
When you use the “w” and “uptime” commands, as in the example above, this displays load averages at the time the command was executed. If you use the “top” command, on the other hand, it displays the processes running dynamically. This is more resource-intensive, which is why the “w” and “uptime” commands are recommended for checking server load during high load periods.
If, however, you want to monitor the server load, the “top” command is more suitable. This will produce a dynamic output, which will be updated at specific time intervals. This means you’re able to view the processes and load with resource usage immediately.
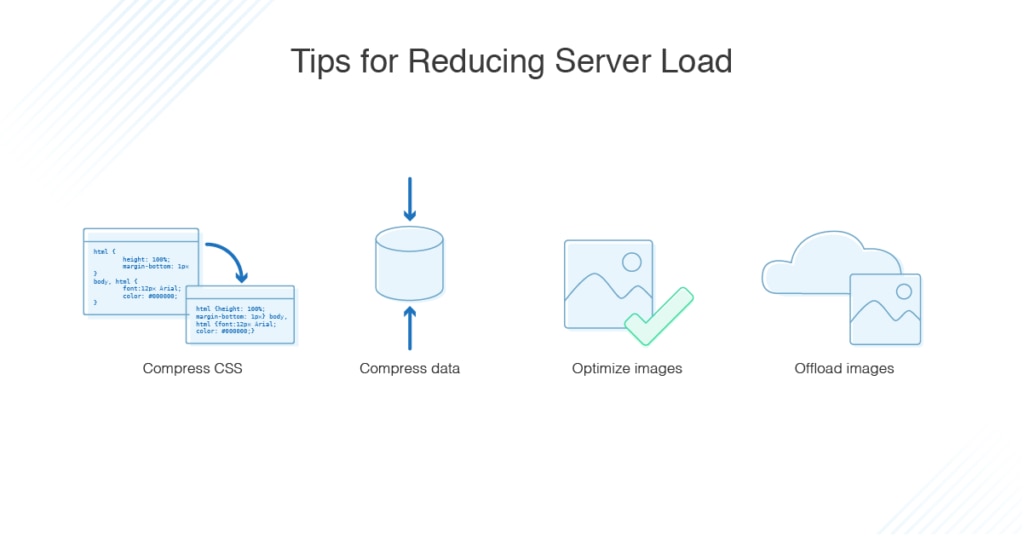
Tips for Reducing Server Load
If you’re monitoring your server load and find it’s consistently higher than you’d like, there are a few simple steps you can take to reduce it.
- Compress CSS. First, consider compressing your CSS. You can do this by utilizing shorthand properties or a CCS compressor program. It’s also helpful to delete any unnecessary HTML, white space, and tags.
- Compress data. Compressing your data is another way of reducing server load. Compression algorithms, like Brotli and Gzip, are highly recommended. These methods can rapidly shrink your web page size.
- Optimize images. Optimizing your images is one of the best ways to reduce server load, because images often account for more than 50% of bandwidth usage on a website. During the optimization process, replace images with CSS code wherever possible.
- Offload images. Lastly, if your server load continues to be problematic, seriously consider hosting your images elsewhere, especially if your website is image-heavy. Websites like ImageShack and Flickr are viable options. If the image you want to include is already hosted elsewhere, you can link to its location instead of hosting a copy on your server.
Choosing the Right Server Load Monitoring Tools
The market for server load monitoring tools is vast. While some server load monitoring tools offer advanced utilities, they might not provide the range of capabilities you’re looking for, or even a user-friendly experience. SolarWinds Server & Application Monitor is a consistent favorite among IT administrators and professionals wanting to check server load and monitor it on a continuous basis. This is because it combines ease of use and an impressive range of utilities with enterprise-grade functionality.
SolarWinds products rank highly on numerous IT software “best of” product lists, because the SolarWinds range consistently delivers dependable, scalable, and sophisticated solutions. SAM is no exception. It features an uptime monitor and downtime tracker tool for checking server load, helping you ensure your applications and server are performing at their optimum level.
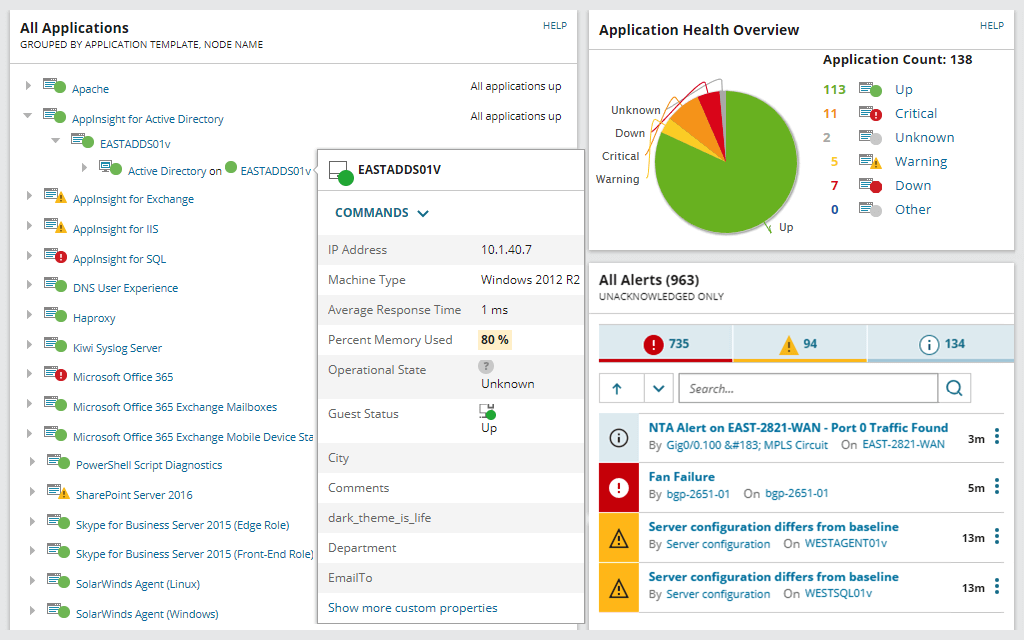
This tool monitors your critical hardware resources, giving you insight into which ones might be spread too thin, so you can reduce the risk of downtime. With the dynamic and highly visual dashboard, you’re able to examine key server health metrics quickly and accurately.
SAM lets you measure several metrics, including CPU load, which can expose the need for server hardware upgrades. You’re also able to monitor poor disk performance, which could highlight any issues with storage performance. SAM even gives you visibility into virtual and physical memory usage, revealing where system strains might exist.
SolarWinds SAM is capable of monitoring multi-vendor server hardware health. By conducting server health monitoring processes proactively, you’re able to rectify issues before they have a critical impact on performance. To assist in this, SAM lets you view important hardware health metrics, including power supply, server temperature, and fan speed.
If you’re wondering how to check the load of SQL Server, SAM provides you with this feature. You also have access to a Real-Time Process Explorer, which allows you to log in to a server remotely and kill any processes hogging resources. This is a sophisticated functionality setting SAM apart from many of its competitors.
Lastly, SAM’s real-time server availability monitoring capabilities are enhanced by 1200 out-of-the-box apps designed to assist you with managing your critical business applications. Uptime and downtime can be tracked for authentication servers, virtual infrastructure, email servers, Java application servers, databases, web servers, and operating systems. This server load monitoring tool is versatile, giving you a one-stop solution for server load testing and server load monitoring. A 30-day free trial is available.