
The IT departments in most enterprises handle myriad activities, both routine and rare in nature. The common goal of all IT teams is to keep their businesses running with optimum utilization of IT resources. However, ensuring high availability for business applications and monitoring network and infrastructure heath is no simple task. IT teams have to monitor different terminals and dashboards to keep track of numerous servers, networking equipment, user devices, applications, and more. While the tools and processes to monitor enterprise IT environments have evolved significantly, certain practices and utilities still prove to be helpful in basic troubleshooting. One such utility is the log tail, which helps in monitoring system logs. In this article, we’ll discuss how to tail logs in real time and which tools can be helpful for the purpose.
- The Traditional Head and Tail Commands
- Following a Log Tail
- Challenges With Real Time Log Monitoring<
- How to Simplify Real-Time Log Monitoring
- Common Tools to Tail Logs
- Papertrail
- Conclusion
The Traditional Head and Tail Commands
Most system administrators have used the “head” and “tail” commands on their Linux terminals. The head command prints the first 10 lines of a text file, while the tail command prints the last 10 lines of a text file. If needed, you can change the number of lines printed by using the -n argument. For example, the command “tail -n 15 example.txt” will print the last 15 lines of the text file. These commands are particularly useful for system administration and scripting purposes. As most log files and plain-text files, the commands work equally well.
Following a Log Tail
It’s possible to monitor new additions to a text file using the follow operator or -f option. The tail -f command prints the last 10 lines of a text or log file, and then waits for new additions to the file to print it in real time. This allows administrators to view a log message as soon as a system creates it. The tail -f command continues to print messages, and you have to stop the session with a Ctrl + C command. As logs often snowball quickly, it’s important to focus on only the most critical log messages, so system administrators also use the “grep” command along with tail -f command to filter the log messages.
Challenges With Real Time Log Monitoring
As discussed above, the tail -f command, commonly referred to as live tail, helps monitor logs in real-time. Administrators used to directly monitor a local machine or ssh into some remote servers to access their logs. However, modern IT environments are highly complex, containing multiple physical and virtual servers and cloud-based resources. In such an environment, it’s not feasible to track individual log tails across different terminals simultaneously.
How to Simplify Real-Time Log Monitoring
To solve the above challenge, organizations rely on centralized log management. It involves aggregating logs from different sources and transforming them into a common format to monitor them over a single window. Cloud-based log management tools and logging as a service (LaaS) providers help users collect a large volume of logs, parse them into different fields, and filter, search, tail, and visualize them for analysis. With these tools, they can also set up alerts for critical events to expedite response.
Common Tools to Tail Logs
The Elastic Stack or the ELK-Stack is a common open-source solution consisting of tools like Elasticsearch, Logstash, and Kibana. Elasticsearch is the core of the solution and offers multi-threaded nodes for searching logs, Logstash is the log aggregator, and Kibana helps visualize the log messages. These tools help organizations manage and analyze a large volume of logs. Teams can also monitor their logs in real-time using these tools. These open-source tools offer a high level of flexibility for organizations to create a monitoring system based on their requirements. However, sometimes organizations have to go beyond these tools for optimum performance. For instance, in many cases, they have to install a message queue for log persistence. Choosing whether to create a self-hosted setup or use the cloud to install ELK stack is another complex decision, without a single answer. Organizations should consider these and several other configuration challenges before choosing the Elastic Stack for log monitoring.
However, as discussed earlier, organizations can also choose commercial, cloud-based log management solutions, which offer simpler configuration, higher scalability, and a lower total cost of ownership. Tools like SolarWinds® Loggly®, LogDNA, Sumo Logic, and Splunk are some highly rated log viewers and analyzers in the market. However, if you’re looking for a simple and powerful tool to tail logs, we recommend SolarWinds Papertrail™.
Papertrail
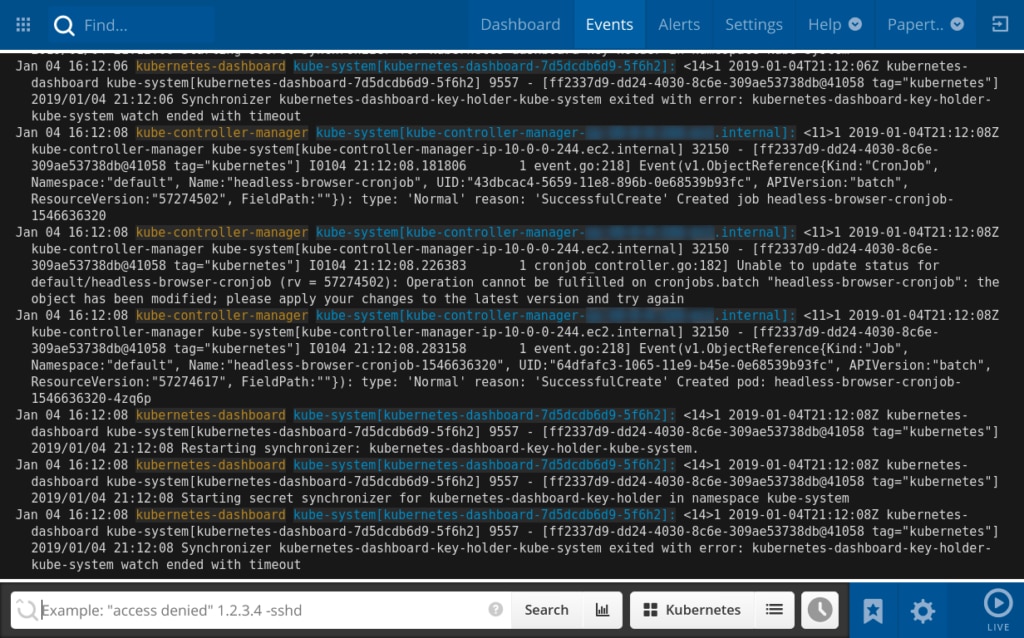
Papertrail is a cloud-based log management tool and can be set up typically within minutes without facing any complex configuration or upfront infrastructure provisioning requirement. The tool allows teams to collect logs from a wide range of sources, without the need to install agents. As logs are collected, they can be viewed over an event viewer, in near real-time. Administrators can view the live tail, click certain elements of their log messages (e.g., IP address, event ID, HTTP response code, etc.) to filter them. Papertrail also allows teams to save critical searches and raise alerts around an event. The alerts could be forwarded to a messaging service like Slack or Hipchat or could be sent over an email, depending on the team’s preference. Searching log messages in Papertrail is easy as it supports familiar search and you don’t need to learn any complex query syntax. You can get a free trial of Papertrail to evaluate its features and choose a higher plan as per your organization’s requirements.
Conclusion
By correlating logs from multiple sources, teams can get a better understanding of their IT environments, get to the root cause of issues faster, and find patterns to help predict future events. Tools like Papertrail are built to simplify logging and real-time monitoring in production environments.