We live in a world of applications, which are always becoming better at what they offer to their end users. The continuous cycle of development, delivery, and feedback has made drastic changes in the way applications are developed these days, and the cloud has been at the forefront of all these changes. Not long ago, Heroku came up with a tailor-made, cloud-based application development platform for developers, which makes it easier for developers to leverage the cloud infrastructure, without dealing with its complexities. Based on AWS, Heroku abstracts away the provisioning and maintenance hassles and provides a seamless developer experience. However, applications deployed on Heroku aren’t immune to performance-related issues and errors. Debugging and troubleshooting these issues requires specialized tools and knowledge of Heroku logging best practices; in this article, we’ll discuss these practices and tools in detail.
Heroku Logging
When an application stops working or encounters a performance issue, developers often rely on heuristics to capture the bug and perform troubleshooting. However, with microservices and distributed architectures, such techniques for troubleshooting have become ineffective. It’s not easy to identify which component in the complex stack is responsible for a problem. This is where log analysis offers a way forward.
Heroku has its own log routing system called Logplex to direct log streams from different sources into a single repository. There are four major categories of logs in Heroku, including application logs, system logs (logs from the Heroku platform), API logs, and logs from different add-on services.
You can use the terminal to view Heroku logs. For example, the command “heroku logs” shows the last 100 lines of Heroku logs. To view more log messages, use -n argument, as shown below:
heroku logs -n 1500
In the terminal, you can only view the last 1500 lines of logs.
Further, to monitor the environment in real-time, use live tail:
heroku logs -t
Find more information about CLI commands for Heroku logging here.
Best Practices for Heroku Log Analysis
Centralized Log Management
Logplex, the logging system in Heroku, routes and collects log messages from different sources efficiently. However, it’s not designed to provide longer storage for these logs. The logs are kept for a week and rotated after 1500 lines of messages. For log analysis, you might have to access historical logs or perform correlation over a longer period. Therefore, consider a logging as a service or cloud-based logging tool for log aggregation. Most cloud logging tools offer faster search, tail, and alerting, which can help in extracting the true value of logs.
Use Add-ons
Add-ons from different log management service providers offer a convenient way to collect and analyze Heroku logs. Most of these logging add-ons are easy to provision. For instance, the following single line command can be used to provision the Papertrail™ logging add-on:
heroku addons:create papertrail
To launch the service, you can use the following command:
heroku addons:open papertrail
With access to all the logs in one place, you can filter, search, and configure alerts to stay on top of your IT environment.
Control Logging Levels
Log messages can vary in their severity, which is defined by logging levels. For efficient log analysis, you should avoid monitoring low severity log messages, such as Info, Debug, and Trace. This not only reduces the burden on a logging setup, but also reduces information overload.
Set Up Alerts on HTTP Response Codes
Alerting can help in addressing critical application and infrastructure issues in time. You can set up alerts from Heroku log messages containing HTTP response codes. For example, a 404 error may require changes in the URL path or adding a missing file. If there’s an alert for a 5XX response code, then it will require a deeper analysis of application logs for troubleshooting. It’s also possible to use HTTP Request IDs to correlate router logs with their respective web dyno logs.
Monitor Heroku Error Codes
Many times, the information provided by HTTP response codes isn’t enough to troubleshoot the error. You should inspect Heroku Error Codes to understand the root cause of an HTTP error. For example, “H18 Server Request Interrupted” is a critical error indicating server overload and requiring improvements in application performance or capacity.
Where to Get Started?
Log analysis offers an easy approach for troubleshooting, analyzing, and monitoring every aspect of an application. However, unlike logging on traditional systems, Heroku logging can be challenging for first-time users. It restricts host access and offers limited visibility as application logging ends at the dyno. That’s why one should consider cloud-based log management tools like SolarWinds® Papertrail designed to make the analysis of Heroku logs simpler. As discussed earlier, configuring the Papertrail add-on isn’t challenging, and requires a single line command.
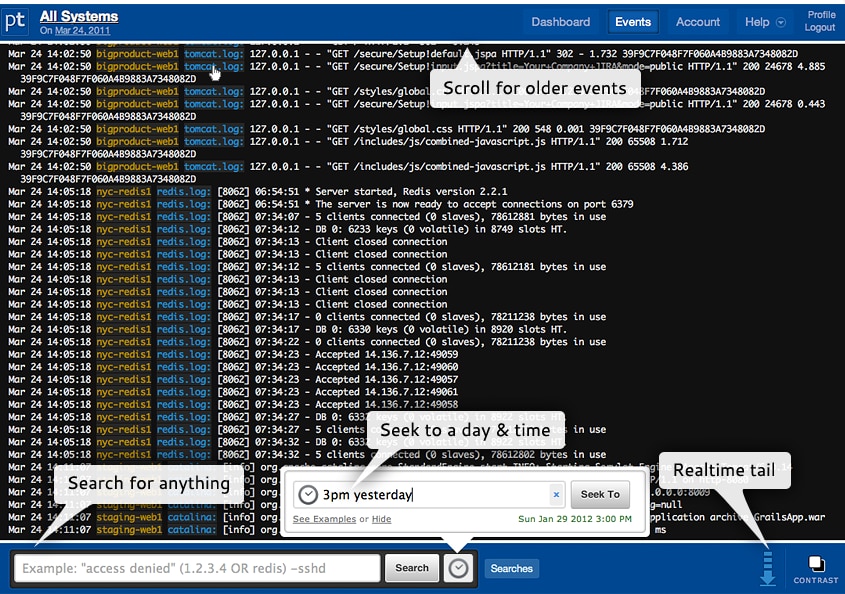
Papertrail helps in collecting logs from the dyno, platform, buildpack, and other components in one place. It allows you to tail and search logs using its intuitive event viewer or the Heroku CLI. The Papertrail event viewer is built for simplicity and speed. It reformats the timestamp and source in all log messages to improve visibility and make everything searchable. The messages appear in near real-time in the log viewer, which supports auto-scrolling. You can pause the stream of messages to focus on any critical event or skip to a specific time within a few clicks. You can save critical searches for faster troubleshooting in live environments. Further, while saving a critical search, Papertrail lets you create an alert for the event, which you can configure to be forwarded to your preferred notification service. Another major feature of Papertrail is its live velocity analytics, which helps detect surges in log volumes. Such surges are often a sign of a security breach or an application failure.
Conclusion
Logs are arguably the most important source to gain observability into complex application stacks like Heroku. They assist in real-time performance monitoring and troubleshooting errors. However, the analysis of Heroku logs can also help in understanding application behavior and usage trends over time. Cloud-based logging tools like SolarWinds Papertrail provide a higher retention period and easier analysis of a large volume of logs. We recommend a free trial of Papertrail to evaluate the tool and get the most out of your Heroku investments.