
Microsoft SharePoint is increasingly used by individuals and enterprises around the world to build document and content management systems, and to help organizations communicate through an internal social platform. It’s also useful for creating web applications and can be utilized on its own account as collaborative software.
SharePoint is incredibly versatile, and several different components feed into whether the outputs perform effectively. For example, server performance, network uptime, and application dependencies can all affect how well SharePoint is functioning in your enterprise. Using monitoring and management software like SolarWinds® Server & Application Monitor (SAM) can help to ensure your SharePoint services remain healthy and meet service levels, while tools like SolarWinds Access Rights Manager (ARM) can be instrumental in managing your enterprise access to SharePoint.
What Is SharePoint?
SharePoint, created by Microsoft, is a software platform allowing organizations to store and organize information, and to create websites and portals to collaboratively manage the information. It allows users to upload documents and immediately collaborate on them with other users. One of the best features of the software is its ability to display details on the documents or information stored, where they’re stored, and why. This is called metadata, and it helps users to quickly see why particular information is stored. Metadata also helps with database creation, as it can be used to organize and also search for information.
SharePoint is a web-based tool, and there are two main versions you can access: SharePoint Online, a cloud-based service, and SharePoint Server, an on-premises solution linking with Microsoft Office.
The intranet-based cross-collaborative nature of SharePoint makes it a useful tool for all businesses, as content can be easily stored, shared, and managed collaboratively. This allows for easier workflow management. In addition, SharePoint can be customized to meet the needs of your organization, and it’s easily scalable.
How to monitor SharePoint servers without 3rd party tools
SharePoint Server comes installed with out-of-the-box Microsoft SharePoint monitoring features that allow for customization to better suit business needs. Such features include SharePoint metrics reporting, usage and health data collecting, and diagnostic logging that collects data about the SharePoint Server farm environment. Additional features include:
- SharePoint Health Analyzer: This SharePoint monitoring software helps you perform a SharePoint health check to analyze and resolve problems with security, performance, configuration, and availability. A useful SharePoint server infrastructure monitoring solution, Health Analyzer runs predefined health rules against servers in the farm at scheduled intervals. Each health rule falls in one of the following categories: Security, Performance, Configuration, or Availability. If an error is detected, the corresponding rule is triggered. When any rule fails, SharePoint Health Analyzer creates an alert on the Review problems and solutions page and writes the status to the Windows Event log. Each SharePoint performance monitoring alert comes with a brief error explanation with a link to a detailed article that contains step-by-step help to resolve the problem. You can also edit report list items, create custom views, see Sharepoint metrics, export the list items into Excel, subscribe to the RSS feed for the list, and more. Farm administrators can configure specific health rules, such as enable/disable rules, define the scope where the rules run, and configure run schedules.
- Timer jobs: Many features in SharePoint rely on timer jobs to run services according to a schedule. Configurable timer jobs collect SharePoint health check data and then write the data to the Logging database. Timer jobs should not overlap with each other as it will affect system performance, so you can reschedule a timer job, enable or disable it, and run it on demand.
- Reporting: SharePoint can be configured to collect SharePoint monitoring data and create reports about server status, site use, and searches. SharePoint health check reports will show the slowest pages as well as top active pages. You can also view SharePoint monitoring logs by running commands on Microsoft PowerShell or read them directly from the logging database. In addition, you can monitor cache performance and timer job status.
SharePoint Monitoring Best Practices
When handling SharePoint performance monitoring, there are several best practices you should always follow. Without monitoring, fault or failure in your SharePoint operation could certainly affect the end-user experience and business continuity. Adhering to SharePoint monitoring best practices will not only help to prevent unnecessary issues but will also assist you in getting the most out of your SharePoint setup.
SharePoint monitoring best practices include the following:
- Monitor health reports. First, make sure you’re consistently and regularly monitoring the health reports for your SharePoint infrastructure, to ensure everything is running smoothly and no alerts have been raised. For example, you’ll want to check on web page load times and latency, user and database request response times, and CPU performance, and database capacity. Health reports for these aspects of your SharePoint system will flag any issues before they affect your end users.
- Check event logs and ULS logs. Checking event logs is another key way to make sure no issues have arisen. Even with regular monitoring and software to help you, it’s still a good idea to check your event logs and ULS (Unified Logging System) logs through SharePoint. This can help to flag any unusual events you may have missed.
- Monitor SQL Server for disk space. Monitoring for disk space is also vitally important; if you neglect this, you’ll end up with a full disk which slows down requests and affects your entire SharePoint system performance. Requests end up queued or dropped, and information or application traffic can be lost.
- Monitor SharePoint server usage. SharePoint server monitoring is vital, as your servers affect the health of everything else in your infrastructure.
- Monitor web applications and web parts. Monitoring web application performance helps to flag slow page load times and determine whether delays are caused by applications, the network, or underlying infrastructure. Careful monitoring can also help to spotlight situations in which a particular web component or individual transaction is causing issues.
- Use alerts. Alerting can be set up to let you know as soon as an issue arises, or it can be established in a more fine-grained way to notify you only of critical issues or only during key time periods. Usually, you can set up alerting to flag critical issues at any time of day (including out of business hours), with less-important alerts shown to you during business hours.
- Restrict access. It’s vital you carefully restrict access to SharePoint, as SharePoint servers and sites tend to host some of an enterprise’s most valuable data and assets. Keep permissions for SharePoint locked down and monitor access to ensure data breaches cannot occur and you meet all your compliance obligations with respect to protecting data stored in or accessed through SharePoint.
- Regularly review. No matter what monitoring systems you have in place, you need to review your configurations, reports, and the system as a whole on a regular basis, to determine whether everything is functioning as it should be.
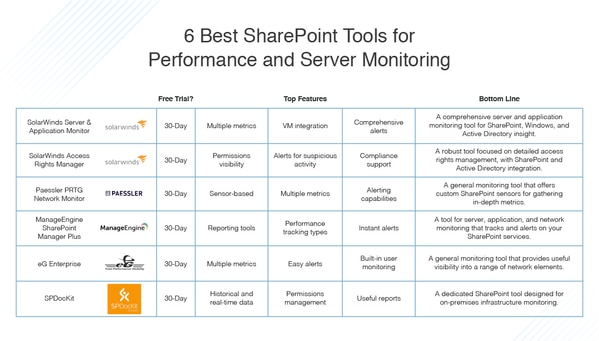
Best Tools for SharePoint Performance Monitoring
The following list ranks my top SharePoint tools for monitoring network and server performance. I have included the best free SharePoint tools along with my picks for premium SharePoint monitoring software. For large businesses and enterprises, professional tools with good support and documentation are vital, while for a small business or an individual user, a free tool might suffice.
In making your decision, you’ll want to consider whether a free tool will be adequate for the size and needs of your budget. Think carefully about your requirements and remember many of the professional solutions also offer free trials, so you can try them out before making an investment.
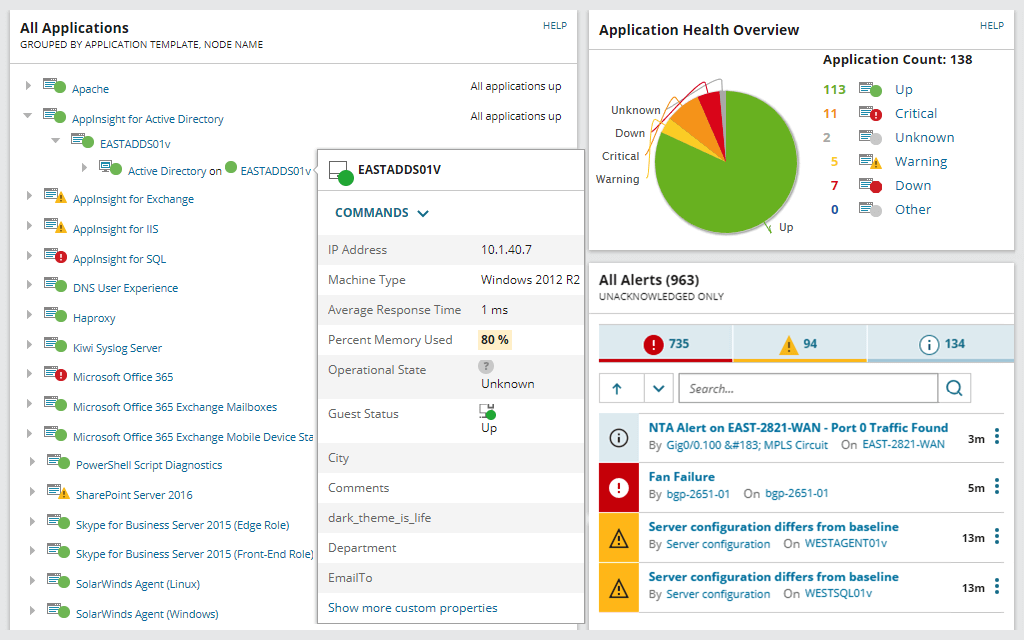
SolarWinds Server & Application Monitor provides comprehensive server monitoring, and application performance monitoring and management. It also provides monitoring and performance management for SharePoint as part of its suite of tools.
SAM includes server performance monitoring tools specifically to keep track of web page latency and page load times on your SharePoint websites. Using SAM, you can also isolate which point along the infrastructure is causing issues, whether it be an application component, a network component, the location, or an issue with the server or storage infrastructure. This leads to quick troubleshooting and reduces the impact on the end user.
In addition, SAM can monitor specific SharePoint website transactions, which adds a layer of granularity to the assessment. This means faster troubleshooting, with clearer insights into exactly where the problem lies.
Alongside these monitoring capabilities, SAM also includes comprehensive metrics on Windows issues, Active Directory problems, and issues with Microsoft IIS. This includes data on the number of requests per second, throughput, request wait time, and rejected requests (such as 503 HTTP errors).
SAM includes a dedicated SharePoint monitor tool, which focuses on request wait time and SQL query execution time for your databases. With SharePoint deployed in virtual environments, SAM can also monitor the virtual machines running the SharePoint application, and checking on CPU, memory, and storage utilization for relevant VMs. With comprehensive alerts, SAM lets you know when storage is overutilized or if there are capacity issues, and flags issues affecting SharePoint performance at any point along your infrastructure or SharePoint environment.
SAM is built on the SolarWinds Orion® Platform and as such integrates with other SolarWinds tools, such as SolarWinds Network Performance Monitor and SolarWinds Web Performance Monitor. This gives you the ability to build a comprehensive network and SharePoint website monitoring solution in a highly customizable and scalable way.
You can try SolarWinds SAM free for up to 30 days.
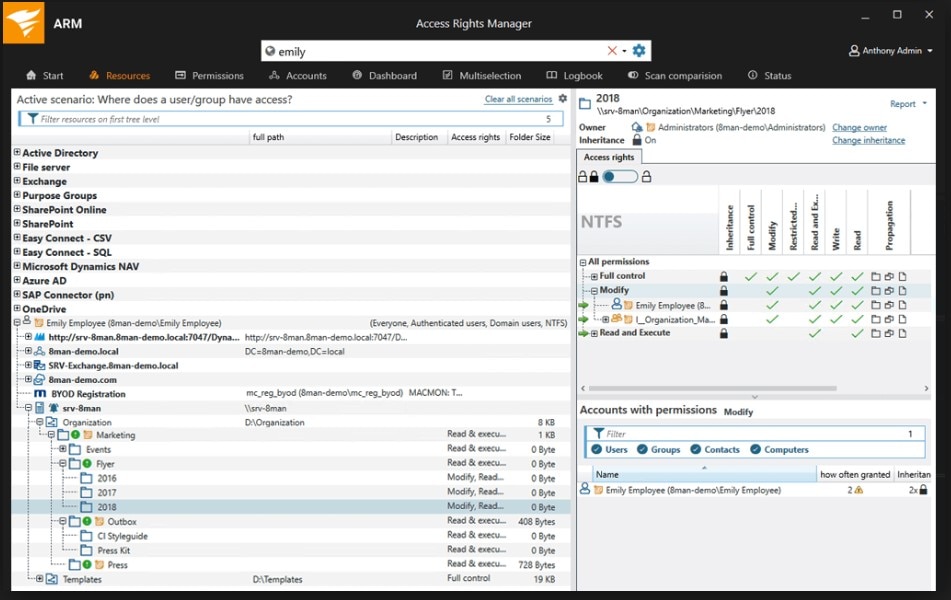
Access Rights Manager is another robust tool from SolarWinds. ARM approaches SharePoint performance and monitoring from a different angle: permissions management in SharePoint.
SharePoint can allow and create access to huge amounts of data across an organization, and it’s vitally important to protect the data through protecting SharePoint access. ARM has several features allowing you to easily and simply manage access to various parts of your infrastructure, including Active Directory and SharePoint provisioning, Active Directory reporting, and generating risk reports and access reports to meet compliance requirements.
With respect to SharePoint tools, ARM can help to simplify all of your permissions and access, which saves you time and prevents manual mistakes. You can easily view who has access to SharePoint resources and who has which permissions, and the time at which a user accessed particular resources. ARM also helps to flag risks to security or compliance, showing you high-risk access or unauthorized access pointing you to any stolen credentials or suspicious behavior.
With SharePoint permissions management through ARM, you can automate much of the account creation process through templates based on each role in your organization. For example, if you have developers, managers, and HR staff, each one of these roles or groups may need different kinds of SharePoint permissions, and you can automatically assign these through ARM when you set up an account for a new user, or when a person moves between teams or roles. ARM makes it easy to enforce the principle of least privilege by ensuring each role gets access to what they need to do their job, and nothing more.
In terms of compliance, you can easily use ARM to show data protection policies are being enforced, and you can satisfy GDPR and PCI compliance requirements with ARM’s reporting tools.
Like SAM, SolarWinds ARM is available for a 30-day free trial, and can also be integrated with other SolarWinds products through the Orion Platform.
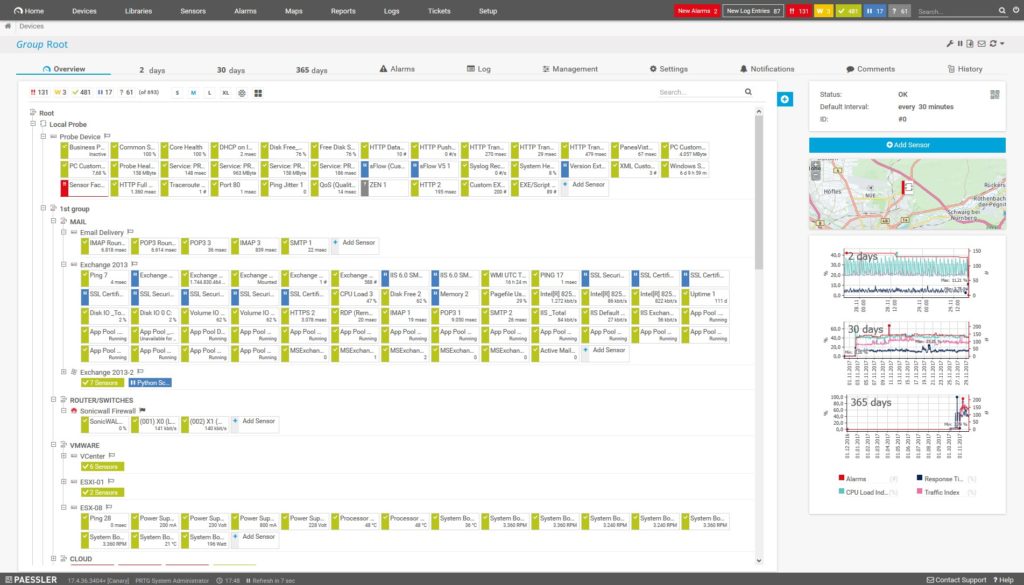
Another great tool for SharePoint performance and server monitoring is PRTG Network Monitor. It offers a wide range of general network monitoring tools, as well as specific tools for monitoring SharePoint servers. With PRTG you gain a complete overview of SharePoint server status and performance, along with the ability to create easy-to-read reports from this data.
PRTG works with a set of what it calls “sensors,” which are customized for different monitoring purposes. The tool uses the WMI SharePoint Process sensor to monitor SharePoint servers, and it uses the Microsoft WMI protocol to access different values and status configurations for Windows computers. It also uses two other sensors—the Windows IIS Application sensor and the PerfCounter IIS Application Pool sensor. The former checks data, while the latter uses performance counters. Both sensors check metrics to monitor server performance and availability.
Metrics delivered by the WMI SharePoint Process sensor include current page requests, active threads, ongoing SQL queries, memory requirements of active objects, template cache size, active heap size, and CPU usage. The Windows IIS Application sensor will show you data on traffic volume, known and unknown users, number of files transferred, and number of queries. With the PerfCounter IIS Application Pool sensor, you can see what processes are running in the application pool.
PRTG Network Monitor’s sensors are customizable, which allows you to keep a closer eye on specific assets if you wish to do so. You can also set up custom reports from the sensors to provide you with the information most relevant to you.
PRTG includes useful alerting capabilities, including the ability to alert through email, push alerts, audio alarms, and HTTP requests. You can adapt these notifications to suit a schedule (such as only allowing high-priority alerts outside of work hours) and to avoid floods of alarms for important but not critical issues.
You can try Paessler PRTG Network Monitor for free for 30 days.
ManageEngine SharePoint Manager Plus includes several utilities for different kinds of monitoring—this includes network and server monitoring, application monitoring, and a dedicated tool for managing and monitoring SharePoint.
SharePoint Manager Plus comes with management tools, including tools for managing user permissions to SharePoint and tools for managing security groups and access rights. In addition, it provides continuous monitoring for the health of your SharePoint services, including all endpoints and sites. If an issue arises, it sends alerts to let you know what has gone wrong.
The software includes three types of performance tracking tools: for service health, endpoint monitoring, and site statistics. Reporting from these tools allows you to track SharePoint service and site performance.
When it comes to service health, you can view service status, start and end time of the service, and event IDs. With endpoint monitoring, when connection failures occur they are recorded as incidents for alerting; likewise, if a connection takes a long time to resolve, you’ll be alerted to take note. The site statistics feature enables you to see the online quota and monitor it, so you know the maximum storage available to each site tenant—and how much has already been used.
Alongside these features, SharePoint Manager Plus includes useful reporting and auditing tools. You can view any changes to your SharePoint infrastructure at the component level, including changes made to document libraries, lists, or security settings like permissions and group changes. This log data can be stored for flexible time periods, allowing you to meet audit requirements at later dates. You’re able produce reports on everything coming out of the program, including statistics, security reports, activity, and usage analytics.
ManageEngine SharePoint Manager Plus offers a personalized web demo, and a free trial for up to 30 days.
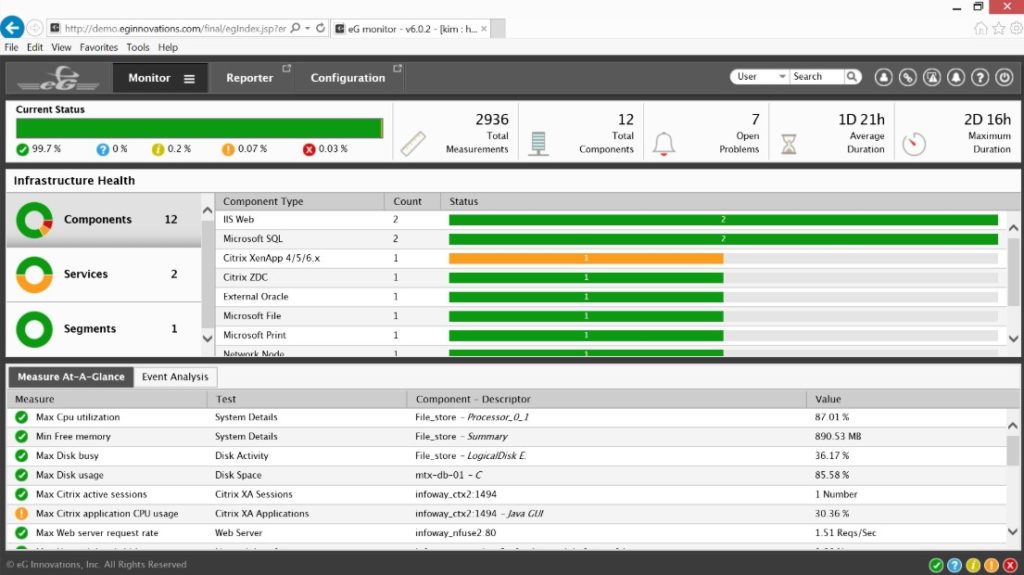
This tool provides several IT monitoring and performance utilities, including general monitoring, diagnosis, and troubleshooting tools for applications, networks, user experience, storage hotspots, servers, and virtualization. In addition, eG Enterprise provides SharePoint monitoring.
The monitoring features available through eG Enterprise afford you end-to-end visibility into your SharePoint setup, including sites and site collections, web applications and parts, databases, services, logs, events, and even content growth. You can monitor your entire SharePoint infrastructure and set up alerts to let you know if a bottleneck has occurred, or if an abnormal trend in behavior is taking place. With historical reporting capabilities, you can conduct capacity planning and perform diagnostics. The tool also makes it easier to troubleshoot, as you can more easily pinpoint which part of the infrastructure is causing the slowdown.
Using eG Enterprise, you can optimize performance with respect to SharePoint sites and web pages, and content. By measuring the availability of services (including search, index, or timer job), you can check whether your sites and pages are in good health. Reports provide information on user activity, trends, and content growth, all of which can give clues as to how your sites and pages are performing and being used. The tool also allows you to manage the size of your SharePoint database, and to predict capacity trends before they result in slowdowns.
Importantly, you can use the built-in user monitoring to measure the experience of users on your SharePoint site. Your analysis of the end-user experience can be narrowed down to geographical regions to pinpoint slowdowns, which will help you to determine which particular users have been affected, when it happened, and where they are. Drilling down into further detail assists with troubleshooting, empowering you to examine network latency and to determine whether the problem originates with the browser or with SharePoint itself.
Finally, eG Enterprise allows you to automatically map your SharePoint applications and their relevant infrastructure dependencies—including Active Directory permissions, database, network, storage, and virtualization dependencies. The automation capabilities include an “auto-baseline” feature through which you can set a baseline for the entire infrastructure, so the software will alert you to any performance anomalies potentially indicating an issue.
eG Enterprise offers a free trial as well as a demo.
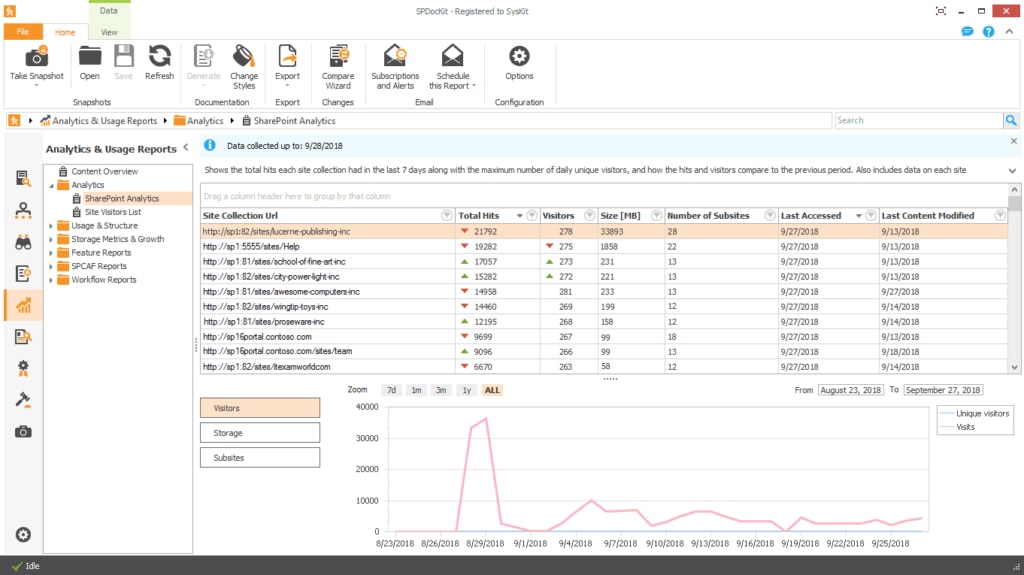
SPDocKit is a dedicated SharePoint administration tool for on-premises infrastructures. It allows you to monitor how users are interacting with your SharePoint sites, and to keep track of resource usage as content grows and changes. You can also view information on how many hits your content has received and see how trends change over time.
With respect to SharePoint permissions, you can view historical and real-time data on who has access to what; you can also view total access in a permissions matrix, making it easy to understand where access risks lie. You can manage these permissions through the tool itself, adding or breaking permissions inheritance through items or between groups and collections.
SPDocKit includes an interesting feature for working with SharePoint best practices, utilizing Microsoft best practice documents and checking relevant SharePoint configurations. This is a useful tool at a base level, but it’s important to note it only covers the practices embedded within the technical controls in SharePoint itself, as opposed to general management practices.
Finally, SPDocKit generates both comprehensive and summarized audit reports, giving you a view into audit settings and user actions over time. You can see who has viewed a document, whether any edits or deletions have been made, top users per site, and site collections by number of changes. This can help to flag risk factors and maintain compliance.
SPDocKit offers a free trial as well as a demo.
How to Choose the Best SharePoint Tool
SharePoint is an extremely useful Microsoft tool to help increase business efficiency and improve workflows in numerous ways. However, without monitoring and managing the performance of your SharePoint servers and applications, you won’t be getting everything you can out of it.
My top recommendation is SolarWinds Server & Application Monitor, which includes a wide range of utilities to support high-quality SharePoint performance and server monitoring from a centralized dashboard. Second on my list, SolarWinds Access Rights Manager addresses access rights within SharePoint. A crucial benefit of these tools is their ability to scale and connect with other SolarWinds software through the Orion Platform, empowering you to build a comprehensive solution for your organization.