
When operating within a large business network, it’s vital to understand which of your applications are dependent on which of your server and network resources. If a server or storage device goes down, or a part of the network stops functioning, this will have major impacts upon your dependent applications, and potentially your employees and customers as a result. Application dependency mapping processes will help you keep issues from affecting your end users, as with clear mapping approaches you can quickly troubleshoot, determine affected devices and applications, and create failovers and backups to ensure critical applications are protected.
- What Is Application Dependency Mapping?
- Best Application Dependency Mapping Tools – Premium
- Best Application Dependency Mapping Tools – Open Source
- Implementing an App Mapping Tool
There are numerous application dependency mapping tools available, including professional solutions, and free and open-source options. The tool you choose should be comprehensive enough to meet your needs, while simple and sufficiently easy to use so it doesn’t create an additional workload for your IT team.
After a quick review of application dependency mapping and why it’s important, I’ll present my top choices for application dependency mapping tools. My top choice is SolarWinds Server & Application Monitor, which provides several application dependency mapping features to help quickly map your network, servers, and applications, as well as tracking application performance more generally. It’s extremely user friendly and can be set up easily, either on its own or as part of the larger Orion® Platform suite of tools.
What Is Application Dependency Mapping?
Businesses today have several applications dependent on different servers and separate network devices. Application dependency mapping is the process of figuring out which applications are dependent on what, in the context of your entire network infrastructure. Following application discovery, dependency mapping looks at what applications you’ve installed on your devices, and then looks at how these applications are interconnected.
In the past, IT teams primarily performed application dependency mapping through the use of spreadsheets and regular technology audits and checks. However, there are now tools on the market capable of completing this process for you, so you don’t need to rely on an endless collection of spreadsheets tracking everything in your business IT infrastructure. Application discovery and dependency mapping is becoming a key part of most application performance management tools.
In the following sections, I’ll walk you through the best of these app mapping tools, both premium and open source, so you can simplify this process and focus your energy on more important tasks within your IT team.
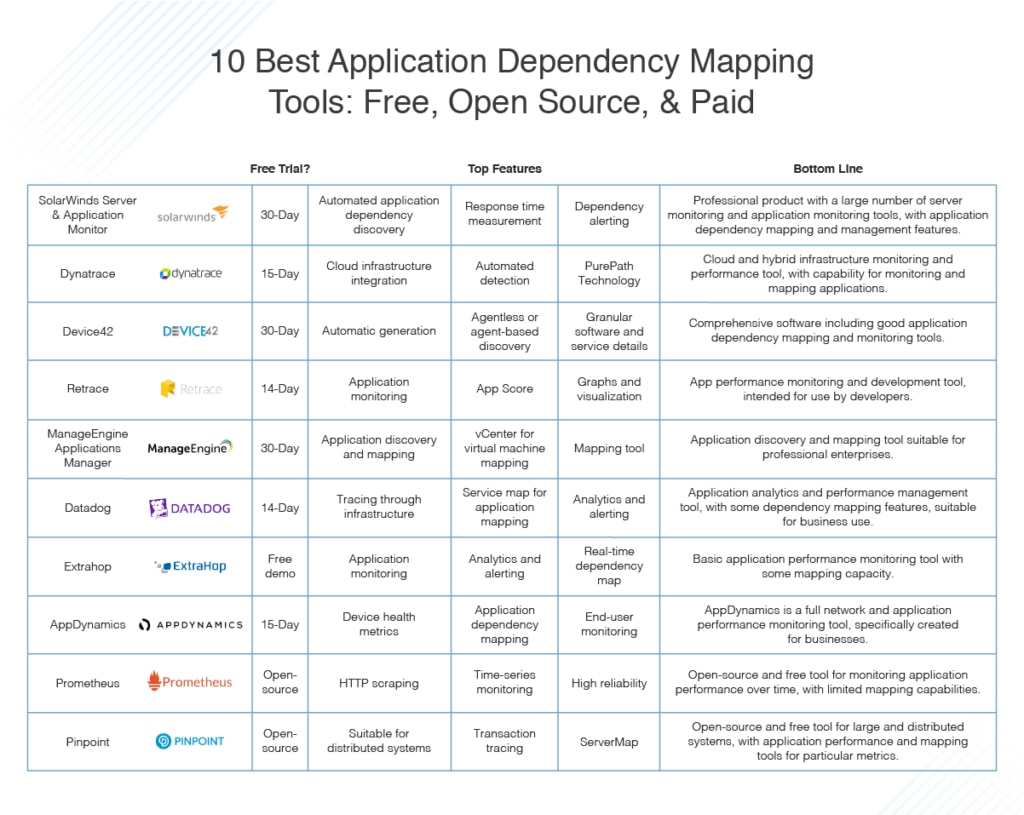
Best Application Dependency Mapping Tools – Premium
- SolarWinds Server & Application Monitor
- Dynatrace
- Device42
- Retrace
- ManageEngine Applications Manager
- Datadog
- Extrahop
- AppDynamics
- Prometheus
- Pinpoint
Below are my top choices for the best application dependency mapping tools. I’ll cover the professional solutions in this section. Then, for businesses looking to get a taste of app mapping or lacking the budget for enterprise-level software, I’ll look at a couple of open source and free options.
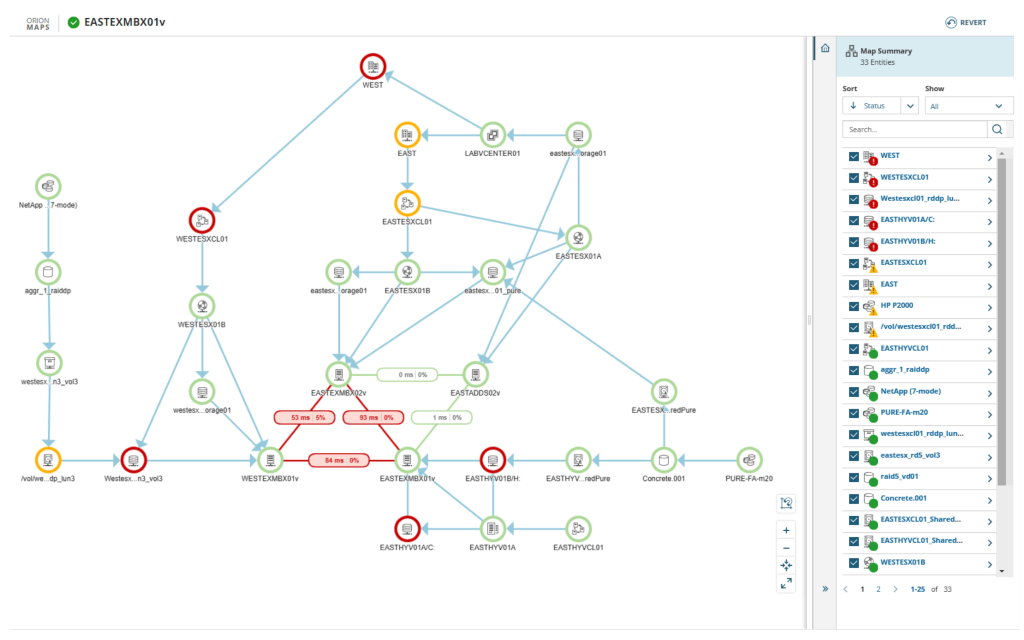
I consider SolarWinds Server & Application Monitor (SAM) to be the best app mapping tool on the market. It has several high-quality features capable of streamlining the application dependency mapping process, and utilities to keep your network and applications running smoothly in general.
To start, SAM will quickly and easily discover relationships between applications and servers, as well as related services and connection ports. This allows you to gain visibility across your entire infrastructure, with clear insights into how everything is connected and interacting. You can also see the internal resource consumption for your servers, incoming ports, and services, which can give clues as to how these components are performing.
Within these dependent services and infrastructure components, SAM can monitor each connection for performance information by looking at response times. For each dependent connection, SAM can examine network latency and packet loss, connection ports, and related services. This shows you whether network connection issues are behind any application delays you might be experiencing. SAM enables you to engage in proactive health monitoring for your network, to easily spot connection and performance issues before they affect your end users.
The tool includes alerting mechanisms for letting you know if there’s a problem with network latency, packet loss, or uptime, so if a problem arises in one of these areas you can troubleshoot before it takes down your applications for your end users. Alerting can be set up at levels other than the application layer, enabling you to troubleshoot servers and storage devices with many applications relying on them. This keeps your critical applications performing as they should and helps to ensure service delivery remains reliable.
In addition to these features, SAM offers a quick and easy setup and can be configured to monitor Azure and AWS infrastructure as a service, as well as platform-as-a-service and software-as-a-service infrastructures and systems. It also includes tools for server monitoring more generally, capacity planning, and monitoring for custom applications. It comes with out-of-the-box tools for monitoring and mapping critical applications including Exchange, IIS, Active Directory, Java, Apache, Citrix, and Oracle.
SAM offers a free trial for 30 days, during which it is fully functional. After that, you can get a quote for the cost for your business.
The Dynatrace platform includes great application performance management tools, with the ability to provide automated application dependency mapping. It can discover and monitor microservices and applications, even those running inside containers. It collects performance data and communication time data and highlights underperforming services and applications.
Dynatrace uses what it calls PurePath Technology, which collects information on transaction timing and any code-level issues or context affecting the way a transaction is carried out. The tool can examine databases and monitor their performance to determine whether they’re having flow-on effects on application performance. It provides numerous health metrics for these databases, so you can stay on top of how everything is operating and detect problems before they reach your critical applications.
The benefit of Dynatrace is it works well with cloud and hybrid infrastructures, having been specifically designed for monitoring systems with heavy reliance on cloud infrastructure. Unlike SAM, this isn’t a dedicated application and server monitoring tool: instead, it includes application monitoring as part of a larger offer. This means it might be suitable for a company looking for a broader monitoring solution, but if application mapping and monitoring is your primary need, you may find it isn’t comprehensive enough in that area.
You can try Dynatrace for up to 15 days for free.
Device42 is a specialized discovery and mapping tool, used for gathering and organizing data on your entire IT environment. It includes device discovery and asset management, and dedicated application mapping and management features.
The application dependency mapping tools included in Device42 are automatically generated, and are stored in a central repository of service, device, and application relationships and dependencies. Device42 allows you to set up scheduled discoveries, so your application mapping occurs on a continuous and rolling basis. You can also set it up to automatically notify you when it discovers a new piece of hardware, or if it detects prohibited software on your systems.
Device42 uses many different methods to discover your network and applications, and then map them. For Windows discovery it uses WMI, for Linux and UNIX discovery it uses SSH, and for all systems it uses SNMP discovery. It also uses NetFlow for NetFlow and NMAP discovery, and cloud discovery support for Amazon AWS, Microsoft Azure, Joyent, Linode, and Digital. It can also easily detect your network devices such as switches and load balancers, as well as power and environmental devices including PDU, UPS, and CRAC devices.
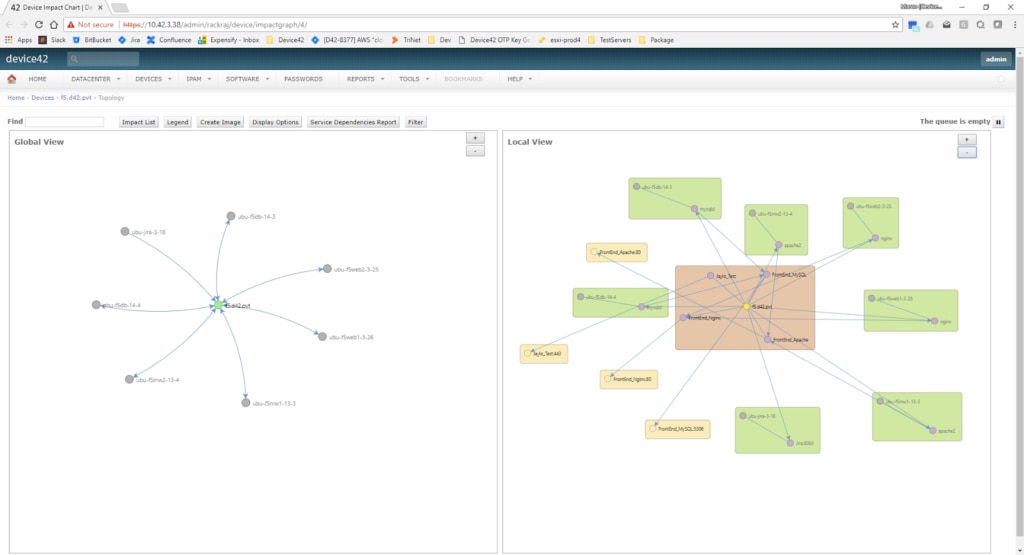
Once it has collected this information, it creates a comprehensive map of your infrastructure and services, as well as opening and listening ports and remote machines. This allows you to see which services are using which ports and to visualize dependencies for particular devices, including remote machines. You can also get a view into all the remote dependencies a server has, which means you can be confident about retiring assets when you need to do so, without worrying you’ll retire something with critical dependencies.
One other feature worth noting is the tool’s “Impact Lists,” which show you dependencies in a tree format, so you can see the impact a decision will have on a collection of dependent devices or applications. Finally, you can create auto-generated diagrams to view all of these different connections and dependencies in a visual manner.
Device42 offers a 30-day free trial.
Retrace, produced by Stackify, is an application performance management solution intended for use by developers. It includes tools for checking applications as you develop them and can then monitor performance once the applications have been deployed onto the network and are in use in your organization.
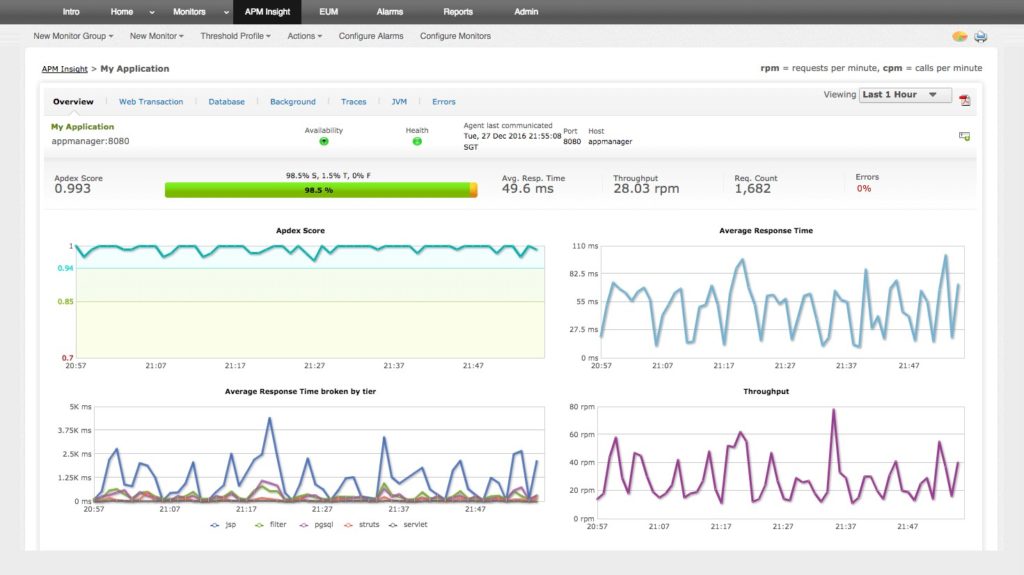
Retrace uses a combination of error tracking, application logs, and code profiling to let you know when there is a problem with one of your applications. It also helps you discover easy ways to troubleshoot your programs and optimize your code to make your applications better. It provides further insights into performance by checking how your applications are performing, based on response times. It combines all of this information to provide what’s called your “App Score” for each application, which makes it easy to spot underperforming applications.
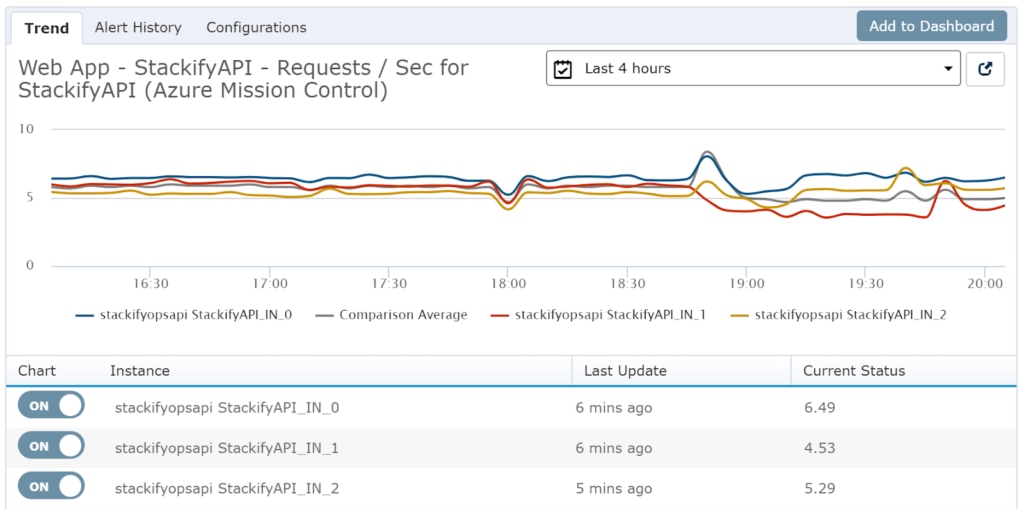
Although it doesn’t include extensive application dependency mapping tools, Retrace does look through your entire stack to determine your usage of different frameworks, examine the dependencies of your applications, and carefully monitor transactions between applications, servers, and end users. And it includes some great graphs allowing you to see different performance metrics across all instances of your applications, and to compare them in a visual way. This makes it easy to determine whether one particular instance of the app is having problems.
This tool is more suited for developers who want insights into their applications before they’re deployed, as opposed to IT teams in general, but it does allow for application performance management and includes some dependency analysis tools. It offers a free trial good for up to 14 days.
 ManageEngine makes an excellent tool called Applications Manager. This is a general-purpose server and application monitoring tool, like SolarWinds SAM, above. Like SAM, ManageEngine Applications Manager offers a single console to see your server and application performance data, which makes it easy to use. It supports a wide range of technologies, across server and database technology, virtual machines, cloud applications, web services, and other components.
Through dedicated application dependency discovery and mapping tools, it can quickly discover the resources on your network, including storage, applications, servers, and databases, alongside other network devices and connections. The vCenter feature was designed specifically for discovering resources in virtual infrastructure, and you can also specify ranges of IP addresses to look at resources within that range. With Applications Manager you can also schedule discovery to take place periodically, keeping you up to date with any new resources needing to be added to your infrastructure maps.
Applications Manager does the application mapping through its Application Discovery Dependency Mapping (ADDM) feature. First, you create a business service group, and then you associate all resources within the group using ADDM. This allows you to see all the discovered applications within the group, and the connections and dependencies between applications and their place within your infrastructure. On this map, you can view the status of your applications and locate malfunctioning components.
You can easily integrate Applications Manager with ManageEngine’s service desk tools. There is a free edition of Applications Manager, or you can trial the professional version for 30 days.
Datadog is a performance monitoring tool with application monitoring and mapping. It can collect what it calls “traces” throughout your infrastructure, including those matching particular customers, endpoints, or error codes, so you can easily track issues through the system for faster troubleshooting. These traces also allow you to correlate application performance with logs and metrics, so you can quickly pinpoint what is causing an application to malfunction.
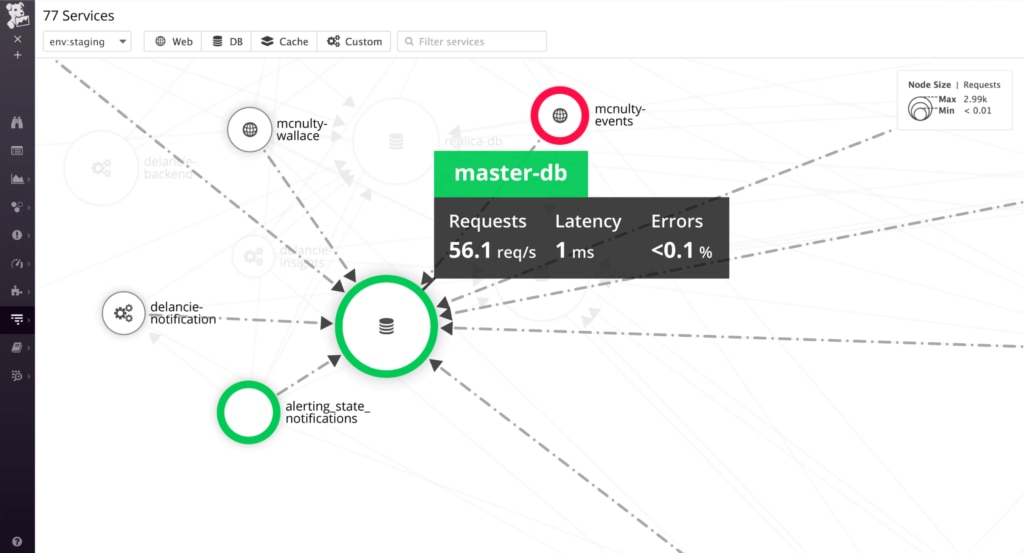
Another great feature of Datadog is the Service Map utility, which automatically maps data flows and can organize services by dependencies. The tool can update this map in real time, so you always have a clear overview of how your services may be affecting your applications, or any particular dependencies causing issues.
Finally, Datadog comes with application analytics tools, along with alerting features to let you know when an application isn’t performing as expected. The alerting feature is based on the machine learning tool Watchdog and can also work with performance dashboards and correlations between performance metrics.
Datadog offers a free trial for up to 14 days.
Extrahop produces several tools, including the ExtraHop Performance Platform, which allows you to engage with application monitoring features such as application mapping, dependency discovery, and performance analysis. It’s suitable for on-premises, cloud, and hybrid environments, and is intended to provide end-to-end visibility across your application stack.
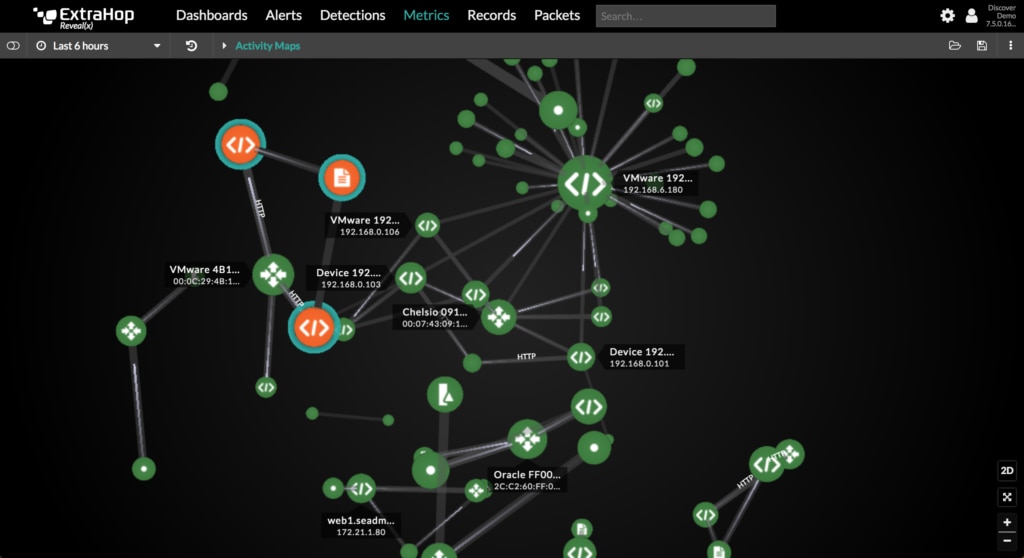
With regard to application dependency mapping, Extrahop analyzes your application connections and communications, and keeps a real-time application dependency map, so you can see at all times any potential or current risks and service disruptions. It can complete much of its mapping and analysis passively, to reduce overheads and work time for IT teams. In addition, like other tools, it includes analysis and alerting utilities to show you when an anomaly has occurred.
Although no free trial is available, you can access a free demo on the Extrahop website.
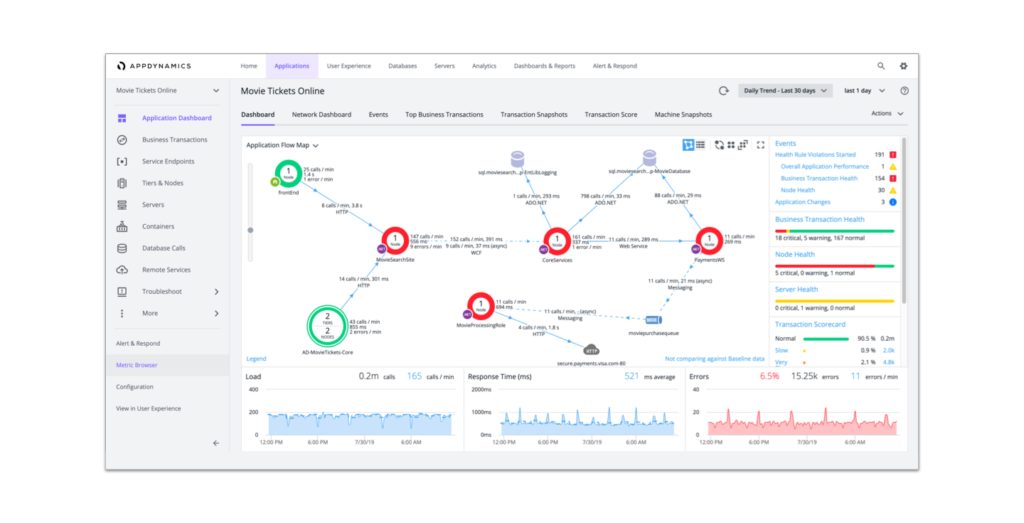
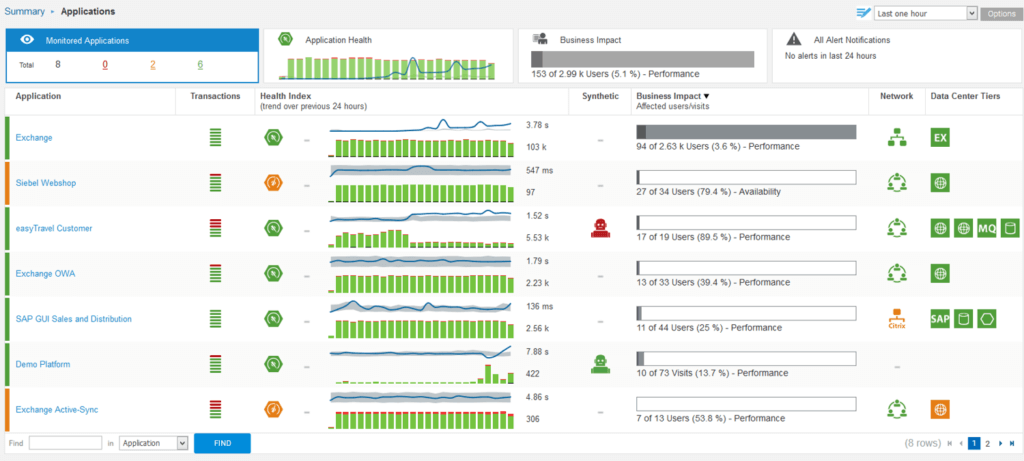
The final paid offering I’ll cover is AppDynamics, which is a Cisco tool for application performance management. With AppDynamics you can gain visibility into your server, database, and network health and performance, including metrics from individual devices. AppDynamics can monitor and report on disk I/O, throughput, CPU utilization, memory, and so on.
The tool can automatically discover your application and network topology, and can also map dependencies between applications, services, and devices. By looking at throughput, packet loss, and RT rates, AppDynamics can quickly pinpoint parts of your network that might be affecting application performance. The application mapping process is presented in an application flow map on the front page of the AppDynamics dashboard, allowing you to view real-time insights into your application health.
AppDynamics includes machine-learning-based anomaly detection and real-time root-cause diagnostics. This leads to fast and simple troubleshooting, so problems with your infrastructure affect your application users as little as possible. Alongside these features, AppDynamics comes with end-user monitoring, so you’ll know when errors, crashes, or problems occur. This helps you to quickly identify front-end issues and get to the root of the problem quickly. You can connect these end-user problems with transactions on the back end, to see if a transaction or connection in your infrastructure has directly impacted the user’s experience.
AppDynamics offers a free SaaS trial, good for 15 days.
Best Application Dependency Mapping Tools – Open Source
That covers my top choices for paid application dependency mapping tools. Open source and free application dependency mapping tools are also available. However, when considering the selection of application dependency mapping tools, remember, free or open source options can be great to start with, but may not have the extensive documentation and support features you’ll get with a professional solution. Here are my two top free application dependency tools.
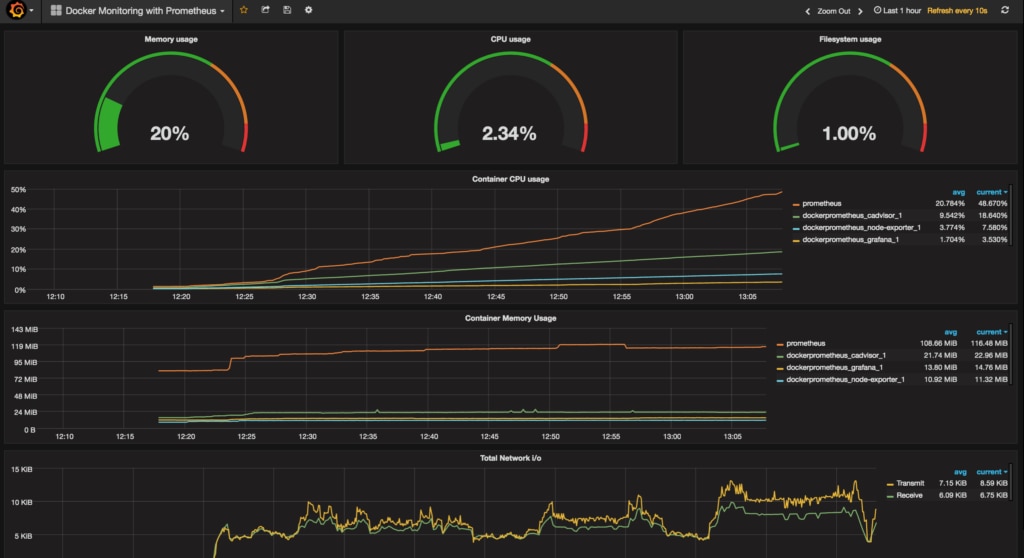
Prometheus is the most popular open source application performance monitoring solution on GitHub. It works by scraping metrics from HTTP endpoints on any of the targets you have set for monitoring. It looks primarily at time-series data, so you can see how application performance or metrics change over time, and can also query, graph, and alert you to any major changes or variations in behavior.
One of the key things Prometheus is built for is high reliability and uptime, but it may not give you super-detailed data or show you much information about different metrics in dimensions other than time series. It’s suitable for use in a dynamic or cloud-based environment, but may not be so usable in a large, enterprise infrastructure where highly detailed information is required for reporting purposes.
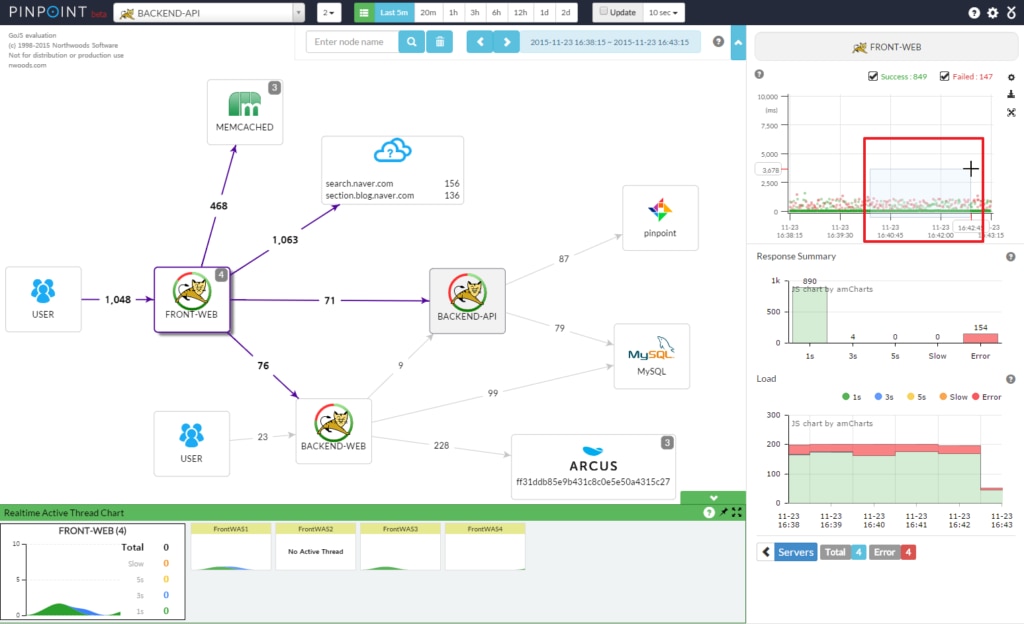
Pinpoint is another free application monitoring solution, particularly intended for large systems. It primarily focuses on tracing transactions between distributed applications to examine overall structure and health. Pinpoint’s primary benefits are that you can monitor your applications in real time and gain a clear and quick insight into application topology.
The tool produces a server map, which shows you each of your service components and applications, including transaction flows and bottlenecks. Selecting a component shows you information about current status or health, as well as transaction count. For each application, you can also see CPU usage, memory, TPS, and JVM arguments. As with other tools, you can set up Pinpoint to alert you if an application starts behaving unexpectedly.
While this is a good tool, it’s primarily geared toward developers and IT experts, and may not be suitable for someone who needs a more user-friendly UI.
Implementing an App Mapping Tool
If you’re looking for an application dependency mapping tool, there are a huge number available to you, including free and open source options if you want to trial app mapping for a smaller business or test out the concept. Professional solutions are increasingly comprehensive and user friendly and can simplify the process of troubleshooting when you have a problem with one of your applications, servers, or network devices. My favorite is definitely SolarWinds Server & Application Monitor (SAM), due to its easy integration with other tools, extensive toolset, and easy-to-use core features. In any case, you can access free trials of most of the tools above, to find one suiting your business needs. You can also test drive SAM with a free demo.