
Java is a common development language in part because of how well it works for programming tasks involving objects. Because so many organizations rely on Java applications for business-critical functions, providing adequate resources for these apps is essential.
Running Java applications on Java Virtual Machines (JVMs) rather than on physical hardware can increase an organization’s computing power without the overhead expenses of additional hardware. However, as simultaneously operating several Java applications can put a drain on available resources, developers need to proactively monitor their apps to ensure they’re performing reliably.
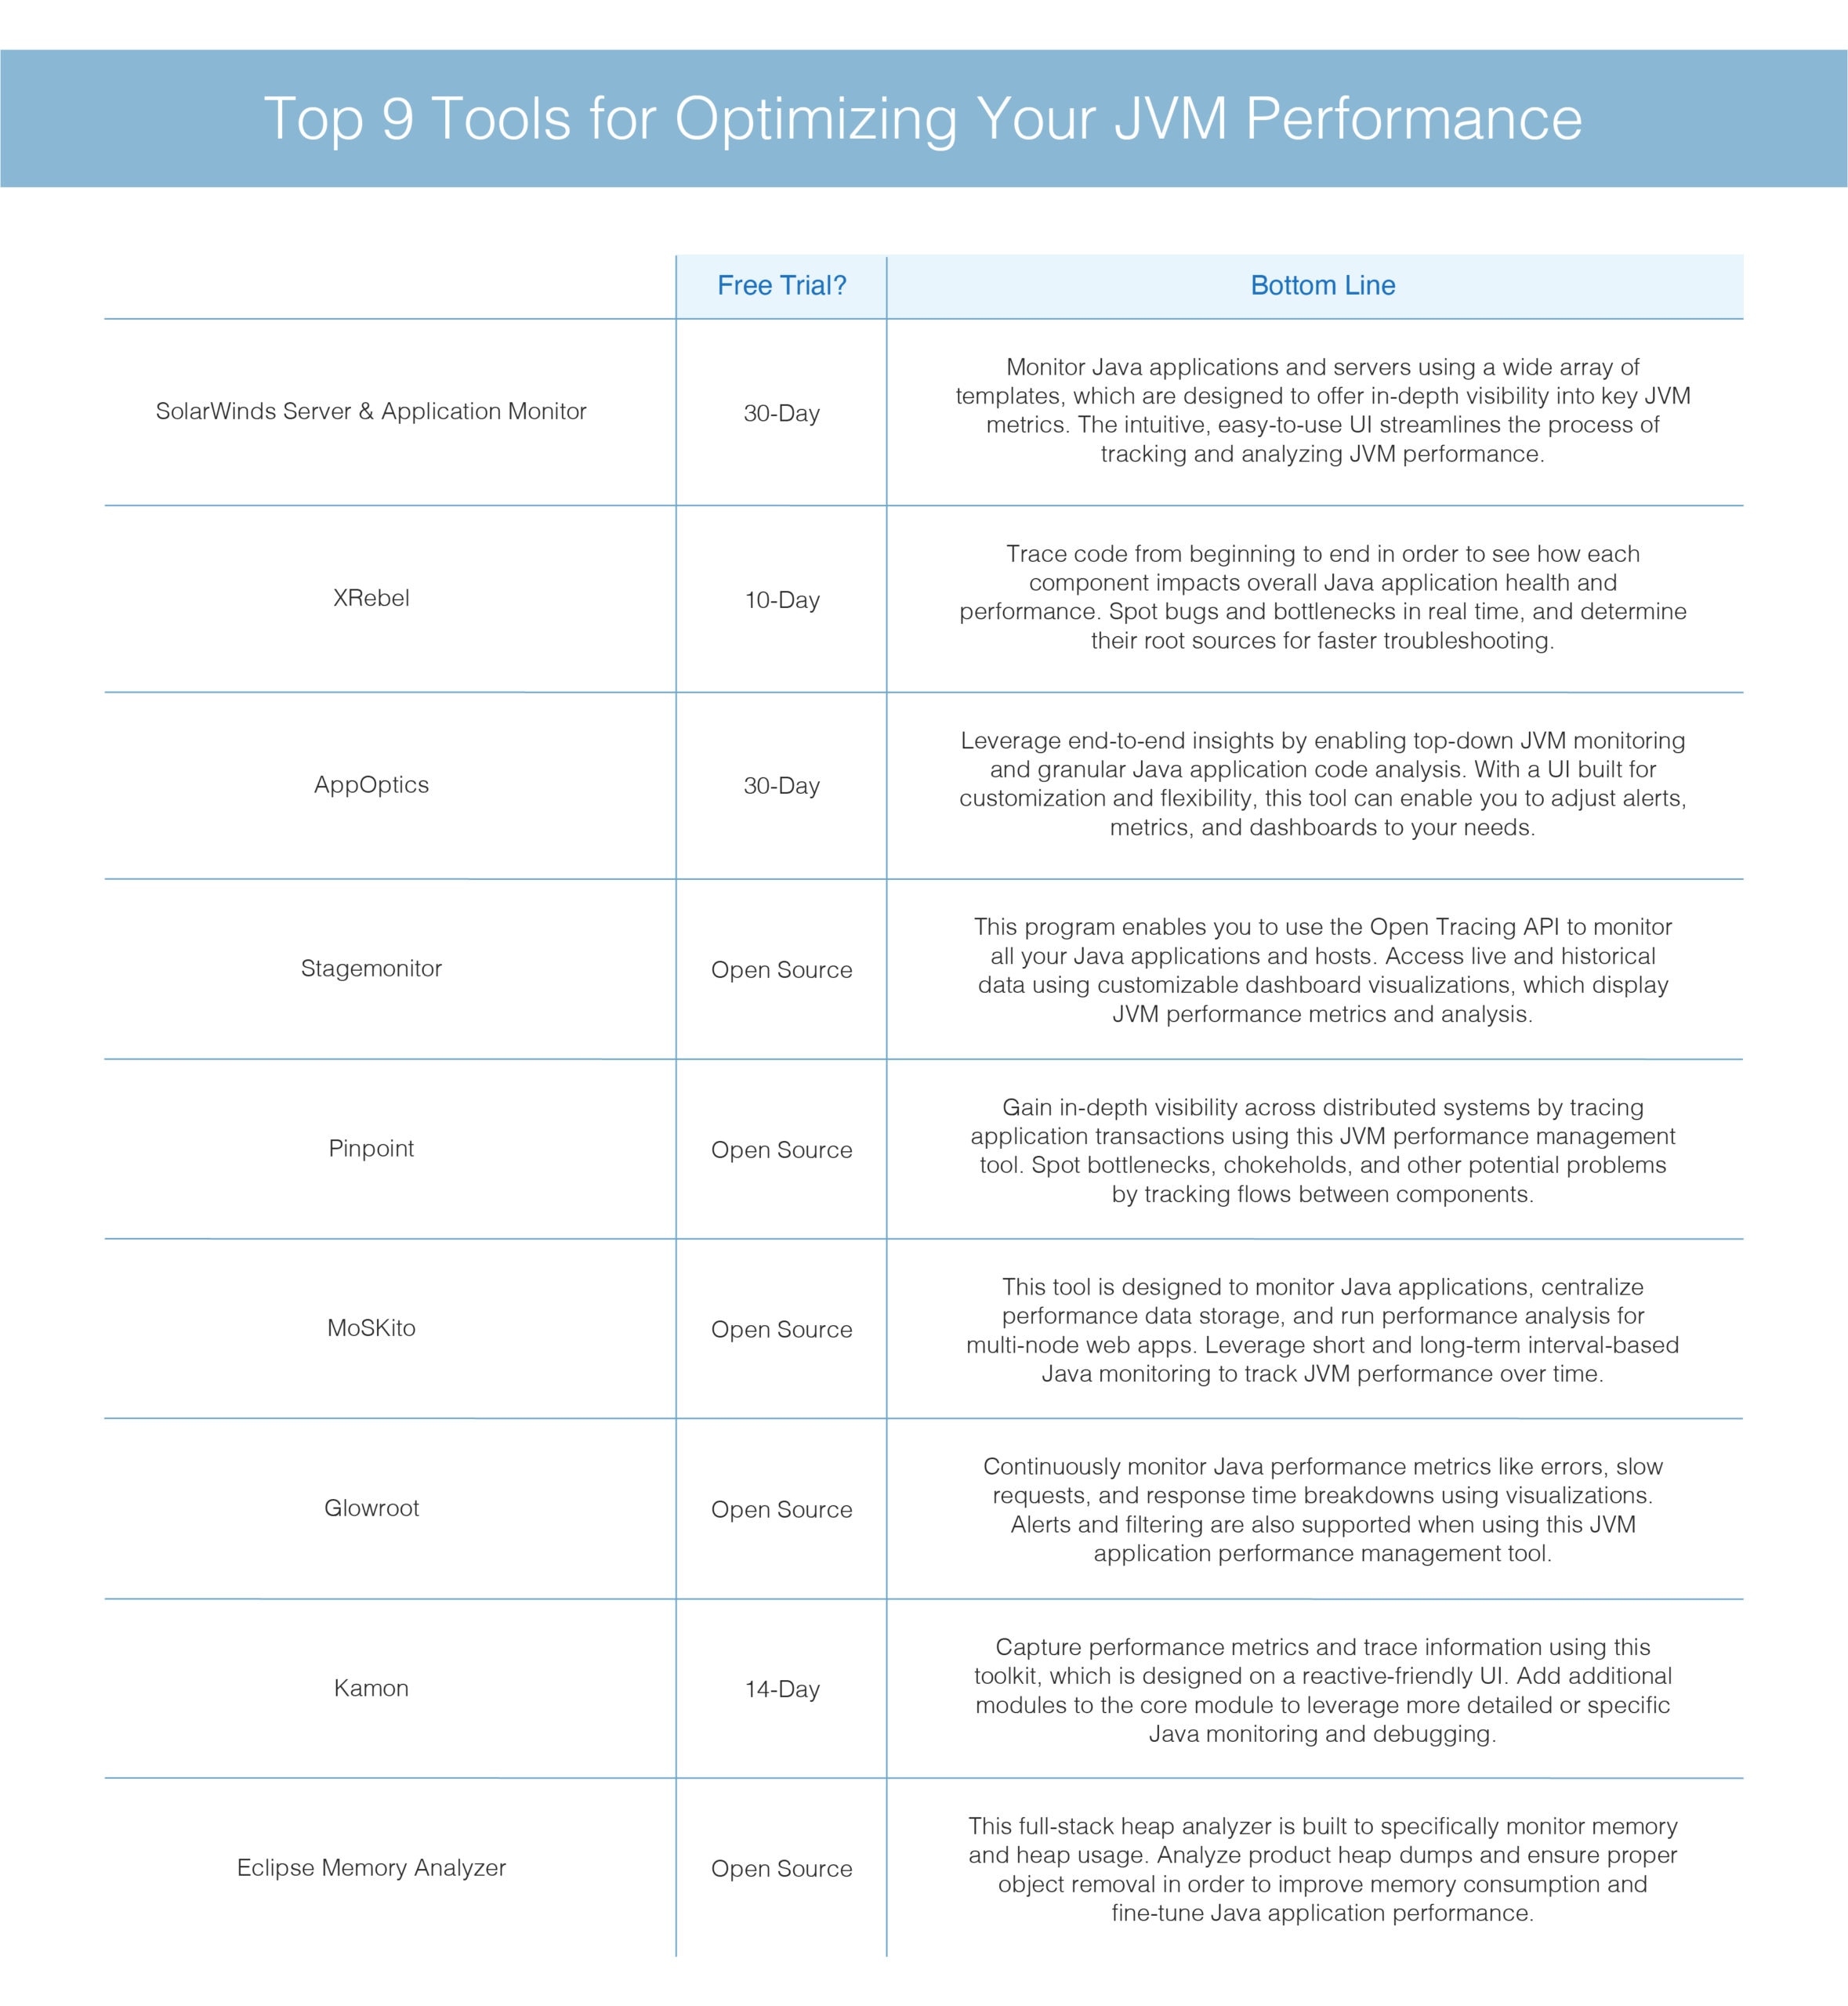
JVM performance tuning is labor-intensive if you take a manual approach. That’s why so many developers choose to streamline the process by using Java monitoring software. JVM performance tuning tools are available to make the optimization process easier, faster, and more effective. We recommend the following:
SolarWinds AppOptics
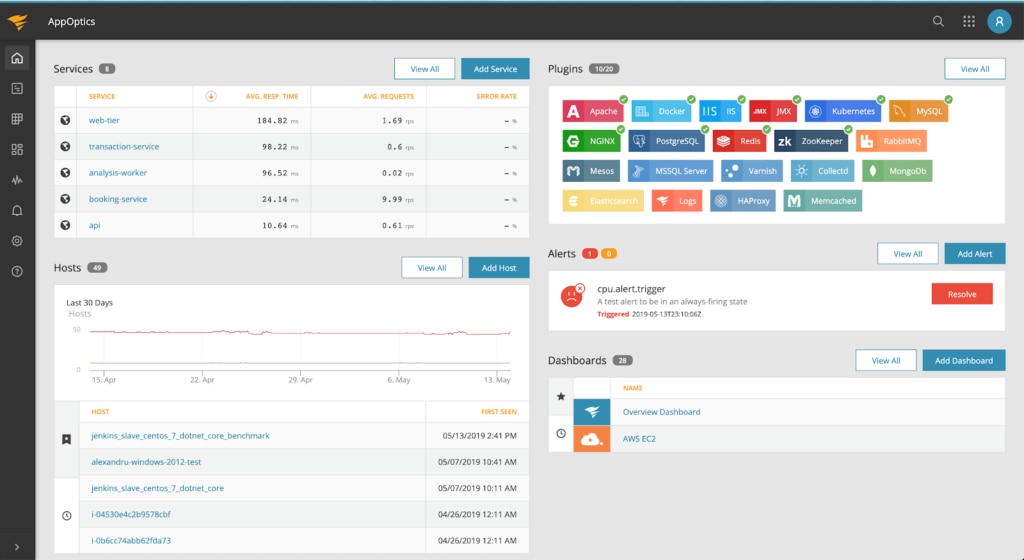
AppOptics is a business-grade tool with several important functions, from top-down monitoring of application performance to granular analysis of each application’s code. AppOptics collects performance metrics regarding active threads, Java heap usage, and response time to target tuning efforts. Developers can leverage these end-to-end insights when doing Java performance tuning. This tool’s real-time information display allows for swift and simple optimization for any application.
The Java performance monitor in AppOptics comes packaged in an easy-to-navigate user interface. This interface can be customized with preset or proprietary plug-ins to provide increased flexibility for monitoring Java web applications. Right out of the box, AppOptics includes open APIs for seamless integration with Snap and Telegraf ecosystems.
AppOptics also offers comprehensive monitoring capabilities for application and infrastructure performance beyond Java applications, making it a powerful monitoring solution across the board. Like other SolarWinds programs, it’s highly customizable, with the ability to create and modify alerts, monitored metrics, and dashboard views according to your needs.
SolarWinds Server & Application Monitor (SAM)
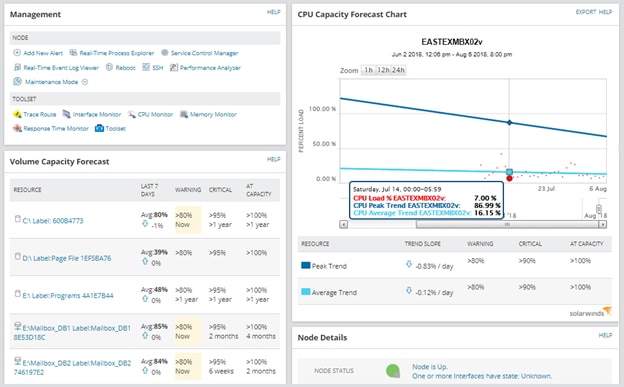
Server & Application Monitor (SAM) is designed to leverage comprehensive and customizable monitoring for Java servers and applications. Unlike tools built to monitor Java code, SAM is built to let you create targeted templates that support in-depth visibility into key Java applications and servers. By monitoring vital JVM performance metrics such as database, memory, availability, latency, and uptime, SAM can enable you to assess the overall health and performance of Java application servers and JVMs.
There are over 1,200 out-of-the-box monitoring templates and template customizations you can leverage on SAM to monitor JVM performance—including various templates built to poll available managed beans (MBeans), enact SNMP polling, determine JSON/SOAP, validate returned content, and more. Because the SAM platform is centralized, it’s designed to bring all these critical Java performance metrics together in one place. SAM is also built to be intuitive for end users and integrate well with other SolarWinds tools.
Stagemonitor
An open-source tool, Stagemonitor uses a Java monitoring agent designed to help boost the efficiency of optimizing performance across clustered application stacks. Using the Open Tracing API, this program synthesizes and correlates requests across distributed systems, and only needs one instance to monitor all applications and hosts. It keeps a record of historical and live data—gathered directly from the cluster or developer server—and sends alerts based on certain thresholds defined by the developer.
Stagemonitor’s dashboard generates visualizations based on the monitored performance metrics, as well as analysis indicating where developers should turn their attention first. The dashboard can also be customized to include custom and third-party plugins and includes a browser widget—with no back end required—to give developers instant feedback about sub-optimally performing applications on the current page. Stagemonitor also provides support for non-servlet-based apps.
Pinpoint
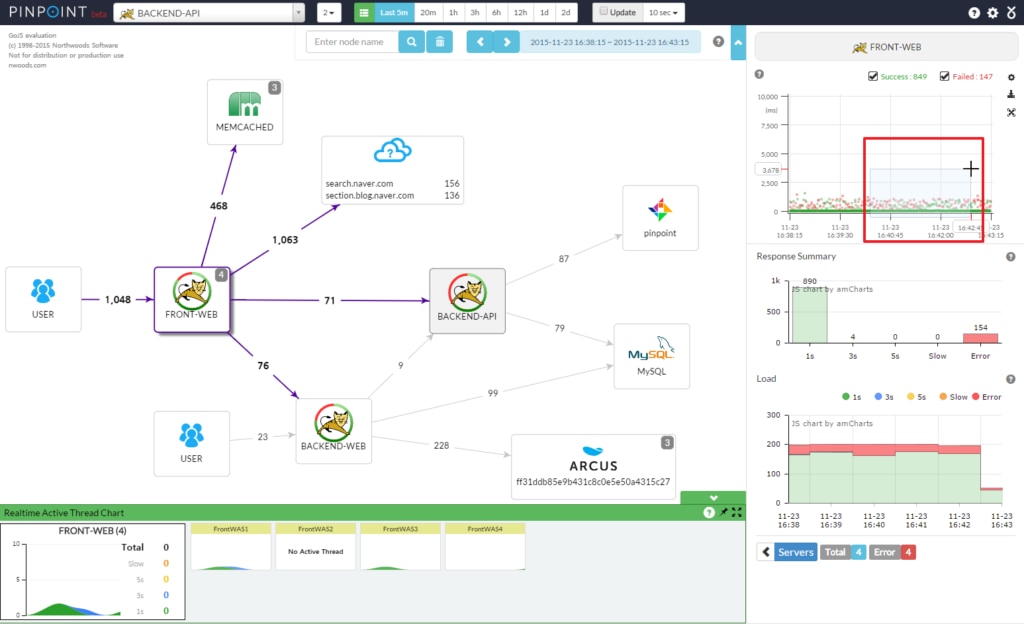
Pinpoint is an open-source application performance management tool designed to provide developers with an in-depth wealth of information culled from across distributed systems. Pinpoint traces application transactions, analyzing system structure to determine how efficiently the individual interconnected components are working. By tracking the flows between component, Pinpoint identifies potential bottlenecks and chokepoints.
Pinpoint’s dashboard maps out connections between components and offers real-time Java monitoring for active threads, while also tracking request count and response patterns. This allows developers to quickly spot potential problem spots within the system. This tool’s agent doesn’t alter code when installed, allowing developers to run sample instances on their own machines.
MoSKito

MoSKito’s approach is three-pronged: it monitors Java applications, centralizes performance data storage, and runs performance analysis for multi-node web apps. This free tool uses short- and long-period interval-based Java monitoring to detect anomalies and to chart JVM application performance over time.
It collects a range of performance metrics—from threads and memory usage to load distribution and SQL query time—and supports major app servers like JBoss, Jetty, Tomcat, and WebLogic. The tool is largely non-invasive, as it analyzes and measures code without making alterations.
MoSKito also works to ensure your JVM application data is kept safe—all analysis and storage processes take place locally without the use of any external servers. The company also offers a mobile app so developers can conveniently keep track of their applications wherever they are.
Glowroot

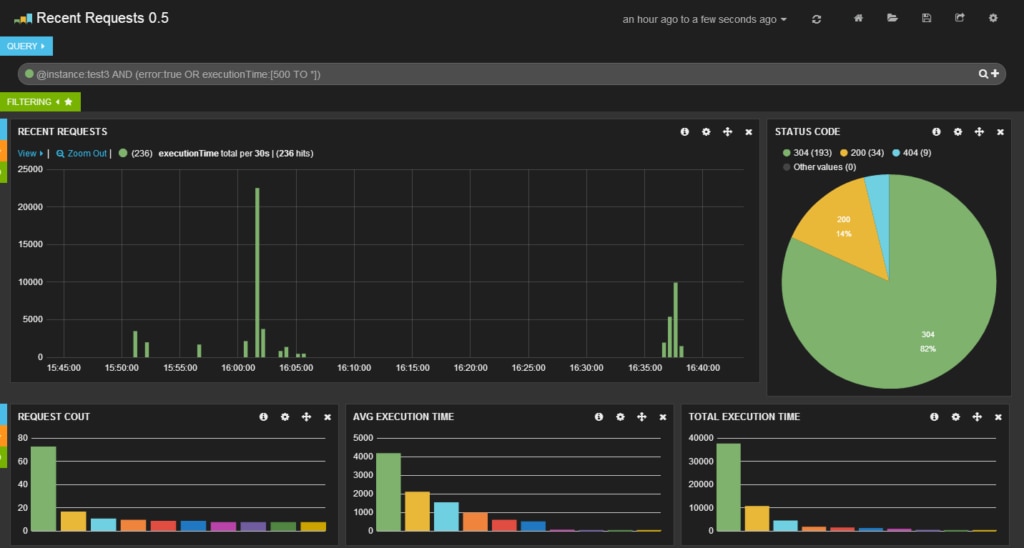
Glowroot is a low-overhead, open-source application performance management tool designed for ease of use and performance. It tracks slow requests and errors, while also logging trace time for every user action within the application. Glowroot monitors other metrics, like SQL capture and aggregation, Java developers can use for performance tuning.
In addition to presenting short-term and long-term performance data, Glowroot creates visualizations of response time breakdowns and percentiles, and can be used to monitor applications via desktops and mobile devices. Once running, Glowroot provides continuous profiling, alerting, and filtering systems, and support for a range of application servers.
Kamon
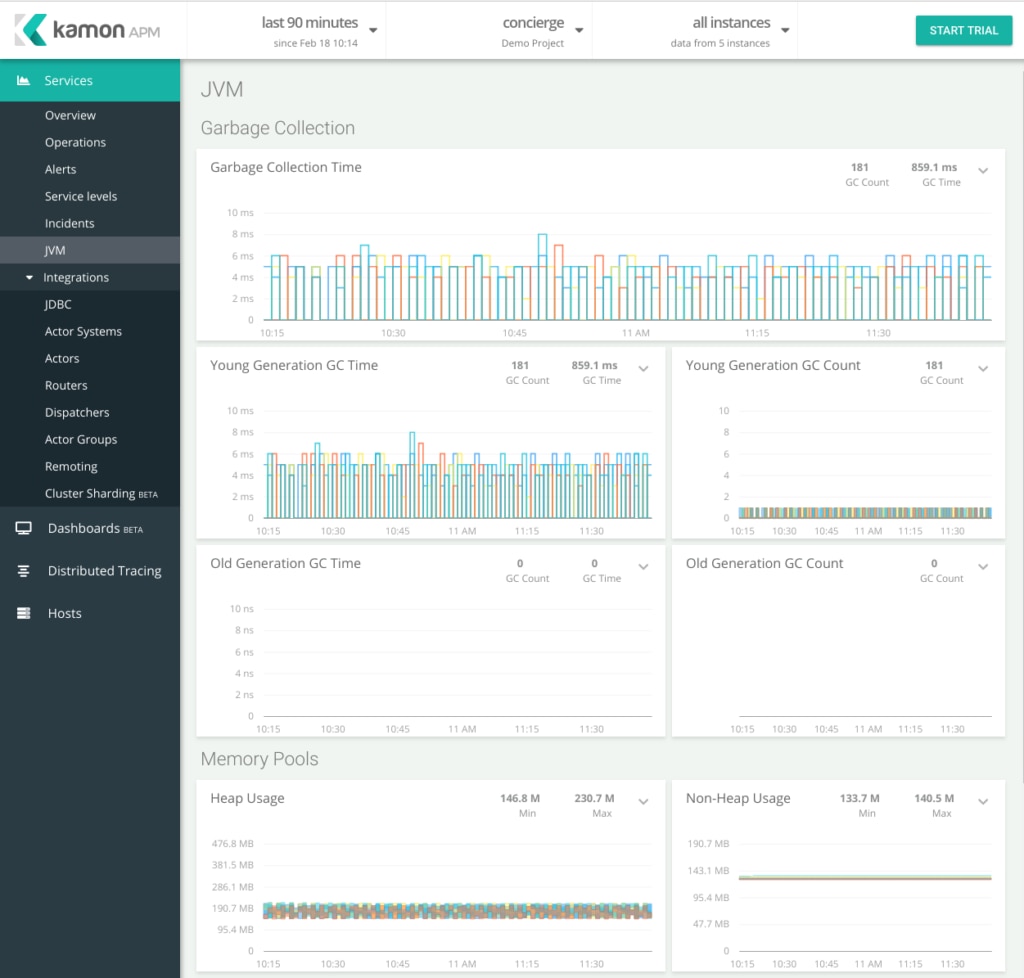
Kamon is a toolkit designed for Java monitoring and debugging product deployments. The relatively simple API is reactive-friendly and offers support for JVM platforms and languages but is especially designed for the Typesafe Reactive Platform.
Kamon’s structure is a core module that captures performance metrics and trace information, but additional modules can be added to provide more detailed data or specialized functions. This allows developers to monitor the entire stack from a single dashboard, while leveraging useful integrations to record application function data and manage entity registration, among other processes.
Eclipse Memory Analyzer
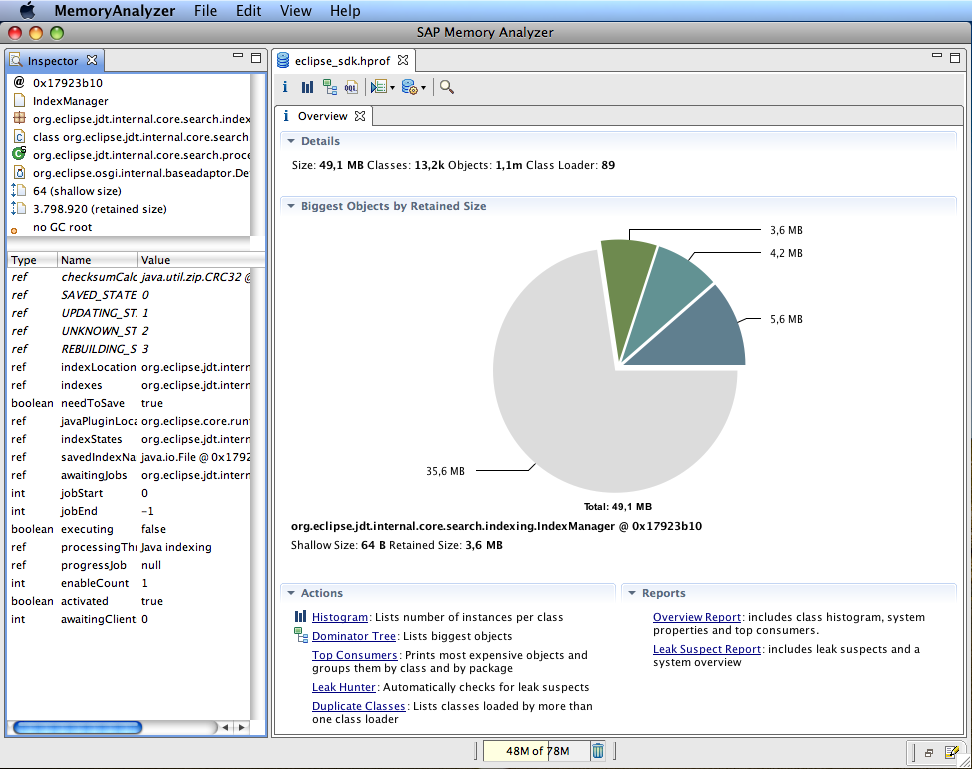
Eclipse Memory Analyzer is an open-source Java monitoring tool specifically targeting one of the most important JVM performance metrics: memory. As applications run, they cause the heap—where all Java objects are stored—to vary in size. It’s important for developers to monitor heap usage, as a full heap greatly increases the risks of bottlenecks and web application slowdowns.
This full-stack heap analyzer is built to assist developers in JVM performance tuning by making it easy to set usage policies and allocate memory consumption. Eclipse Memory Analyzer can analyze productive heap dumps—up to hundreds of millions of objects—and works with the garbage collector to ensure it’s removing only the correct objects. The tool also includes a reporting system developers can use for extracting leak suspects.
XRebel
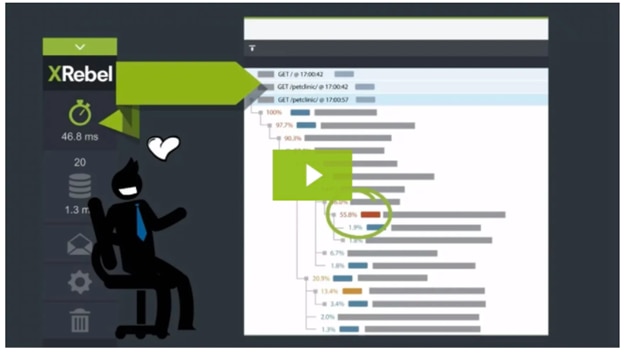
XRebel is a JVM performance tool built to let developers trace the impact of code from beginning to end. By leveraging increased visibility into your Java applications structure, XRebel can enable you to understand how each individual component is affecting the entire application. This request-based approach to Java monitoring can help IT administrators easily discover, identify, and remove JVM performance bottlenecks or bugs.
Along with code tracing, XRebel is made to leverage real-time performance metrics for Java, as well as logs, exceptions, and input/output—even across distributed applications. You can access this critical JVM data on a sleek UI, which displays database information on an easily accessible easy-to-read tree menu. This can enable you to determine the root sources of exceptions, and whether they need to be addressed right away.