
Uptime is of critical importance for your company’s networks and systems, alongside its website and web service delivery. It has a direct impact on your company’s ability to support end users and deliver services. Not maintaining high levels of uptime can significantly interfere with a business’s ability to work productively or impact user satisfaction by making a website inaccessible. Either way, it can translate into significant financial losses.
However, establishing high uptime for any element of your network or infrastructure can be tricky. There are numerous components potentially contributing to downtime, and these triggers need to be monitored to reduce the risk of downtime occurring on your systems. Because there are so many potential downtime triggers, manual monitoring is a difficult, time-consuming, and resource-consuming task. Employing an uptime monitor is a highly effective way of maximizing availability in the most economical way possible.
There are many server uptime monitoring tools for you to choose from, including open-source, closed-source, enterprise-grade, and free uptime monitoring programs, each with its own merits and disadvantages. In this guide, I’ll help you decide between the best uptime monitoring software, open source and closed source, on the market. I’ll also give consideration to the best free server uptime monitoring software, for those of you who have your heart set on an unpaid solution.
Before going into the best network uptime monitors, I’ll first outline the basics of uptime monitoring. If you want uptime alerts and diagnostics embedded in a more complete network solution, SolarWinds Network Performance Monitor provides extensive monitoring tools for on-premises, cloud, and hybrid environments.
Skip to “The Best Uptime Monitors” List >>>
With regard to free server uptime monitoring tools, a free edition of ipMonitor is available and is well-regarded among experienced administrators. SolarWinds itself has a reputation for producing some of the best monitoring and management tools across the board.
What Is Uptime?
Uptime is a measure of the percentage of time an element of your network or system is working as intended. Website uptime specifically refers to the time a web service or website is live and available to users over a given period. For any element of your system, whether it’s the network, hardware, system, or website, the aim is to establish close to 100% uptime, meaning the system element is constantly available. Industry standards consider 99.999% uptime to be indicative of high availability. This is because every element of your system experiences downtime at one point or another, planned or not. By considering 99.999% uptime, otherwise known as “five-nines availability,” as high availability, the industry acknowledges the reality of occasional downtime while still aiming for near-constant uptime.
How to Calculate Uptime Percentage
In its most basic form, uptime is the downtime subtracted from the total time. The formula for calculating the percentage of uptime, as stated above, is simply uptime divided by total time. An uptime of 99.999%—high availability—allows for 5.25 minutes of downtime in a single year.
Five-nines availability, however, is difficult to achieve. If the system or service is mission critical, as with hospital systems, then five-nines availability should always be the goal, because any downtime could have dire consequences. However, for systems and services not considered mission critical, 99.99%—which translates to 52 minutes and 36 seconds of downtime each year—is considered a good uptime ratio. A ratio of 99.98%—70 minutes and 7 seconds of downtime each year—is thought of as decent, and for some businesses might not pose a financial liability.
Bear in mind, these figures account for actual availability, but don’t represent other factors, like function and overall performance. A system or service can experience other issues making them potentially unusable, even if high availability is achieved.
Cost of Downtime
According to a 2016 study by Exigent, an hour of down time, depending on the size of the business, can cost an organization between $9,000-$700,000 with an average of around $164,000 of lost revenue per hour. This figure is supported by a study conducted by Information Technology Intelligence Consulting in 2019, in which 98% of businesses surveyed claim one hour of downtime costs them at least $100,000. Also, about one-third of businesses in the study claim a single hour of downtime can cost $1 million, and sometimes more than $5 million.
Downtime costs are determined by several factors, including how many employees would be impacted if critical data became unavailable, the average hourly wage of the impacted employee, the per-hour overhead cost of the impacted employees, and the amount of revenue lost per hour because of data unavailability.
Main Causes of Downtime
Understanding the multiple and common factors causing downtime can help you prevent it from happening—and assist you in fixing it when it does. It also emphasizes the importance of having an effective up/down monitoring strategy or server uptime tool designed to cope with the full range of downtime triggers.
In the Exigent study, network outages were found to be the most common reason for downtime, accounting for about half. The study also found while network outages account for 50% of down time, human error is the leading cause of downtime by data volume and among large volume sites. Human error accounts for 58% in large volume sites and 44% in others. Overall, human error accounts for 45% of all downtime. Other common causes of downtime of note in the report include:
- Server failures
- Storage failures
- Application errors
- Power outages
- Usage spike and/or surges
Best Uptime Monitors
Given the cost of downtime and the range of factors potentially causing or contributing to it, having an effective uptime monitor at your disposal is fundamental to a successful business continuity plan. The following products have been chosen with consideration of their user-friendliness, their range of capabilities, how advanced they are, and their suitability for business use.
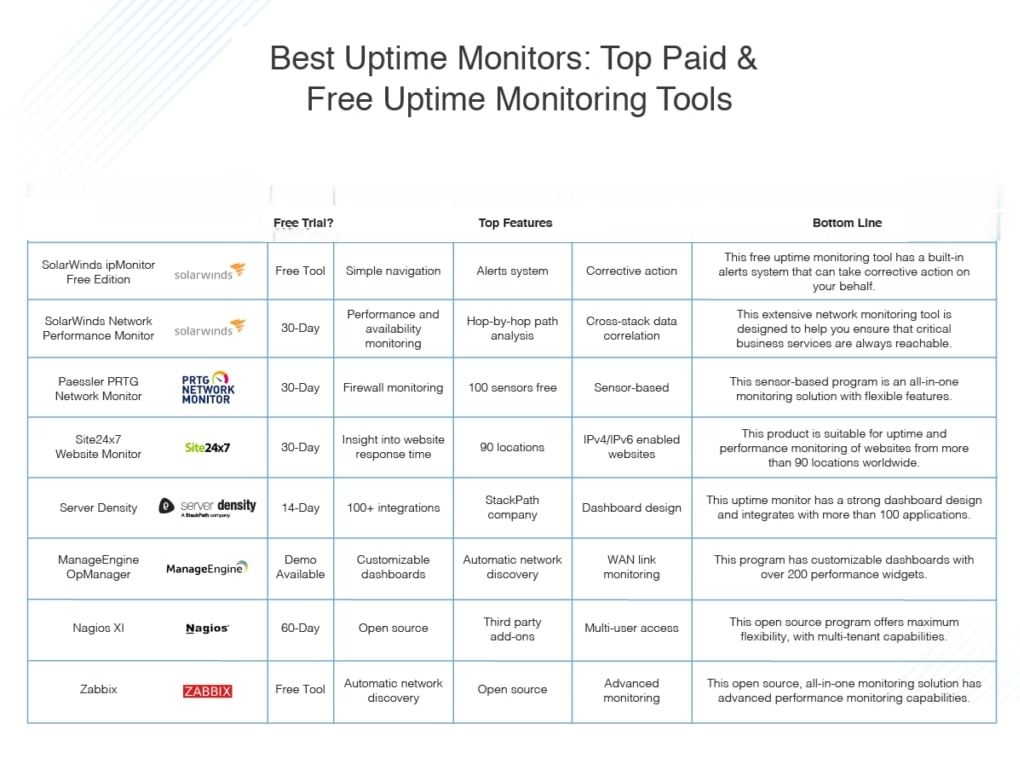
1. SolarWinds ipMonitor Free Edition
This is a free uptime monitoring solution providing a quick and agentless approach to safeguarding and boosting availability. Like the paid alternative, SolarWinds ipMonitor Free Edition benefits from an easy-to-use dashboard, with five main pages located in the top navigation bar: Dashboard, Devices, Reports, Configuration, and THWACK. This program is surprisingly generous, considering you don’t have to pay a single dollar for it. It enables you to monitor applications, servers, and network devices. Assuming your needs are limited to a small environment, this uptime monitor offers an essential IT monitoring solution.
The free version of ipMonitor supports alerts, keeping you up to date on any performance or availability issues. It’s capable of automating remediation actions, and it gives you access to built-in reports to help with planning and troubleshooting. The tool provides essential status and performance insights into up to 50 monitors, including up down device status. You’ll gain visibility into CPU, memory, and disk usage, and any performance issues associated with critical processes and services.
Under the Configuration tab, you can configure alerts to help you uncover failures before they impact your users. You can name an alert whatever you like, enable it, and determine whether listed or unlisted groups, devices, and monitors are to be alerted. You can also set up actions to be triggered by each alert. Corrective actions taken by the software could include rebooting a server or executing a script.
This tool runs on one machine, with minimal system requirements, so it’s great for small environments. The startup wizard offers you tips and recommendations on configuration settings, enabling you to start monitoring within a matter of minutes. And with automatic discovery of devices, you don’t have to waste time adding each manually.
This 100% free server uptime monitoring software is ideal if you have low requirements, but it’s not especially suited to business use. You can request an email link to ipMonitor Free Edition by entering your details here.
2. SolarWinds Network Performance Monitor
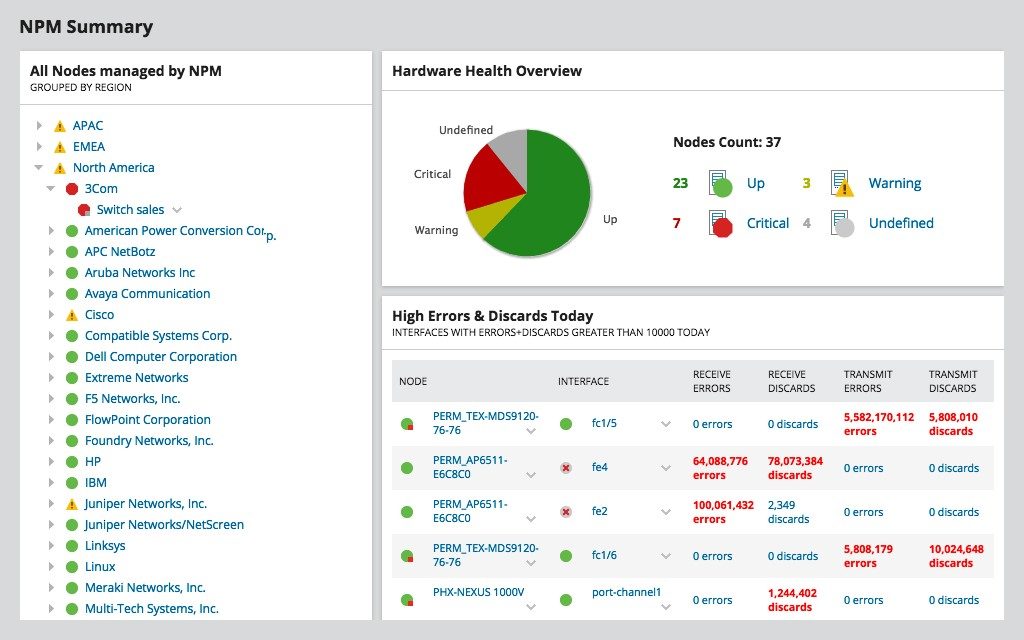
SolarWinds Network Performance Monitor is an extensive network monitoring tool designed to help you ensure your critical business services are always reachable. The tool offers network uptime monitoring solutions for a wide range of vendors to help reduce downtime and optimize network infrastructure.
NPM includes fault, performance, and availability monitoring as well as hop-by-hop network path analysis to help ensure your business services are being delivered without interruption. The tool also includes cross-stack network data correlation services designed to help you get to the root cause of downtime quickly. With NPM, you can drag and drop network performance metrics onto a shared timeline, so you can see an immediate visual correlation of the data from across your network.
NPM goes even further when it comes to data correlation. The tool also lets you automatically discover and map devices from across your network, while collecting and correlating performance metrics, wireless coverage, and link utilization, so you can clearly see everything occurring on your network. This visibility means you can troubleshoot outages and other issues capable of causing network downtime before they impact your network and your users.
One of the most useful features in NPM is NetPath—a feature giving you insight into what’s happening both inside and outside your network. The NetPath feature lets you view traffic, configuration, and performance details of your network devices and applications in cloud, on-prem, or hybrid environments. With NetPath, you’re able to quickly prove your network’s mean-time-to-innocence, meaning you know when to contact external network providers regarding internet connectivity and thus uptime.
Like other SolarWinds offerings, NPM comes with high-quality, intuitive dashboards and automated intelligent alerting, capacity forecasting, and reporting designed to help you prevent network downtime. NPM offers a fully-functional free 30-day trial.
3. Paessler PRTG Network Monitor
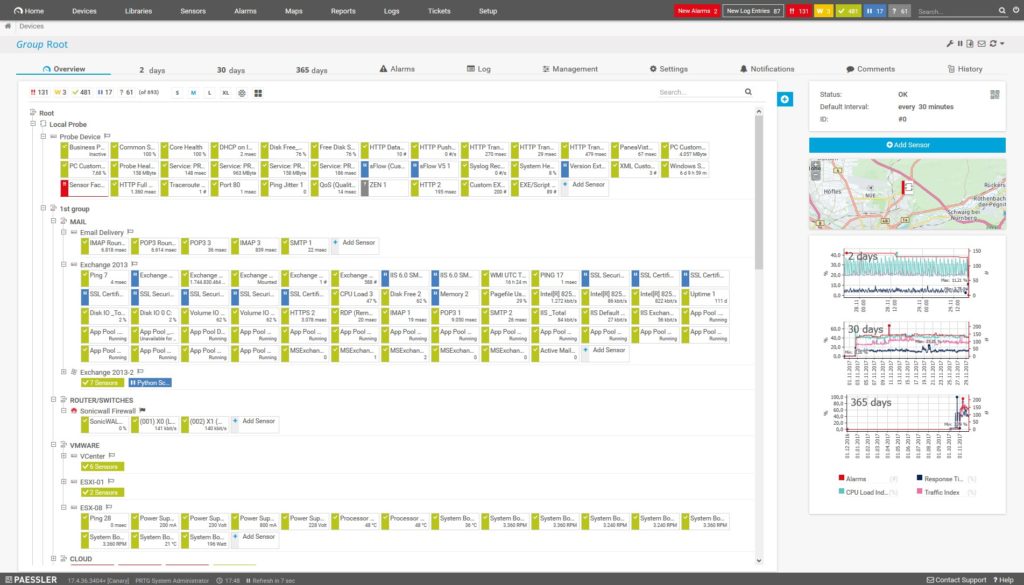
PRTG Network Monitor, by Paessler, takes a sensor-based approach to monitoring. A PRTG sensor is a basic monitoring element, which might monitor, for example, the space available on a disk drive or the CPU load of a server. The benefit of this model is PRTG can function as a free uptime monitoring tool, provided you use fewer than 100 sensors. You can choose whichever sensors you want, which means PRTG can be entirely tailored to your specific needs.
Moreover, if you want to expand on your up down monitoring solution to create a more comprehensive, one-stop monitoring tool, PRTG Network Monitor allows you to do so. It serves as an all-in-one solution if you so choose, offering jFlow monitoring, firewall monitoring, IP monitoring, IP SLA monitoring, jitter monitoring, packet sniffing, and much more. In other words, it’s what you make of it.
Another advantage of PRTG Network Monitor is it has a customizable notification system, which can alert you via text, push notification, or email when anything goes wrong. You can set alert thresholds yourself, ensuring you don’t get an unnecessary flood of alerts but will be notified of any activity you consider to be critical.
You’ll need approximately five to ten sensors for each device, or one sensor for every switch port, meaning PRTG Network Monitor can become costly quickly. Moreover, the licenses set a limit for the number of sensors you can use, and once this limit is exceeded, you’ll have to upgrade to a higher paid plan. The issue with this model is if you breach one plan’s sensor limit but don’t necessarily utilize the full sensor provision of the higher plan, you may end up paying for more than you need. For this reason, PRTG is not always cost-effective.
A 30-day free trial of PRTG Network Monitor is available. The trial version is completely unlimited and reverts to the free edition of PRTG at the end of the 30 days, so you won’t have to worry about a surprise bill.
4. Site24x7 Website Monitor
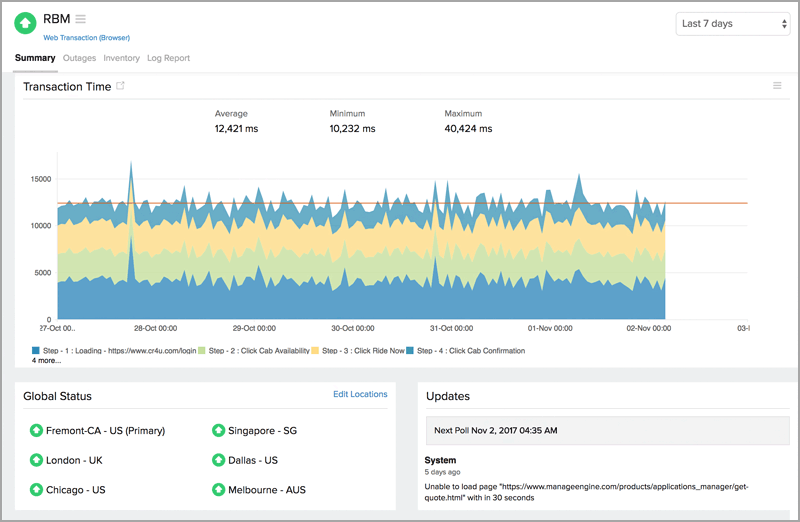
Site24x7, a well-known name among IT administrators, has an agentless website monitoring tool available designed to allow you to monitor URLs across the intranet, internet, and 3G/4G networks. It also lets you perform synthetic web monitoring from a range of ISP networks, ensuring your website users are uninterrupted and maximum uptime is achieved.
This program is suitable for monitoring the uptime and performance of IPv4/IPv6 enabled websites from more than 90 locations across the globe. Monitoring capabilities are advanced, covering domain expiry, SSL/TLS certificates, and website defacement. You can even receive notifications directly to your mobile phone when a problem is identified.
Site24x7 gives you insight into website response time, including DNS time, time to first byte, connection time, SSL handshake time, download time, and much more. You can analyze how your website responds when it’s accessed from different global locations, and accumulate detailed data pertaining to everything from the SSL/TLS protocol version being used to cipher suite details.
The tool’s user interface is another noteworthy benefit. The layout makes data interpretation easy, as it’s both dynamic and uncluttered, with graphical representations of data in the form of line charts, scatter graphs, and geographical maps. Still, I find Site24x7 could be more user-friendly and its range of functionality expanded upon. You can sign up for a 30-day free trial here.
5. Server Density
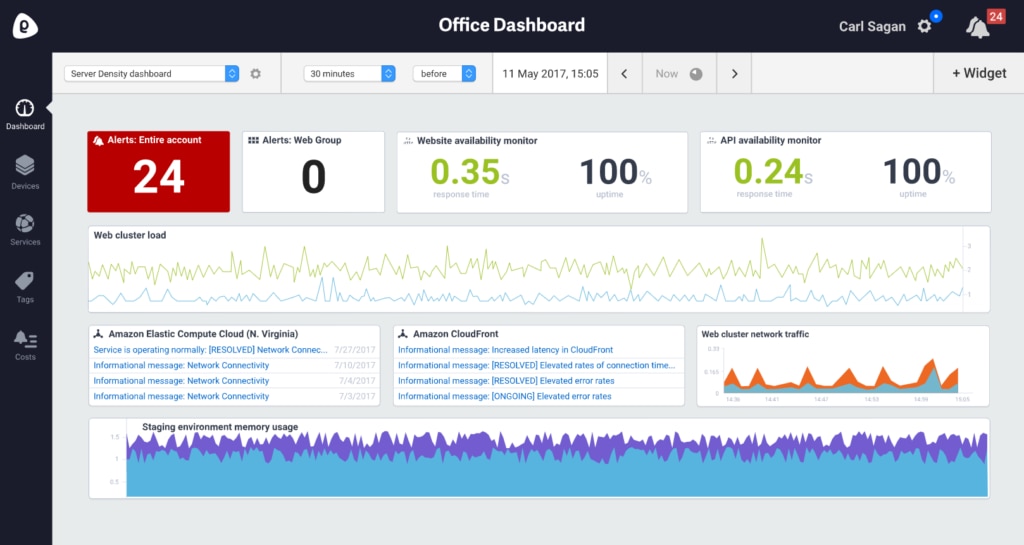
Server Density offers cross-platform monitoring for Windows, Linux, Docker, FreeBSD, Mac, and Kubernetes. Its powerful API conducts automatic agent installation, and the program can be integrated with over 100 systems and services. This includes MySQL, MongoDB, Varnish Cache, Redis, Elasticsearch, Apache, PostgreSQL, RabbitMQ, Couchbase, and much more.
The best thing about this program is its user interface, which makes uptime monitoring surprisingly engaging. The design highlights and draws attention to the most critical metrics, like website availability and the number of activated alerts, so they can’t be overlooked. Another benefit is Server Density is part of StackPath, a web services platform for speed, scale, and security. This means using Server Density affords you the opportunity to expand your up down monitoring solution into a wider IT monitoring and management strategy, through a single unified platform.
Though the dashboard is super dynamic and facilitates at-a-glance visibility of your systems, learning to navigate it and take full advantage of its features can take time. A 14-day free trial is available, with no credit card details required.
6. ManageEngine OpManager
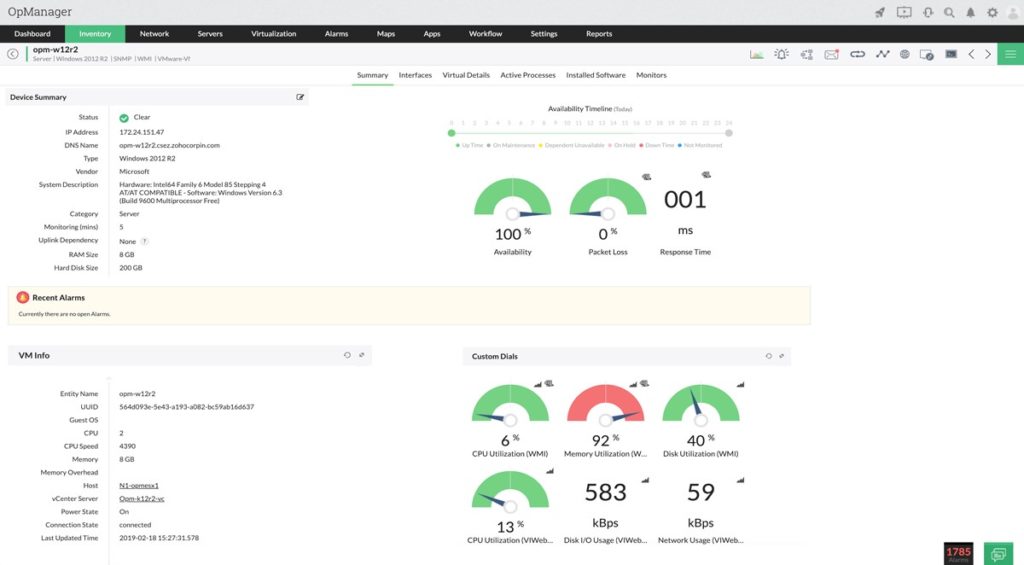
ManageEngine OpManager is another all-in-one monitoring solution for IT administrators. It offers real-time network monitoring with more than 2,000 built-in network performance monitors covering latency, errors and discards, speed, packet loss, and more. It also includes physical and virtual server monitoring, covering CPU, memory, and disk utilization on Linux and Windows servers, and VMware, Xen, Hyper-V, and Nutanix server virtualization platforms. In addition, it provides WAN link monitoring capabilities allowing you to view hop-by-hop performance, to facilitate rapid root cause identification.
OpManager gives users a comprehensive SNMP monitoring experience designed to use automatic network discovery to keep itself up to date. It can discover up to 15,000 interfaces per minute, which is indicative of a seriously powerful program.
OpManager employs multi-level thresholds, giving you the opportunity to narrow down and specify your alerts, which will notify you instantly if a violation occurs. I’m also a big fan of the customizable dashboards, which let you choose between and organize more than 200 performance widgets. My only real issue with OpManager is navigating it and locating the various utilities can be complicated and time-consuming. You can schedule a demo if you want to know more.
7. Nagios XI
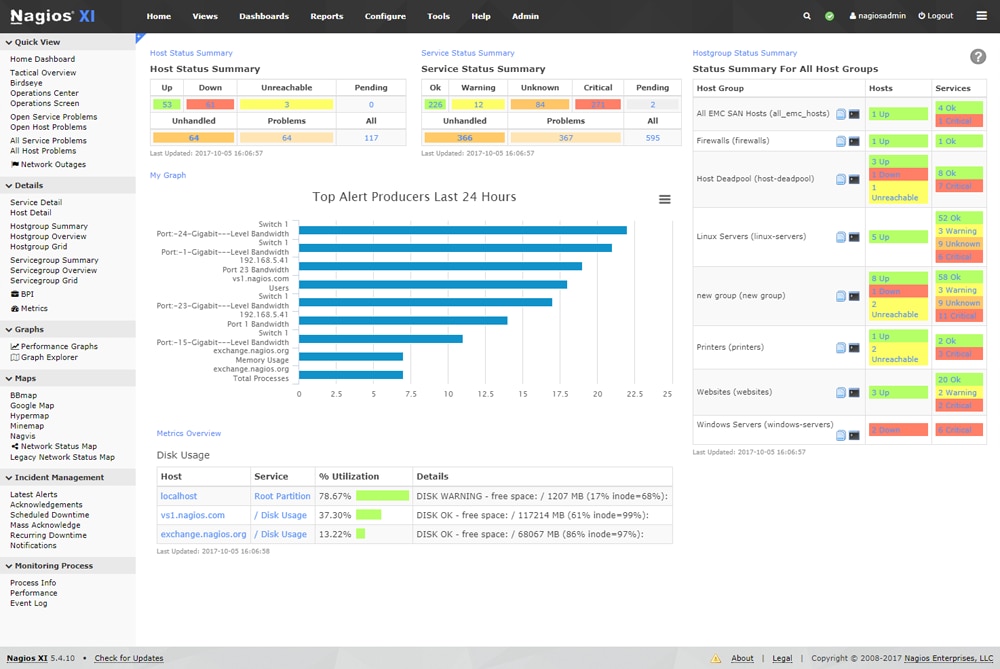
Built on the open source components of Nagios Core, Nagios XI is an uptime monitor available for Windows, VMware Workstation/vSphere/ESX, CentOS, RHEL, Ubuntu, and Debian Linux. This tool not only assists you with reducing downtime, but also detects network incidents and monitors the overall health of your whole network. Nagios XI monitors all mission-critical infrastructure components, including operating systems, applications, services, system metrics, network infrastructure, and network protocols. There are hundreds of third-party add-ons available, meaning you can monitor almost all in-house services, systems, and applications. This flexibility is the greatest advantage of Nagios XI.
Layout, design, and preferences are customizable on a per-user basis, offering team members maximum flexibility. The program also offers multi-tenant capabilities, so the web interface can be accessed by stakeholders. Views are user-specific, meaning clients only see infrastructure components for which they’re authorized.
To help you get set up, Nagios XI offers both a remote assist and a quick-start module, which can save you much time. While this assistance is appreciated, its requirement makes Nagios XI less user-friendly than some other programs. This may put some users off; however, keep in mind lots of support is available and the tool itself is sophisticated.
The free version of Nagios, Nagios Core, is a popular choice among IT administrators who prefer open source programs. The major benefits of open source tools are the lack of vendor lock-in, the lower software costs, and the abundant support available. Still, generally speaking, open source programs aren’t as suited to enterprise-level requirements as closed source programs.
8. Zabbix
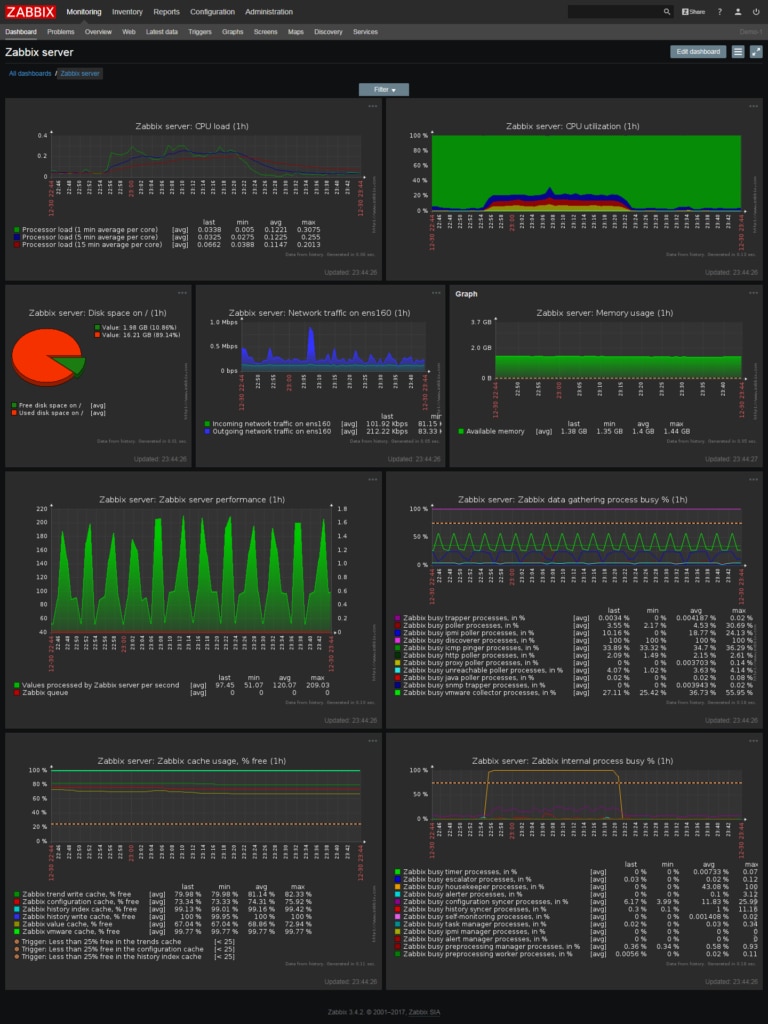
Zabbix is free uptime monitoring software, open source and designed to monitor everything including network, cloud, applications, and servers. It has specific solutions for various industries, covering education, marketing, IT and telecommunications, retail, and more. With Zabbix, you’re able to view when a service is in a critical state and when it’s down. The tool’s performance monitoring capability is one of its most notable advantages—you’re able to monitor disk space, fan status, device temperature, and even power supply. This gives you insights into your device to help you prevent it from failing.
As an all-in-one solution, Zabbix is also capable of monitoring your network traffic, ensuring your connection remains fast and available to every device on your network. To keep up to date, Zabbix conducts regular network discovery scans, adding new devices when appropriate. Whenever a new device is found, a discovery event is generated. According to your settings, the program will then either send you a notification, execute a remote script, or add or remove the host.
Zabbix is among the best free monitoring tools. The issue, again, is open source programs are not as reliable, in an enterprise environment, as closed source solutions.
Getting Started with a Server Uptime Tool
Overall, SolarWinds ipMonitor beats the competition by combining ease of use and beginner-friendliness with some seriously advanced features. SolarWinds is dependable and well supported, with a community of loyal users accessible via the THWACK interface, and technical support operatives on hand 24/7. With an impressive and reliable alerts system, a wide range of monitors, and a monitor-based pricing model, ipMonitor is cost-effective and comprehensive, providing a scalable and reliable enterprise-grade solution.