
When managing a large enterprise network, having a clear overview of your entire network infrastructure and connections is critical for both troubleshooting and performance. One crucial piece of the puzzle is using a network graphing tool, or network topology tool. Network graphs show you your network’s physical and logical connections and allow you to have a visual representation of how your network is operating and where data is flowing.
Without a network map, troubleshooting can be slow and it can be hard to pinpoint exactly where an issue has occurred. The best way to produce these graphs is to use a network graphing tool, such as SolarWinds® Network Topology Mapper (NTM). These tools automatically scan your network for all devices and links and establish a visual graph for you to use in your network monitoring and maintenance.
What Are Network Graphs?
Network graphs are also known as network diagrams, and they show connections between entities (devices) on the network, known as nodes. Connections between nodes are known as links or may also be called “edges.” The entire picture a network graph builds is also known as a network topology. This overview is extremely useful when both setting up a network and determining how to best fix a problem when an issue occurs.
There are a few different ways in which you can organize a network, most of which fit into the following categories:
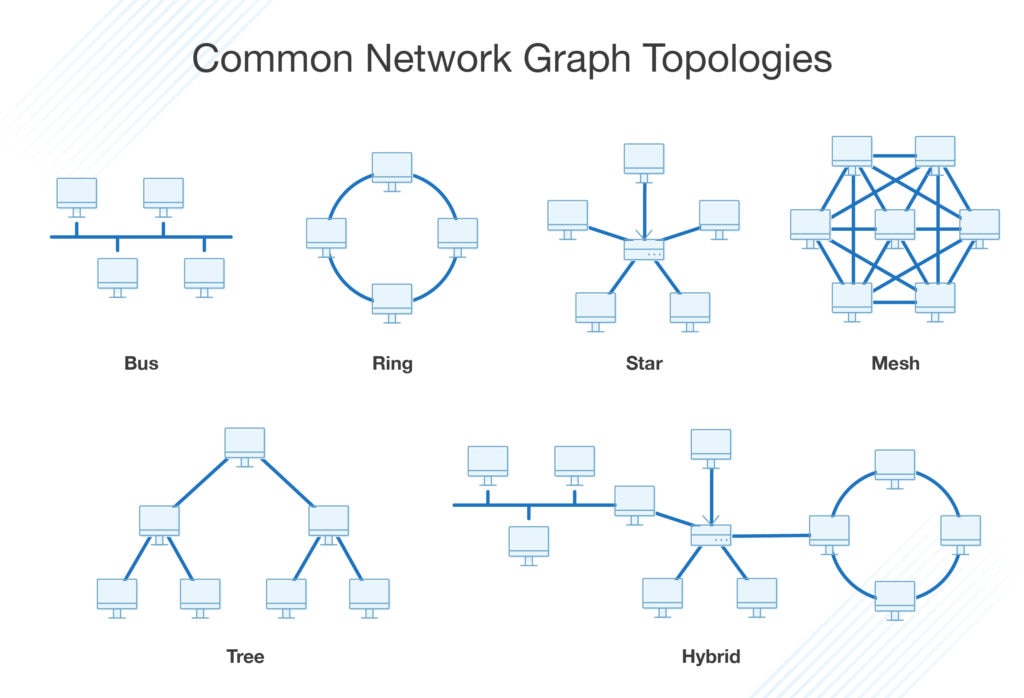
- Bus: A bus network topology is a string of nodes in a line, along one cable with two endpoints. Data can be transmitted along the bus in only one direction. The benefits of this approach are it’s easy to set up, and cost-effective, particularly in small networks. The major disadvantage is if one point along the cable fails, the whole network goes down. In addition, if traffic through the network is heavy, this kind of topology can quickly show performance problems.
- Ring: Another common network topology is the ring arrangement. A ring topology is where nodes are arranged in a ring or circle type arrangement, with each device connected to another, and the last one connected to the first. A ring topology can transmit data in either one direction or both directions. The advantage of this kind of topology is it’s easy to set up and expand and is easy to transmit data without performance slowdowns. Like a bus topology, ring topologies face the disadvantage of having the entire network disrupted if one node goes down.
- Star: A star topology has a single hub in the center, with nodes coming off like spokes on a wheel, or points on a star. Each node has a separate connection to the hub, and if there are few nodes then the network can perform quickly. These kinds of networks are also easy to modify, as each node is separate from the others. The downside is they can be expensive, and if the hub fails the entire network goes down.
- Mesh: Mesh topologies are a little more complex, as every node is connected to every other node. They use two methods to transmit data, called flooding and routing. Flooding means data is transmitted to every node on the network, which prevents data loss but increases load. Routing transmits data only from specific nodes to the ones intended to receive it, which puts less load on the network, and requires routing logic, so the network knows how to handle broken nodes or connections. Mesh networks are more complex to set up but are robust.
- Tree: A tree topology is set up with a hierarchy of nodes, with one root node and others extending from it like branches from a tree. Essentially, it’s a combination of bus and star topologies, making it easy to set up, maintain, and expand. The main risk is if the central root node fails everything else fails with it, and it requires a lot of cabling to set up.
- Hybrid: A hybrid topology is self-explanatory: combinations of the above topologies form a hybrid approach.
Your network topology matters for several reasons. If your network isn’t organized efficiently or correctly, you may end up with poor network performance or constant problems. Depending on how your company operates and what kind of services you offer, you may want to choose different network topology arrangements. In addition, when you have your network organized in the right way, this can help you effectively allocate resources where they’re needed most. This allows your network to run smoothly, with fewer errors and faster resource flow, which ultimately saves your organization money and time.
Each of these network topologies offers different benefits and disadvantages. In any case, no matter which network structure you’re operating with, you need to have a clear map or network graph of what it all looks like. These network graphs show a visual representation of the physical layout of your network, and what is called the “logical” layout of your network.
Physical layout is clear: the actual wires and cables and devices connecting your network. This is important to monitor, so people involved in maintenance and resource provisioning know where physical resources are needed and how they’re connected. Logical network topology is the idea of how your network is connected, showing which nodes are connected and how data is flowing through them and the network. In addition to physical resources, a logical network graph shows virtual machines and cloud connections.
Top Network Graphing Tools
One of the best ways to graph your network accurately is to use a dedicated network graphing tool. While you can perform the network graphing process manually, it has a large upfront time cost to find all the devices and ensure everything is correct. Even then, if your network is growing or changing quickly, you may find it hard to keep your network graph accurate. In addition, static (drawn) network diagrams may show you a clear representation of your network, but they don’t include information about the status and performance of the devices you have on the network. If you don’t have time to dedicate to keeping your network graph accurate, using an automatic or partly-automated tool may be a better option. These kinds of tools also usually include device information and further details to help you with troubleshooting and change detection.
If you’re in a large enterprise, trying to perform the process manually isn’t recommended. There are several different tools on the market, but I’ll go through a few of the top ones, so you have an idea of what’s available.
SolarWinds Network Topology Mapper
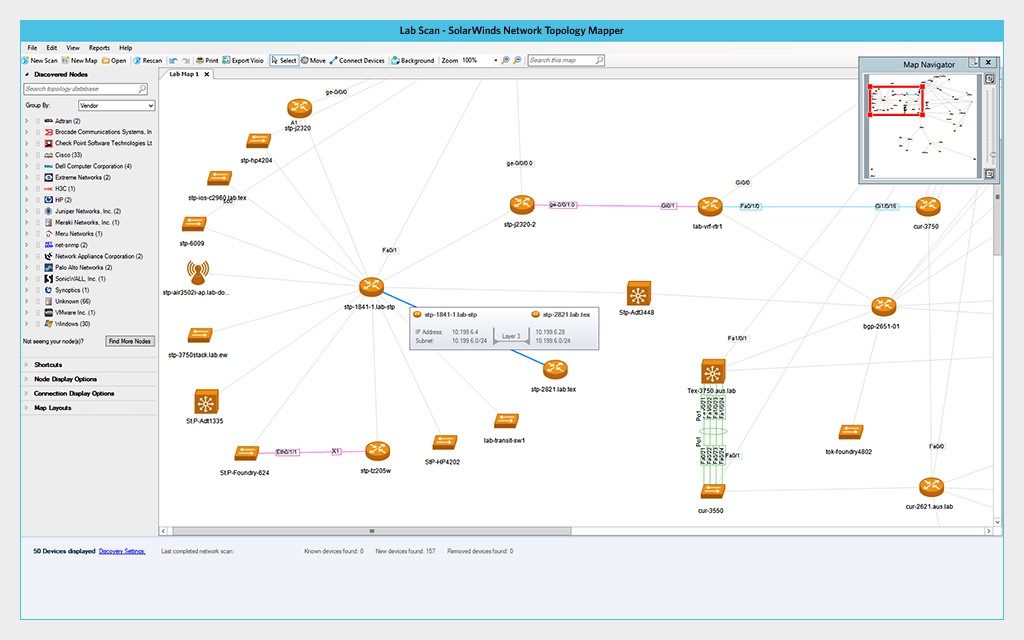
My top choice in tools is SolarWinds Network Topology Mapper (NTM), which allows you to automatically discover and monitor your network topology. NTM performs a scan and then creates a network graph, so you can view the comprehensive network diagram and details for each node. Each of the map objects (such as nodes or hubs) can be interacted with and viewed, and you can also edit the details of each of these objects to customize your map.
In addition, NTM automatically detects changes to your network topology, which means it’s easier to always have up-to-date network graphs and information. Another great benefit of NTM is you can use it for network inventory management, by using the scanning and mapping function to keep track of what your network looks like and what devices you have connected. A free trial of NTM is available here for 14 days.
SmartDraw
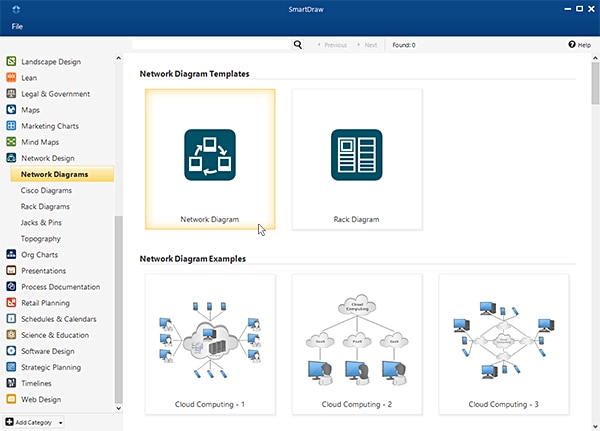
Another good option is SmartDraw. This is a network mapping drawing tool, using templates and pre-selected network design symbols to automatically generate a network map of your topology. SmartDraw can create network graphs of your LAN/WAN Design, Peer-to-Peer (P2P) networks, topologies, cabling, and motherboards. SmartDraw also allows you to share your maps with other collaborators, using Dropbox, Google Drive, and so on.
Help Systems Intermapper
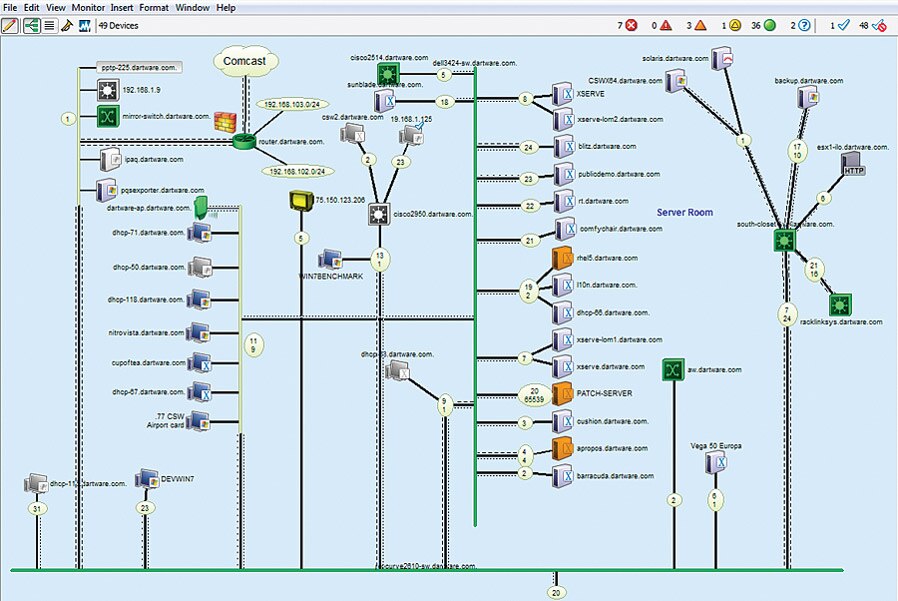
Intermapper, by Help Systems, is also a useful tool to check out. Intermapper is more generalized network monitoring software allowing you to create a network map. Like SolarWinds NTM, it includes information on your nodes and network details, so you have live information on how your network is performing. With color-coded statuses, you can see which nodes and connections are up, and which ones are down. It also includes good customization for map layout and icon choices.
Visual Paradigms Online Diagrams
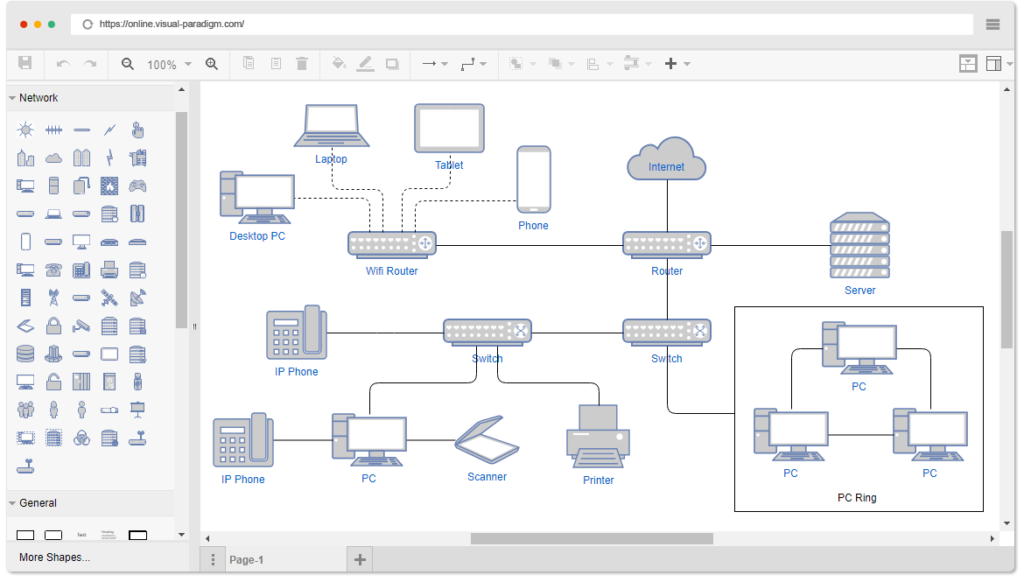
This one is a free tool potentially suitable if you’re looking for something without a higher price tag, bumt only if you’re willing to put in a bit more effort to make the maps yourself. This is a well-made tool offering support and integration with other diagram tools, including UML, Org Chart, Floor Plan, and ERD. One of the benefits of Online Diagrams is you can use it for more than network graphs, and it also includes diagram types for software development, strategy planning, business improvements, project management, network engineering, and IT architecture design.
Network Graphing Takeaways
Network graphs are a critical part of network maintenance, monitoring, and performance management. Whatever topology your network is arranged in, you need a tool designed to help you visualize and better manage your network. When choosing a network graphing tool, make sure you select one that works well for your organization. Many free tools are available but may not have the power and documentation to help you to map and organize a large and complex corporate network. Premium tools such as SolarWinds Network Topology Mapper are your best bet in an enterprise setting, and many offer free trials so you can try them out and make sure they work well in your company.