

Adopting effective Microsoft SQL Server monitoring tools is an essential part of maintaining the long-term health of not only your database, but also your larger network. Monitoring server performance and activity can have a direct impact on minimizing downtime and cost-efficiency — not least because addressing a server failure can involve a hefty price tag.
I have tried a range of SQL server database performance monitoring tools, both paid and free, and compiled my top picks to suit a range of organizational budgets and needs. Leading the pack are two products from the industry-leading company SolarWinds® Database Performance Analyzer ranks the highest, followed closely by Server & Application Monitor.
However, before getting into product reviews, I share the must-know basics of SQL Server to help you gain a baseline understanding. This will help you better realize the role SQL monitoring tools can play when it comes to streamlining and making SQL monitoring easier for you.
The Evolution of Database Management
Database Management through SQL Server
Best SQL Server Monitoring Tools
How to Choose the Best SQL Server Monitor
What Is SQL Server?
An understanding of SQL Server starts with the Database Management System (DBMS). In simple terms, a DBMS is a collection of programs allowing users to organize, access, and manipulate data. A DBMS is typically used by IT professionals at the corporate level but is useful in any circumstances requiring the management of a large store of interconnected data.
The Evolution of Database Management
The early DBMS technologies were hierarchical, which means they utilized a model organizing data according to a tree-like structure. In other words, data was stored as records connected by links—or, to stay true to the analogy, branches.
The hierarchical DBMS has now largely been replaced by the Relationship Database Management System (RDBMS), which focuses on the relationship between data, adopting a more interconnected, networked approach.
Essentially, an RDBMS stores data in a structured format, using rows and columns, which makes locating and accessing specific values easier. This is called a relational approach, because the values in each table are related to each other, and tables themselves may also be related to other tables. The benefit of this structure is it makes it possible for system administrators to run queries across multiple tables simultaneously.
Database Management through SQL Server
Microsoft SQL Server is a RDBMS supporting a range of transaction processing, business intelligence, and analytics applications. It’s built on SQL, short for Structured Query Language, the standardized programming language used by IT professionals to manage and query their databases.
As a RDBMS technology, SQL Server uses the row- and column-based structure, which connects related data elements between tables. This means you don’t have to store data in multiple locations within a database. Moreover, this relational approach to database management contributes to the maintenance of data accuracy by imposing integrity constraints to safeguard the reliable processing of data.

Best SQL Server Monitoring Tools
SQL server performance analysis tools help users stay on top of any server performance issues, so they can be managed before they erupt into a costly system failure. But these tools can vary enormously. Knowing what features to prioritize and being able to balance your needs against complexity and usability is important.
This SQL server monitoring tools review will break down the current software on the market, giving you an overview of how they compare to others, their merits and disadvantages, and whether they’re suitable to your needs. While the best offerings are paid, I have included a few high-quality free SQL monitoring tools for those seeking a targeted, lightweight solution. As has come to be expected in a roundup of IT management software, several the tools on this list are from SolarWinds.
Database Performance Analyzer (DPA) is a formidable and nuanced tool, with an impressive array of features. It offers an intuitive and user-friendly SQL monitoring experience which is active 24/7. Users benefit from second-by-second monitoring capacities, a clean, uncluttered dashboard, and an alert system to keep you informed of critical changes while keeping notifications to a minimum.
SolarWinds prides itself on being geek-built, innovative, and intelligent, and with DPA they’ve hit the nail on the head. This SQL monitoring software offers complex utilities, without sacrificing on simplicity of use and accessibility for those who aren’t code-fluent software experts.
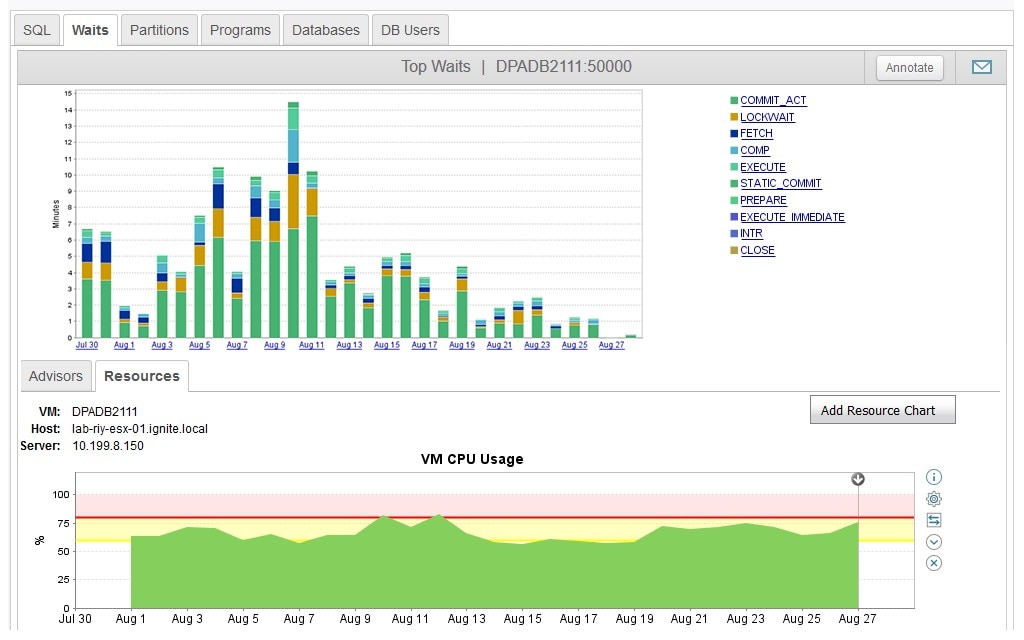
For me, one of the most obvious advantages of SolarWinds DPA is its “Response Time Analysis” approach to solving bottlenecks. SolarWinds is the pioneer of Response Time Analysis, which focuses on monitoring and analyzing the time between a query request and a query response; this is then broken down into what are called “waits.” These waits are monitored for their impact on database performance. As a methodology, Response Time Analysis influences every other aspect of SolarWinds DPA, informing both the interactive dashboard and the graphs.
The dashboard is another notable benefit. Unlike data-oriented software with a cluttered user dashboard, SolarWinds DPA provides a versatile visual representation of data, with options to view data both as an overview and in greater detail. For example, when viewing data in a bar graph, hovering over a bar gives you a more detailed view of the query in question. The ability to view data in its simplest form before delving deeper makes data interpretation quick and intuitive.Key Features
SolarWinds DPA is packed with too many noteworthy features to consider them all in depth here, so I’ve outlined a few of my other favorites:
- Developer, Database Administrator, and Operations Alignment: The web-based interface lets teams collaborate, so they’re always on the same page
- Integration with SolarWinds Orion® Platform: Integration with the Orion Platform means you can combine DPA with SolarWinds Server & Application Monitor (reviewed below) to view other relevant database information, including metrics for nodes and applications
- Intelligent Anomaly Detection: DPA is self-evolving. It’ll learn from your instance wait behavior profile, and automatically fine-tune its alert parameters accordingly
This list is by no means exhaustive. For a better idea of what DPA can do, I recommend checking out the 14-day free trial.
When it came to ranking the best tool, choosing between SolarWinds Database Performance Analyzer and SolarWinds Server & Application Monitor (SAM) wasn’t easy. They’re evenly matched in terms of their merits, but there are key differences between them when it comes to perspective and focus.
SAM vs. DPA
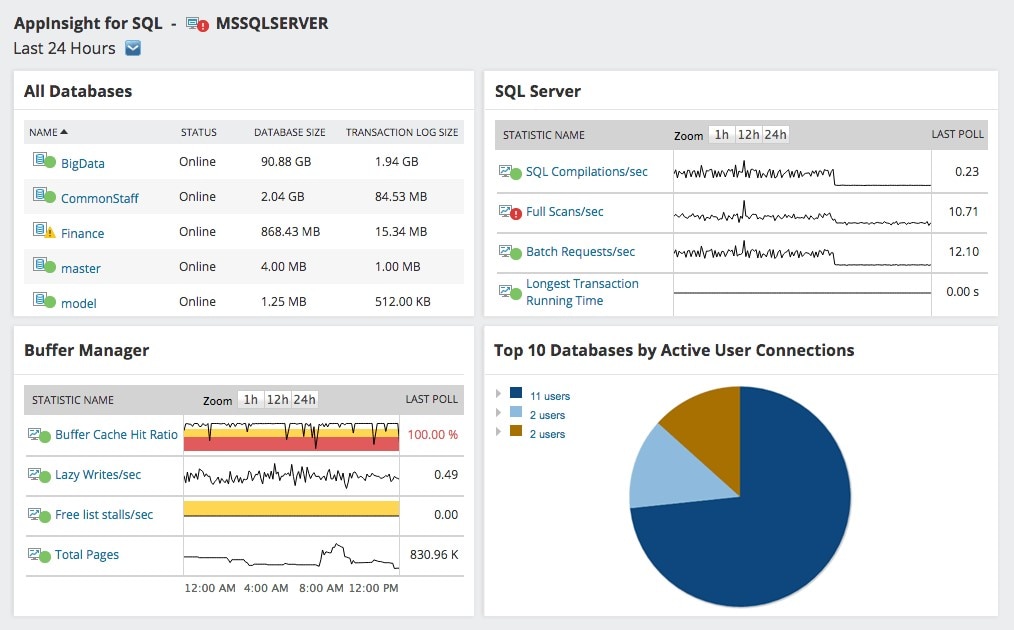
Looking at their function as SQL server monitoring tools, SAM is much more health oriented, while DPA focuses on query performance and the end user’s experience. SAM helps you understand the strain being faced by your database, and DPA helps you identify the source of the strain.
SAM will give you a broad overview of your database’s health, showing you how much of your system resources are being consumed. DPA, on the other hand, pinpoints how those resources are being used at the level of individual queries serviced, which is helpful in understanding how the end user is impacted in terms of wait times.
In short, SAM and DPA are two sides of the same coin—different, but fundamentally connected.
Key Features
Let’s dig into the things I like most about SAM as an SQL performance monitor.
- Log Monitoring: Monitor the size of log files and data, so you’re aware when storage capacity is close to full
- Dedicated Dashboard: SAM provides a single dashboard for viewing SQL server performance monitoring metrics
- Comprehensive Management: More than an SQL server monitoring tool, SAM is capable of monitoring asset inventory, virtualization, applications, operating systems, and hardware
- Automated Discovery and Agentless Monitoring: SAM undertakes automated discovery of SQL servers and databases, as well as agentless monitoring of SQL servers and databases
The simple reason SAM comes second to DPA on this list is because DPA is more specialized and, in that sense, more sophisticated. It correlates resource utilization to query performance, which helps to decrease the likelihood of facing costly hardware upgrades. It does this by offering alternatives, like indexing, and by showing you which data files need high performance and which don’t. By assisting you in tuning application queries, DPA has the potential to result in greater performance gains.
That being said, SAM also serves as an excellent SQL monitoring tool. Depending on the complexity of your needs, you might find it’s better suited to your organization. You can give both tools a try to see which is best. Like DPA, SAM offers a fully functional free trial.
With SQL Sentry, you can more quickly identify long-running and high-impact SQL Server queries to resolve query performance problems faster. DBAs can more easily gain visibility across their entire data estate using the integrated quick view of real-time and historical events and performance data. Additionally, SQL Sentry can show execution plan diagrams, query history, and more to help you find and fix potentially problematic queries faster.
Key Features
SQL Sentry includes several SQL monitoring and optimization features that can help you:
- Pinpoint suspect statements running thousands of times within a short period
- Detect top resource-consuming queries over time, with the ability to begin optimizing queries within the same interface
- Stay on top of when new release or data churn over time affects query performance
You can try SQL Sentry free for 14 days by downloading a free trial.
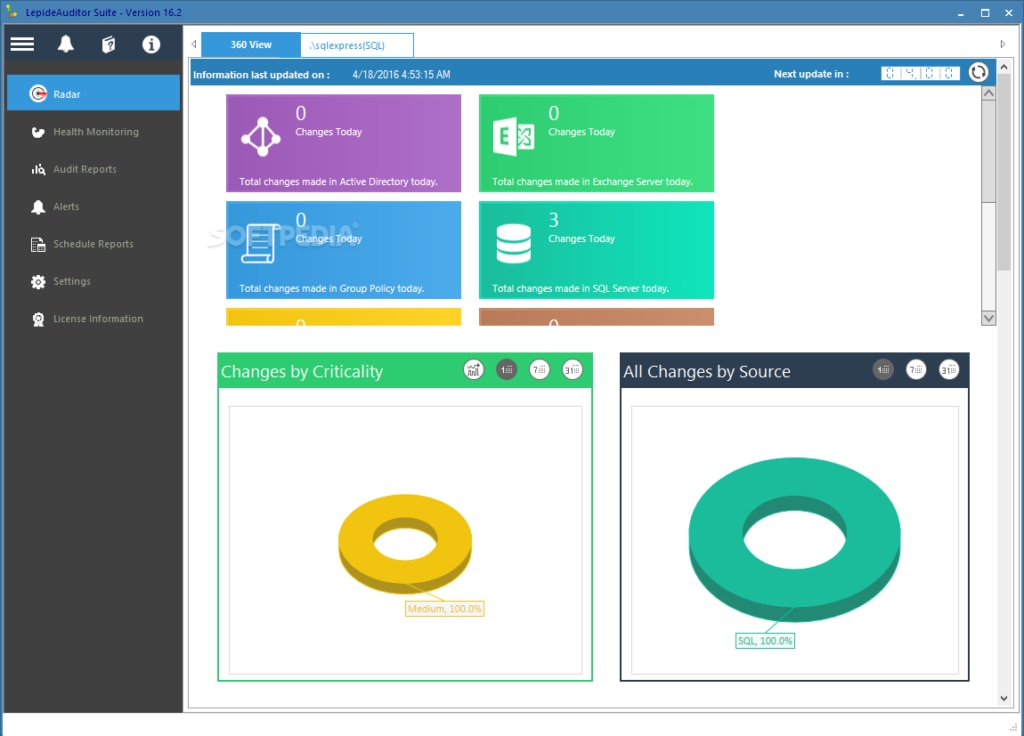
Part of the LepideAuditor suite, this SQL monitoring tool focuses on auditing SQL server performance, uptime, and activity. LepideAuditor for SQL Server is all about monitoring changes to SQL server. As such, it’s a simple but nonetheless feature-heavy tool.
It’s simple, in part, because of its automated alert system, which can be configured to be threshold-based or real-time, delivering in-depth reports on the current state of your server. It’s feature-heavy because it lets you monitor what, when, where changes are made to your SQL server, and by whom. On top of this detailed monitoring capacity, it also monitors the general health of your SQL servers.
I appreciate Lepide focusing on changes, its comprehensive auditing functions are impressive. It has the capacity to track seemingly every SQL instance, including changes to the configuration of SQL users, triggers, databases, permissions, and logins, keeping you in the loop without overloading you with information. This is thanks to its clever alert system, which lets you customize exactly when you want to be notified, and when you don’t.
Key Features
As an SQL performance monitor, LepideAuditor allows you to:
- View data on usage, connections, error rates, and CPU usage
- Choose to receive alerts either as emails, as push notifications via the LepideAuditor App, or as console updates
- Monitor the health of connected SQL servers
- Generate detailed reports to show the most active users and databases, tables, logins, and changes to objects
- Create your own reports based on customizable parameters
- Utilize a mobile app, which includes access to a live feed
While I like the tool’s change-centric approach, it doesn’t offer the level of detail and interactivity I was looking for. It could benefit from something similar to the interactive graphical representation of data provided by SolarWinds DPA, which allows users to open a more detailed outline of a specific query, taking them directly to the root cause of an issue.
LepideAuditor is compatible with Windows 7, 8, 8.1, and 10, and Windows Server 2008, 2008 R2, 2012, 2012 R2, and 2016. Lepide offers a 15-day free trial of this software.
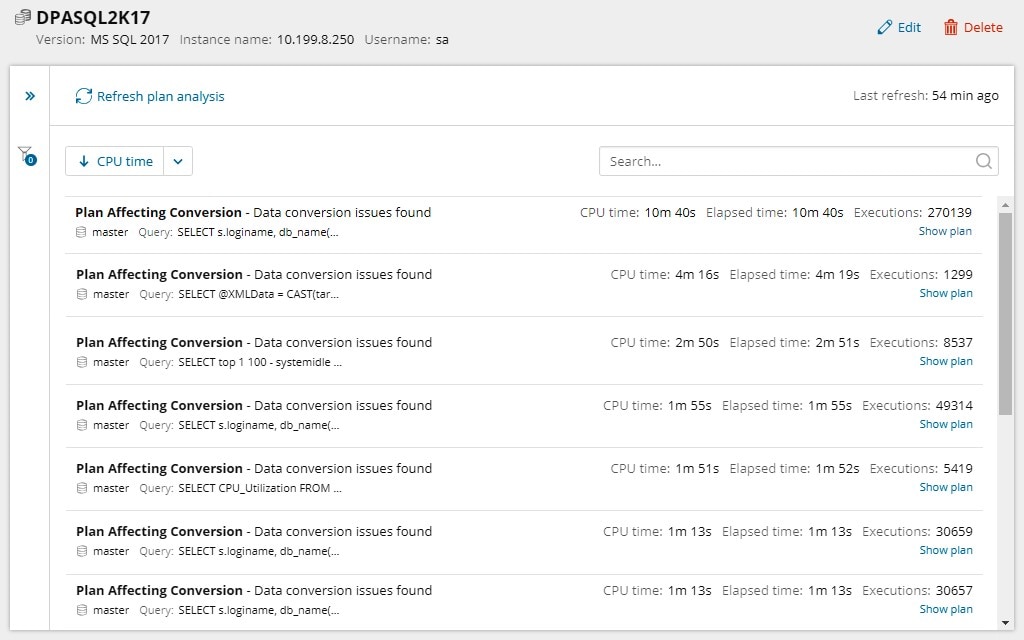
Although free SQL monitoring tools cannot compete with paid SQL monitoring tools overall, I was impressed enough with SolarWinds SQL Plan Warnings to rank it here. Its functionality is highly impressive, given it’s entirely free.
What I like most about SQL Plan Warnings is it provides visibility into SQL query plan warnings you may not even know exist. And it does so in a quick, non-intrusive way. This is because the tool requires zero installation. You can be up and running in under two minutes, gaining near instant visibility of any queries with warnings attached to them.
On top of this, the tool provides you with actionable guidance, which can help you execute an informed and appropriate fix.
Key Features
- Filters results by keywords or type of warning
- Allows users to investigate plan warnings or query text with a single click
- Offers a unique view of plan warnings which could otherwise be easily overlooked
- Organizes warnings according to elapsed time, execution, or CPU time
At zero cost, it’s remarkable how much potential SolarWinds SQL Plan Warnings has for improving query performance. The fact that you can download and run it, without having to install, makes it in my opinion a must-have tool.
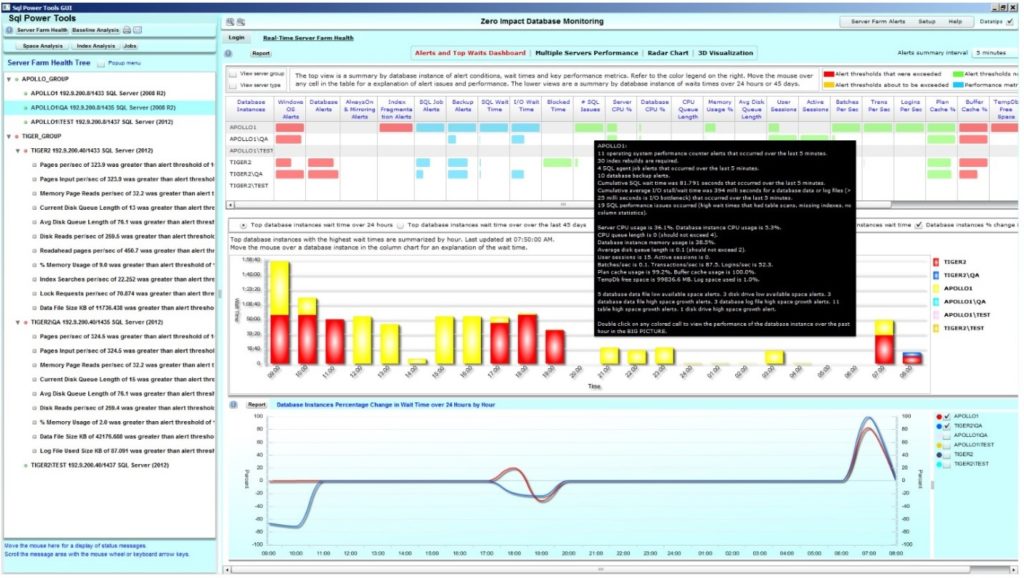
At face value, SQL Power Tools might seem like it lacks the sophistication of some of the other tools mentioned in this guide. But this can be attributed to the developer’s intention to make one of the most lightweight SQL server monitoring tools on the market. Indeed, SQL Power Tools is simple, economical, and well suited to those who value lightweight functionality. This is an agentless SQL monitoring tool with a key selling point: it minimizes impact on your server resources as much as possible by utilizing packet sniffing to monitor server performance.
Another feature distinguishing SQL Power Tools from many others on the market is its combination of SQL server monitoring and focus on cybersecurity. This software was designed using Advanced SQL Behavioral Analysis and User Entity Behavior Analytics, design features to recognize breaches and intercede, stopping them in their tracks. This makes this SQL server monitoring tool particularly appropriate for users looking to combine their cybersecurity and SQL monitoring efforts.
Key Features
- Compatible with Oracle, SQL Server, Informix, and Sybase
Combines cybersecurity features with SQL monitoring capabilities - Accesses data including destination IP and source IP, application, response time, start and end time, rows returned, bytes sent, and packets sent
- Informs users of long-running SQL within milliseconds of its occurrence
- Uses zero intrusive SQL profilers or traces
- Provides a dashboard view of server performance
Overall, I was impressed by SQL Power Tools. While it doesn’t offer the same range of utilities as some of the higher-ranking tools in this guide, its combination of lightweight SQL server monitoring and cybersecurity features is attractive. If you’re interested in testing it out, you can access a free trial by submitting a product evaluation request.
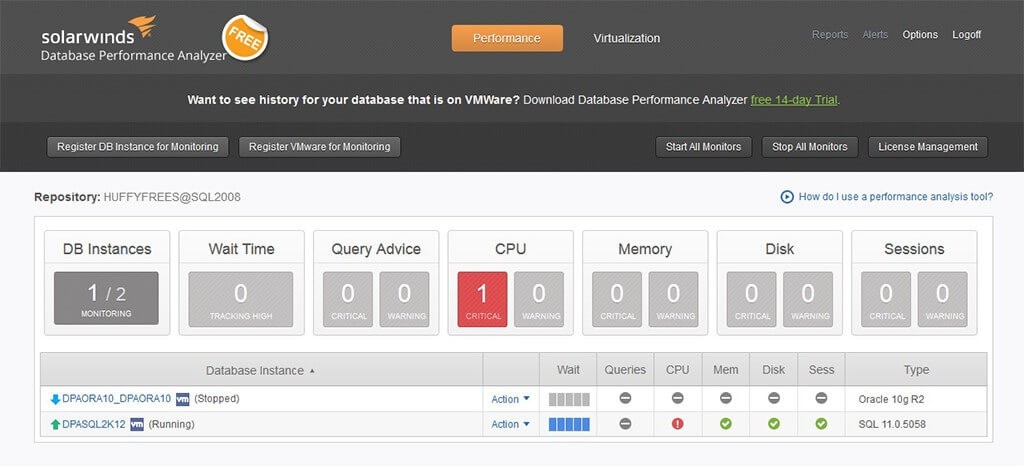
This is another free SQL monitoring tool I couldn’t leave out of this list. For monitoring server performance and activity, the free version of SolarWinds Database Performance Analyzer is a key part of a database administrator’s toolset. Though it doesn’t have the same range of functions as its more evolved counterpart, the paid version of DPA, it does share some core features.
Key Features
Like the paid DPA, Database Performance Analyzer Free includes the following key features:
- No agents, plus unlimited users
- No installation required on production servers
- Response time monitoring, including SQL query wait types and wait events
- Unified dashboard view of SAP ASE, Oracle, DB2, and SQL Server instances
As a free product, this offering is quite generous. The response time monitoring feature is founded on SolarWinds Response Time Analysis approach, which they’ve pioneered in the industry. It’s a highly sophisticated function to help users quickly and easily identify bottlenecks.
This tool does lack many of the utilities associated with the paid DPA. In my view, because it doesn’t offer a historical trend dashboard, charts, reporting, or alerting functionalities means it can’t compete with the paid version. Still, as a free tool, I certainly recommend it.
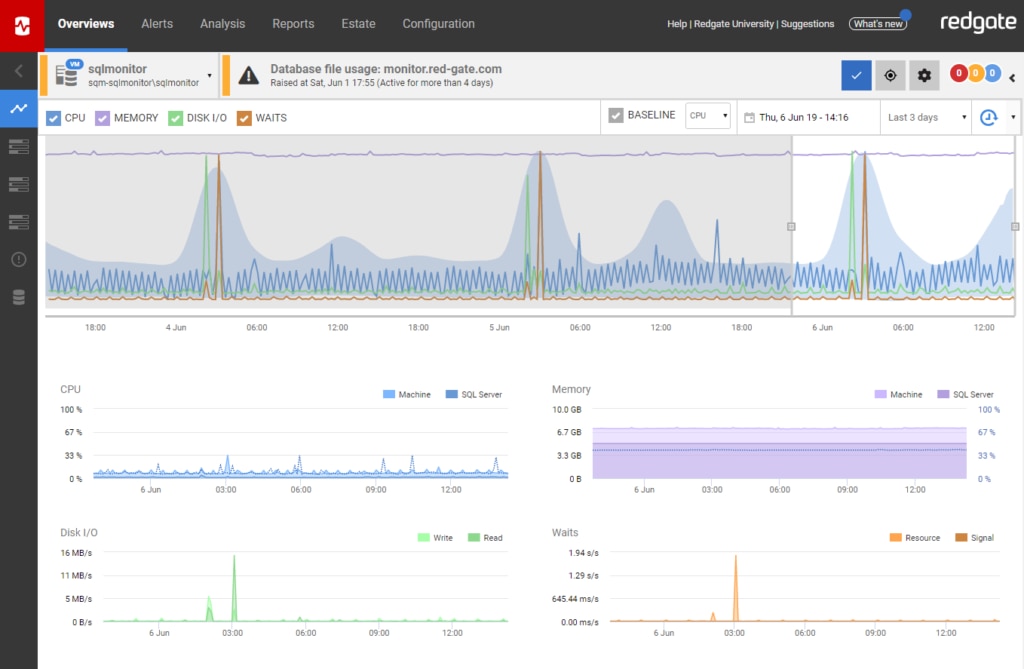
Redgate SQL Monitor is another powerful SQL performance monitor. There’s plenty to like about this tool, including intelligent alerting, a unified web-based interface, and an intuitive dashboard.
The alert system comes with 40 pre-configured, fully customizable alerts, and it’s highly flexible. It lets users set alerts according to server level, instance level, or database level. Another benefit of this product is its web-based interface, which means you can access the tool from anywhere. There’s also the dashboard, which lets you view a focused and relevant set of performance metrics, helping you drill down to the root of the issue as quickly as possible.
Key Features
Of all the features of Redgate SQL Monitor, the following are my favorites:
- Intelligent baselines to prioritize identifying root cause instead of symptoms
- Ability to expand on statistics in the dashboard, revealing CPU usage, wait times, and disk I/O
- Range of pre-configured alerts, including for high CPU or memory resource usage, performance issues related to queries, and hanging backups in SQL Server
Overall, it’s the intuitive dashboard which makes this product stand out for me. While its design is clever, it doesn’t offer any especially unique features specific to SQL server monitoring, and it lacks the complexity of the tools higher on this list. You can download a fully functional, 14-day free trial by requesting a link, which will be sent to your email address, from Redgate.
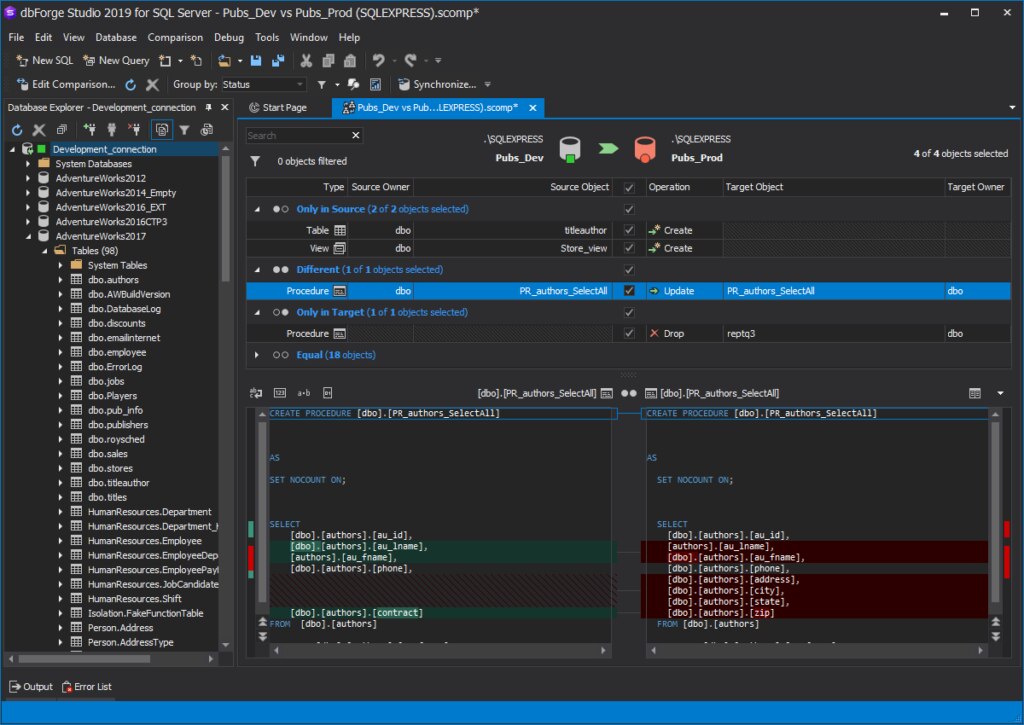
Devart dbForge Studio for SQL Server is a free Windows SQL monitoring tool with a contemporary, clean-cut approach to the SQL server monitoring experience. As an add-on for Microsoft SQL Server Management Studio, this program takes a tabular approach, dividing up the dashboard into tabs to offer a range of perspectives on the database as a whole.
Key Features
I appreciated the ability to break information down into separate tabs, because it made large amounts of data less overwhelming and easier to interpret and digest. The IO Data tab, the Wait Stats tab, and the Overview tab are particularly noteworthy.
- The IO Data tab lets you dig into individual database files, viewing total data reads and writes, input and output operation count, latency, and other useful information.
- The Overview tab breaks your data down into digestible aspects, a feature making this tool especially well-suited to those who appreciate simplicity. When time is of the essence, this tab is quite valuable, allowing you to view only the key metrics of your SQL server, such as CPU utilization, disc activity, and memory utilization.
- The Wait Stats tab highlights wait time and waiting tasks, which helps you to identify any resources which might negatively impacting your server performance.
While the tabs were what I liked most about dbForge Studio, it comes with some other interesting features, most notably the SQL query performance analyzer. With the analyzer, you can:
- Monitor resource-intensive queries, with the ability to view the query text and query profiling data, so it can be rewritten
- Detect the most expensive queries, performance bottlenecks, and waiting tasks
All in all, the clean and simple dashboard, with its tabular approach to the representation of data, is refreshing. As a free tool, however, its scope is limited. You can download it here.

How to Choose the Best SQL Server Monitor
When it comes to monitoring server performance and activity, the SolarWinds product line can’t be beat. In this guide, I featured four SolarWinds products, two of which are free.
Although the free products offer remarkable value and surprising functionality, they lack the range of utilities offered by the paid SQL monitoring solutions from SolarWinds. Both Database Performance Analyzer and Server & Application Monitor facilitate a versatile and comprehensive SQL server monitoring experience, which the free tools cannot provide unilaterally.
Though I decided to rank SolarWinds DPA most highly, with SolarWinds SAM following by a tiny margin, it’s ultimately not for me to say which of these tools is best suited to your needs. I recommend taking advantage of their free trials before making the decision for yourself. Rest assured both are extremely well placed for monitoring server performance and activity, with DPA’s focus on Response Time Analysis and SAM’s health-oriented view setting them apart from other tools on the market.