
As with all databases, you’ll need to constantly monitor IBM Db2 database to ensure optimal performance. Tuning your Db2 database will allow you to observe the speed of data transmission, measure query wait and response times, and identify root causes of critical performance issues. There are specific Db2 query performance tuning tips you should follow to make sure your Db2 database works reliably, consistently, and efficiently.
In this article, I’ll put forward some Db2 performance tuning tips to use on the Db2 mainframe. Follow these Db2 performance tuning steps for smooth, quick, and organized data movement and maintenance. I’ll also talk about one great option for a Db2 performance tuning tool, SolarWinds® Database Performance Analyzer (DPA). DPA is designed to analyze SQL statements, monitor Db2 growth and development, and compare statistics on customizable dashboards. DPA can enable you to customize alarms and drill into specific operations, helping you stay on top of vital problems and occurrences.
In preparing this guide to administering IBM Db2 databases, I was using tools that allow for automated monitoring and reporting of issues with Db2 databases. I recommend you use SolarWinds DPA software in your daily work with your IBM database environment. SolarWinds DPA can help you:
- Use database tuning and optimization recommendations provided by the software based on the current status of the database environment
- Quickly find blocking queries, configurations that slow down databases, and hardware issues causing performance problems
- Monitor the performance of the database with the rest of the organization’s computing environment through easy integration with software that combines the monitoring results of other specialized tools
There’s a 14-day free trial of DPA available for download.

What Is Db2 Performance Tuning?
Before we dive into the Db2 performance tuning guide, let’s go over the basics of Db2. Designed to productively retrieve, store, and analyze data, Db2 is a relational database management system (RDBMS) constructed by IBM. It’s a high-performance database engine capable of handling large data quantities and serving multiple users.
Db2 uses Structured Query Language (SQL) to access, add, and remove data. This language handles queries, which are requests for information transmission, and can also enable table creation. When enacting the Db2 query performance tuning tips in this article, be sure to account for SQL’s unique specifications and opportunities.
Db2 performance tuning tips on your mainframe can help you transmit data safely and avoid compromising accuracy. Consistent Db2 performance tuning can shave time off query responses, prevent bottlenecks, deploy clusters, and support multiple user experiences. You can also monitor server health metrics around the clock to diagnose and investigate crucial events.
Before expanding on more Db2 query performance tuning tips, let’s list some common root causes of Db2 issues:
● Poorly Written Queries
Queries are based on a set of predefined codes. Complications can occur if queries are miscalibrated, miswritten, or somehow edited. You should also avoid selecting insufficient indexes, which can result in the analysis of excessive or unnecessary data.
● SQL Blocking and Locking
If more than one user is accessing information on your database simultaneously, the database will “lock” to prevent changes from being made. When locks are held for a prolonged period of time, they become idle “blockers” and prevent changes from being made. Blockers and other locking incidents can be difficult to resolve, so it’s best to prepare for them ahead of time.
● Race Conditions
When a device tries to execute two actions at the same time, a “backwards race” to complete the task begins—each thread wants to complete its task last, since that thread’s data will write over the previous thread’s value. This is known as a race condition. Race conditions are unpredictable, sometimes remaining separate and performing well and sometimes resulting in a deadlock. A deadlock occurs when each thread locks the variable already locked by the other, causing a perpetual standoff where nothing happens.
● Limited Database Resources
Just like any database, issues can stem from there being limited space, time, funds, and other resources. Db2 performance tuning and monitoring can help you solve these allocation issues before crossing critical thresholds and prevent resource-related complications from happening in the future by using critical data to make predictions.
Pinpoint the root sources of problems using the Db2 performance tuning tips in this article. Identifying root causes of Db2 performance issues allows you to attack these challenges effectively and efficiently. The process of discovering, diagnosing, and delivering solutions on Db2 performance issues can be demanding—enlisting the support of a database performance tool, like SolarWinds DPA, could help you expedite the Db2 tuning process.
Db2 Performance Tuning Guide
There are many strategies you can use to improve your database. My three core Db2 query performance tuning tips are: perform routine tuning, create baselines, and use optimal indexes when executing queries. Let’s dive a little deeper into these specific Db2 performance tuning tips for your mainframe.
Routine Db2 Performance Tuning
One of the most important Db2 performance tuning steps, in my opinion, is to schedule routine tuning into your business calendar. Routine Db2 tuning will allow you to consistently monitor system and query metrics such as SQL performance, time spent processing and I/O time, and section explanations plus actuals. Use this information to stay on top of positive and negative changes in your Db2 database and determine expectations for your database’s performance.
Creating and Implementing Baselines
Defining expectations will also help you identify baselines for your Db2 query performance and other metrics. Baselines provide reference points for problems, helping you spot peak usage periods. Discerning and implementing baselines allows you to set targets, find anomalies, troubleshoot future complications, and discover your system’s capabilities.
Using Optimal Indexes for Efficiency
Indexes create structures of organized information, making it easier for you to find and process important data. Indexing your queries can optimize execution time, eliminate long waiting periods, and generally speed up the process of retrieving and transmitting data. Good indexing will certainly save you time and energy—inversely, poor indexing can consume hours of precious time. Always check the where clause and the column list and use index-only access whenever possible as to retrieve data without looking it up in the table itself. Avoid selecting all columns using SELECT* and instead opt to specify the smallest necessary number of columns. Following these three guidelines will help improve Db2 performance by giving you a deep and consistent understanding of your Db2 database. You can complete these tasks on your own, but investing in a database performance tool is far easier, simpler, and often less expensive in the long run. Db2 performance tuning software is designed to collect and analyze vital information, then visually present important data, so you can make the right decisions.

Db2 Performance Tuning Steps
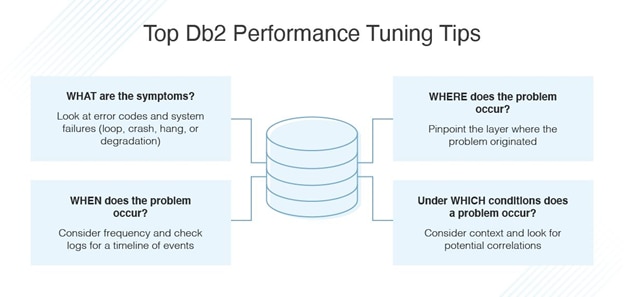
Along with the Db2 performance tuning tips listed above, here are four steps you can take when troubleshooting Db2 issues and complications. Following “The Four W’s” can help you fix problems in your Db2 database.
1. WHAT Are the Symptoms?
Consider what error codes appear and what they say, as well as who is reporting the problem. Figuring out how the system fails—a loop, crash, hang, or degradation—will help you anticipate how to move forward.
2. WHEN Does the Problem Occur?
Consider how often the failure occurs, if it happens at the same time, or if it was a one-time occurrence. You should develop a timeline of events leading up to an incident, especially one-off incidents—a best practice for this is to start at the end and work backwards towards the beginning through available logs and information.
3. WHERE Does the Problem Occur?
Consider if the problem is specific to one platform or comes across multiple systems. Many layers exist between reporting and failing components, so be patient. Identifying which layer is responsible for an error can be frustrating but will help pinpoint the problem’s home environment.
4. Under WHICH Conditions Does a Problem Occur?
Consider if the problem occurs when a particular task is running, after a certain sequence of events, or alongside other applications failures. This doesn’t necessarily mean the problems are related but offers good insight into the root cause and origin.
There is an optional fifth step—recreate the problem in a controlled environment, if you can. This will help you discover tools to use when these problems occur in real life, offering flexibility and control over situations. However, you must ensure the problem cannot be easily recreated after you recreate it for tuning purposes. Consider if the issue can be recreated by a single command, string of commands, or a particular application.
Recommended Db2 Query Tool Free Download
My most important Db2 tuning tip is to invest in a database monitor for Db2 performance observation. This will help you collect and understand your Db2 performance metrics, so you can better fine-tune Db2 and avoid future issues. If you’re looking for an excellent Db2 performance tuning tool that also covers the bases of other database monitoring requirements, I recommend SolarWinds Database Performance Analyzer for IBM Db2, which offers a Db2 query tool free download before purchase.
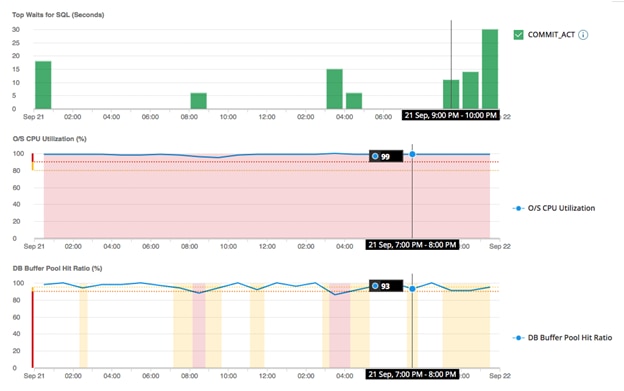
DPA is designed to create visualizations of Db2 performance metrics and display them on dashboards, unearthing root causes of query complications. View past and present metrics, response times, and tasks completed with the option to drill into specifics to discover anomalies. DPA can also enable you to analyze post-lock activity on the Db2 mainframe.
Gather customizable metrics, determine root sources for database performance issues, and search for specific SQL queries with assistance from DPA. DPA is designed to identify and resolve SQL blocking in real-time. View even more information on the Top Blocking Sessions Tab dashboard, plus gain access to many other DPA dashboards designed to display analyses and resolutions with a single click.
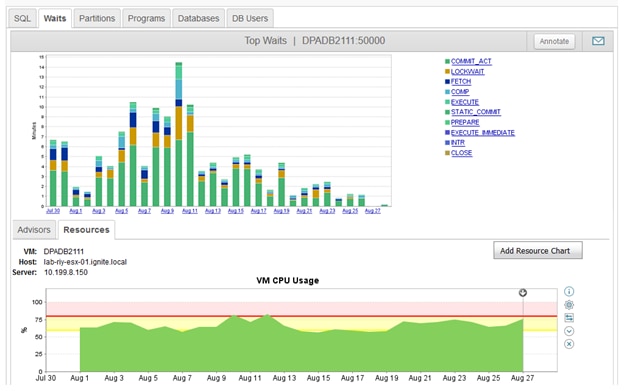
SolarWinds DPA contains a unique Multi-Dimensional Performance Analysis, which enables you to correlate events with large resource hoggers and blockers. DPA also uses a REST API designed to automate database optimization without any agent installations for individual nodes.
Download a 14-day free trial of DPA today and bring these Db2 performance tuning tips to your mainframe to improve operations. SolarWinds DPA prices start at US$905.