
Amazon Web Services (AWS) is a service that provides cloud computing, including computing services, storage and databases, networking, analytics, application services, IT management, deployment and developer tools, and mobile and IoT tools. The breadth of AWS is so wide, it’s been rapidly adopted in many enterprises. In fact, AWS is the leading provider of cloud computing services, owning about one-third of the market as of February 2020.
The reason behind this popularity is simple—it’s secure, scalable, and cost-effective compared to traditional infrastructure. It has numerous features, good customer support, and a big brand name behind it. However, the many benefits of AWS can be lost if you don’t confirm it’s configured and working well in your organization. With performance bottlenecks, you can lose cost savings and reduce reliability, and without regular monitoring, you can potentially miss security issues (that could be masquerading as a performance problem). Several tools are available to help support your use of AWS, with the aim of testing and monitoring performance. My recommendation is SolarWinds® Database Performance Monitor (DPM), as it’s a complete AWS performance testing tool and a SaaS offering with near-instant setup and easy-to-use interface.
What Is AWS Performance Testing?
AWS performance testing is checking whether AWS is functioning properly. If service is slow or errors have occurred, this can impact all your applications and your entire service. You need to check several different metrics for AWS performance testing.
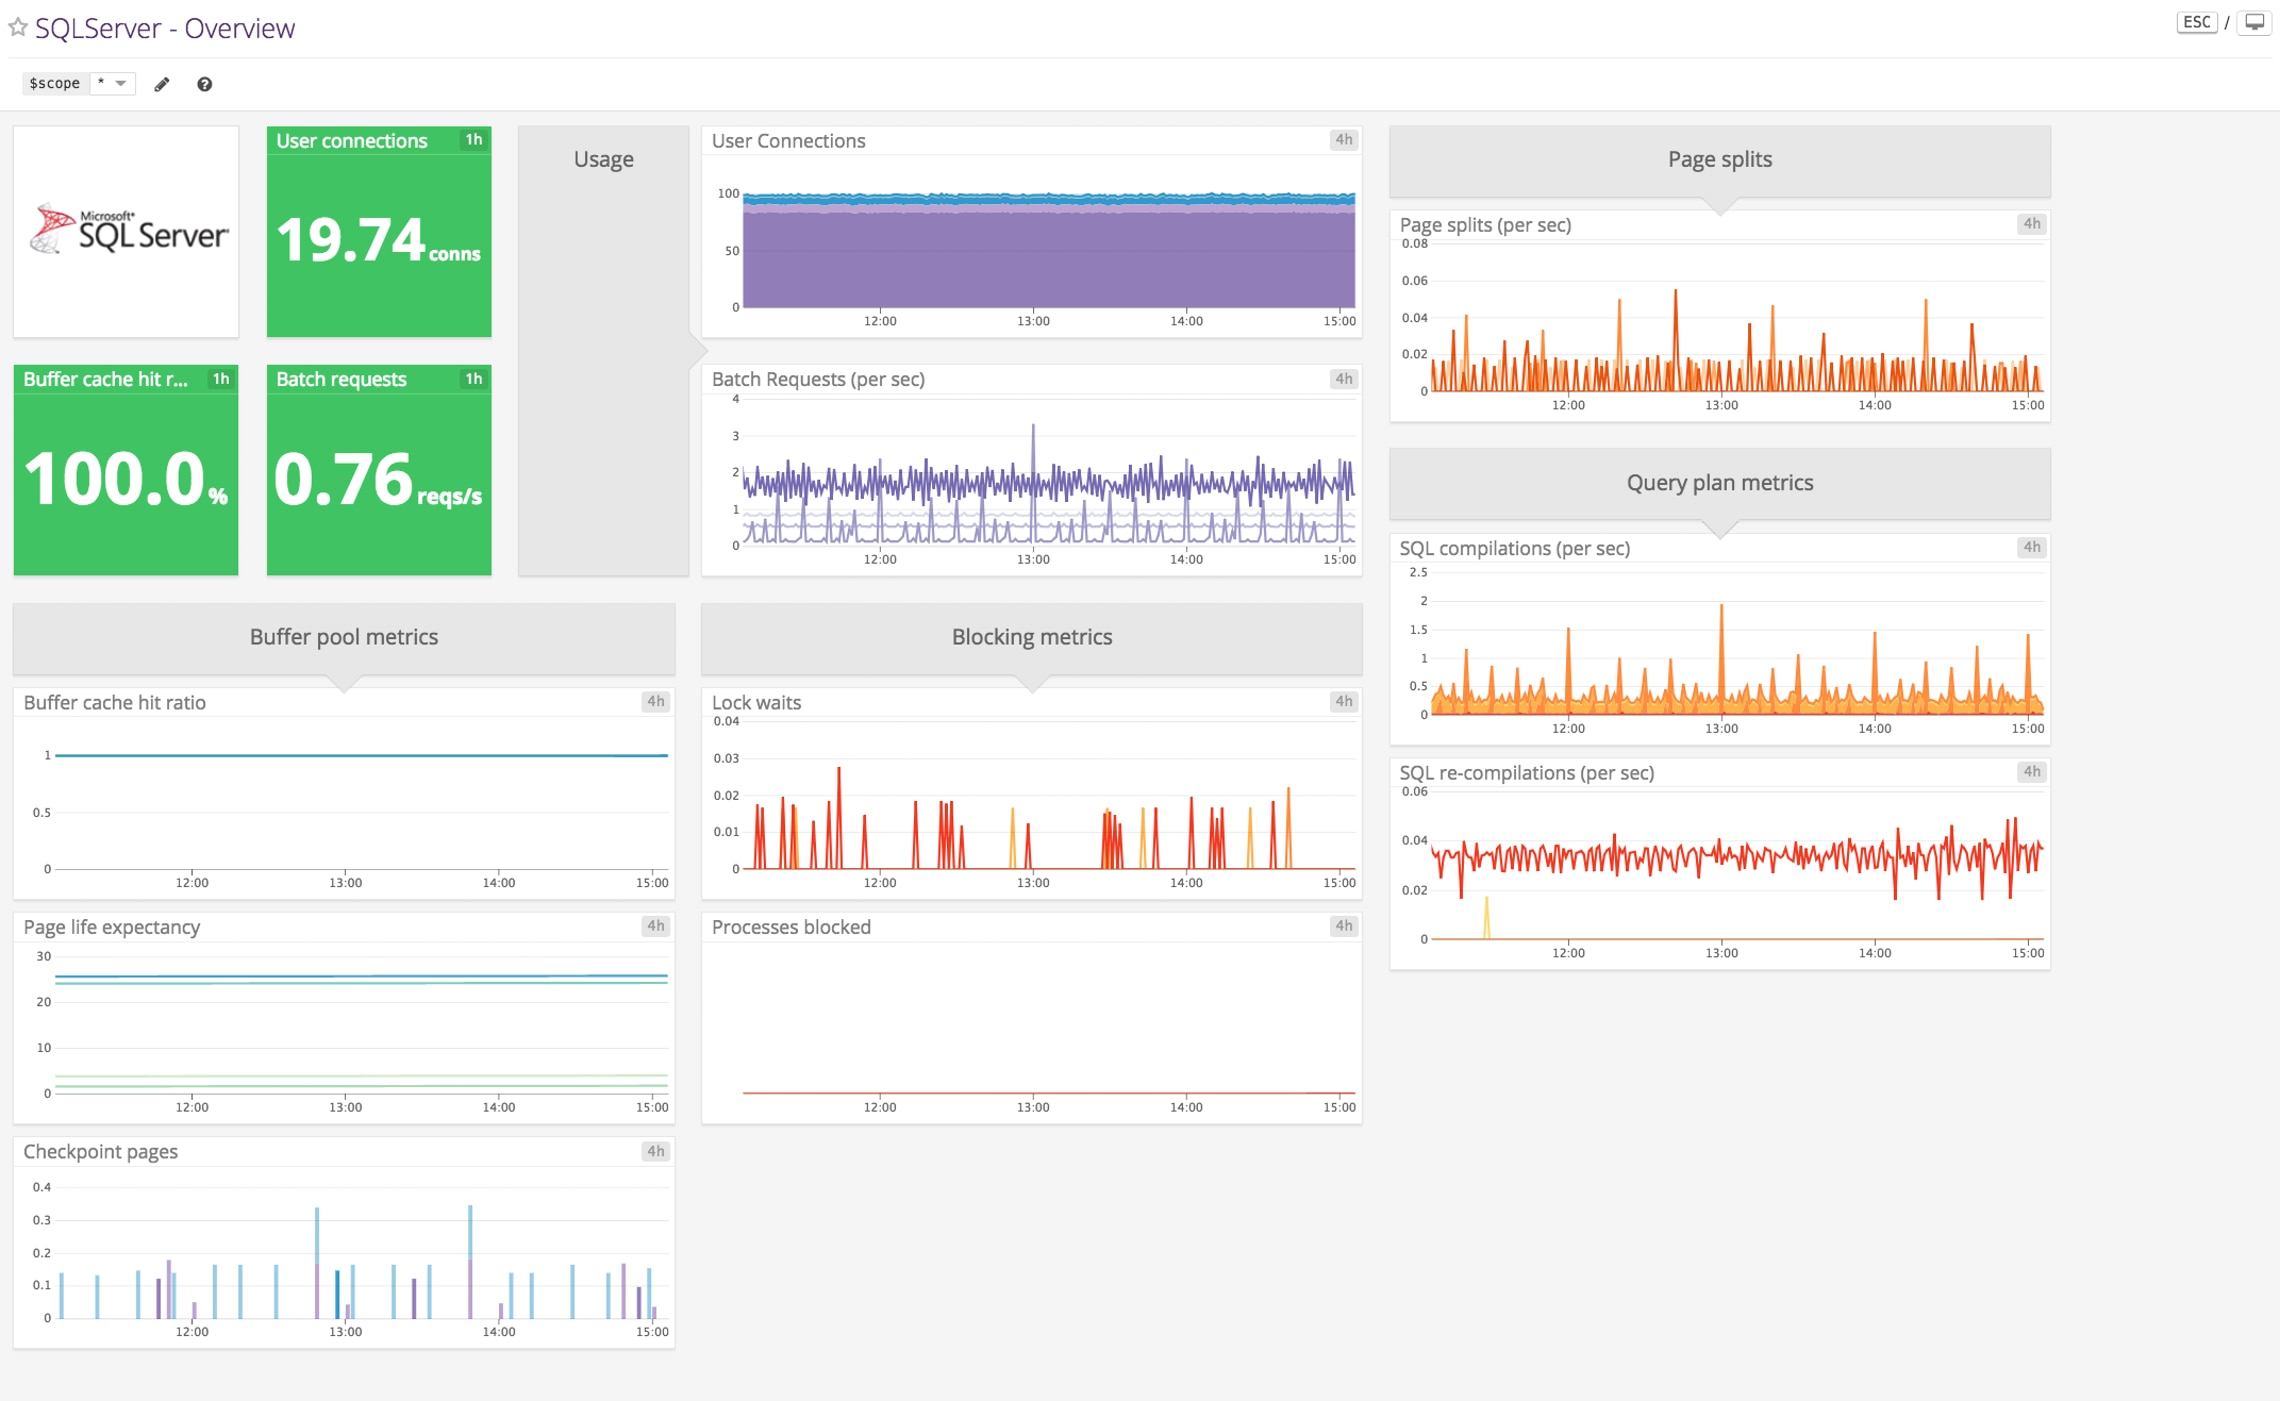
CPU and Resource Utilization
CPU and resource utilization should be some of the first metrics you check, and it’s easy to spot in most cases if there’s an issue here. If you see the application performance declining but no changes to network performance, disk I/O, or memory, CPU utilization could be the problem. You should check any of these metrics showing continuously high levels of usage, combined with slow application performance, as a potential bottleneck.
Read and Write Queries
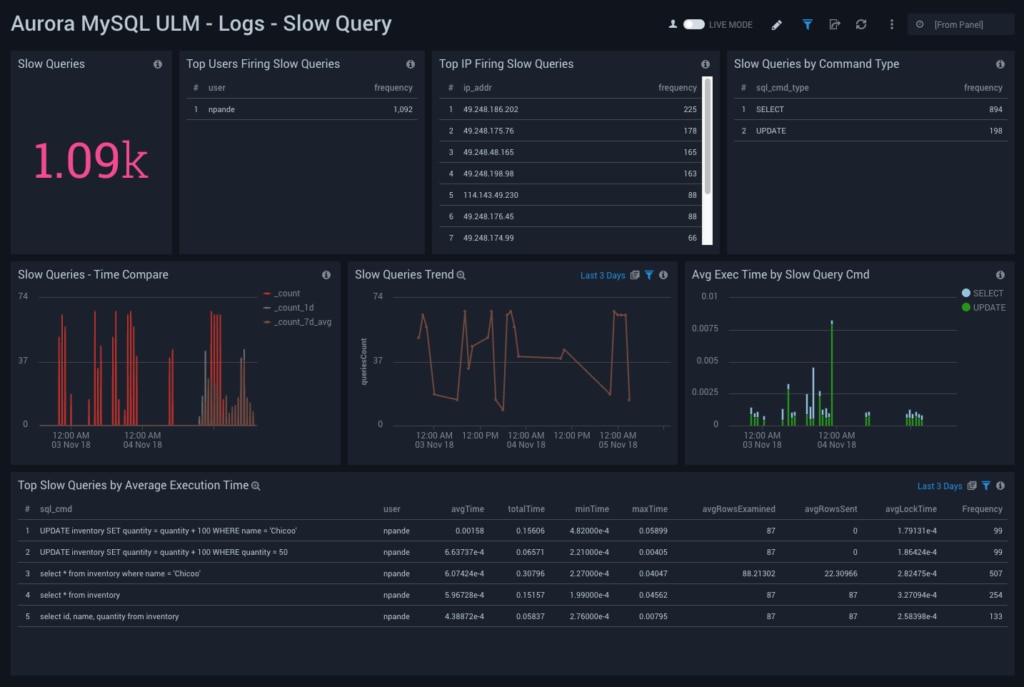
The next thing to consider is the queries you have running, as poorly-optimized queries can also introduce issues and create performance problems. There are many different ways to optimize your SQL queries for better performance, especially when reading from the database.
For example, using SELECT queries with appropriately defined columns will be a much faster and less costly query than using SELECT*. Indexing is also important for ensuring fast performance, and if you haven’t optimized your data tables with indexes, you can run into big issues. A good performance testing tool should be able to analyze and examine your SQL queries and flag ways you can performance tune or optimize query performance.
Load Balancer Optimization
Another thing to check as part of AWS is whether your load balancer is optimized. The load balancer for AWS is available as three different choices: the Classic Load Balancer, the Application Load Balancer, or the Network Load Balancer.
Depending on where you’re seeing performance issues in your system, it may be worth switching between these to check which one gives you the biggest functionality and performance gains. Application Load Balancers can help you to route traffic depending on the content, and it may also help to route HTTP and HTTPS traffic to speed up application performance. For the Network Load Balancer, this can be useful if you’re experiencing slowdowns due to TCP traffic, or issues related to preserving client IP addresses.

Get an AWS Performance Testing Tool
The easiest way to keep track of AWS performance is to use a tool. You can try to monitor performance metrics manually, but I highly recommend using an automated approach if you’re using AWS in any kind of business environment.
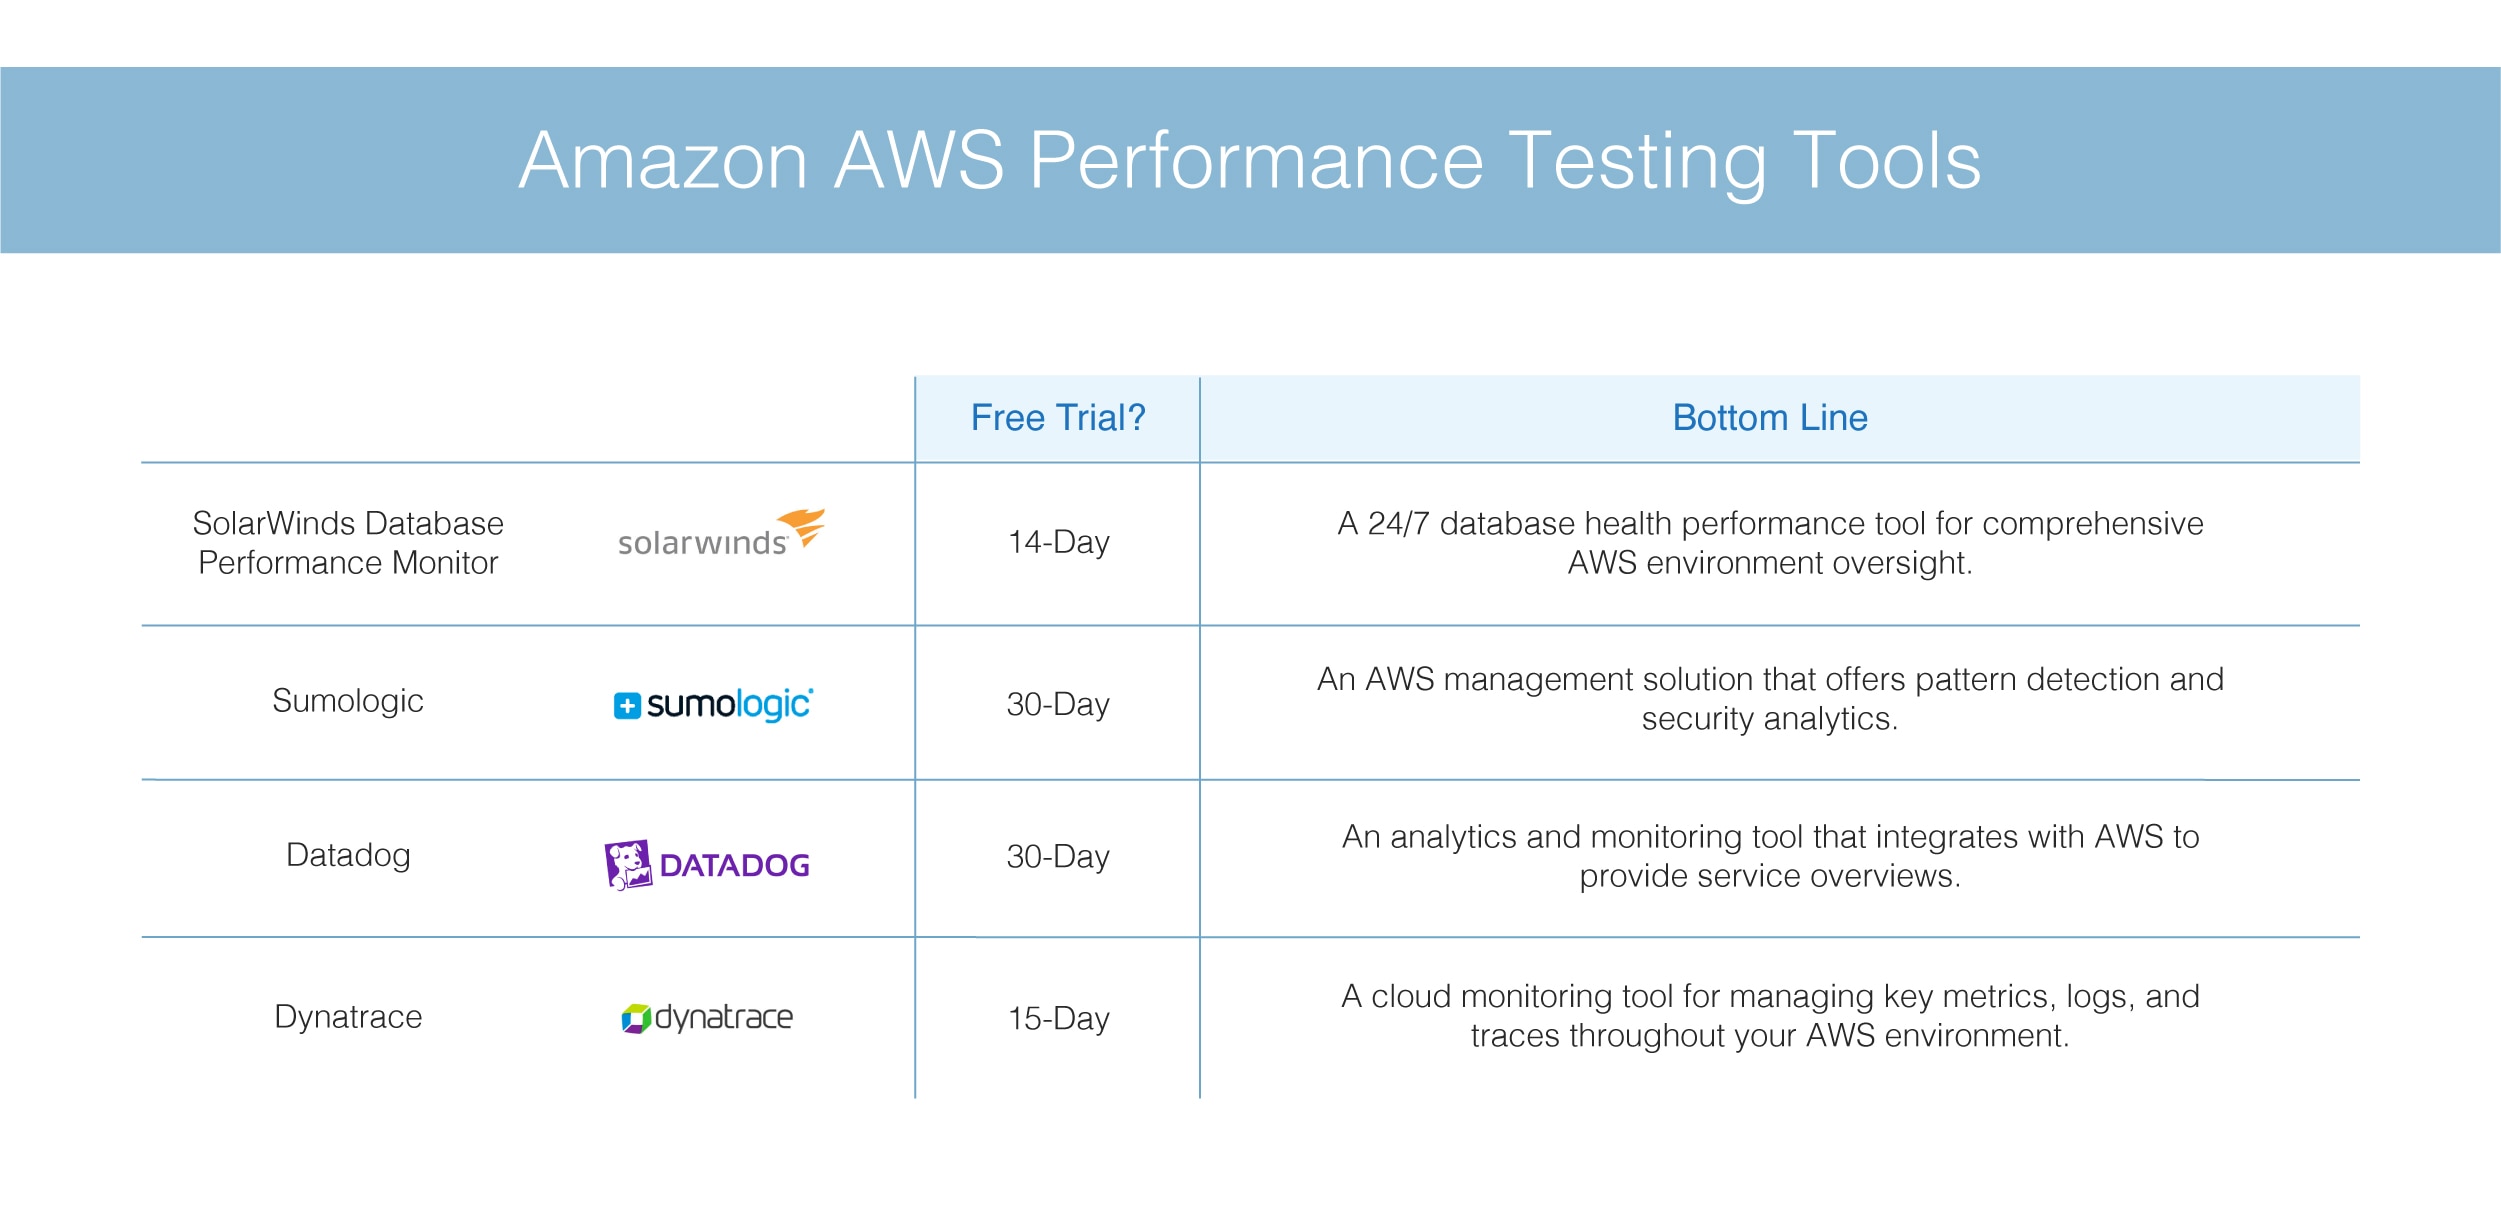
SolarWinds Database Performance Monitor
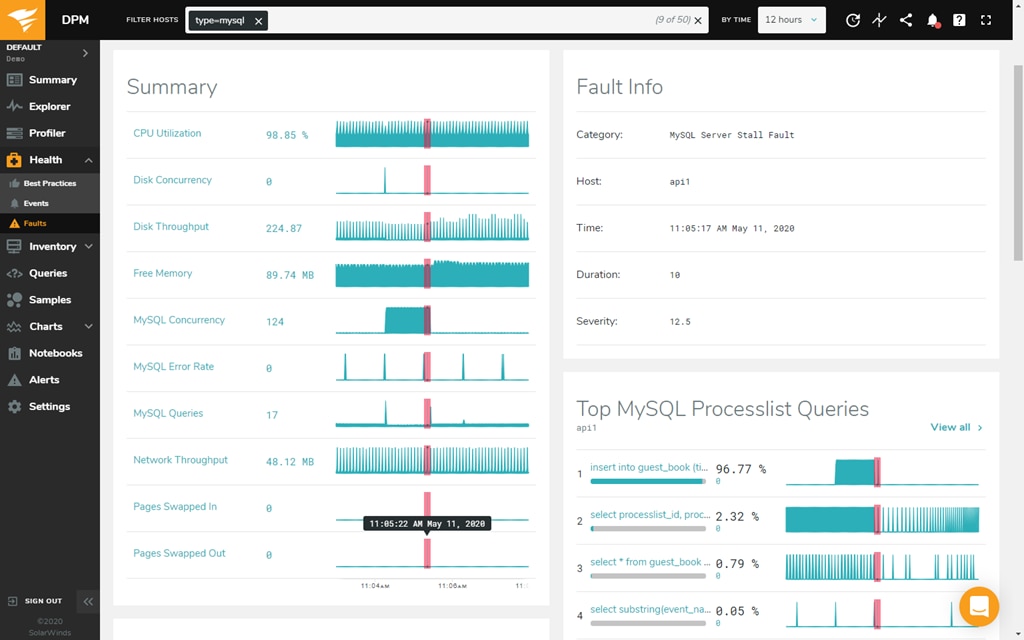
One of my top choices for a tool to test AWS performance is SolarWinds Database Performance Monitor (DPM). I consider this to be a complete tool for AWS performance testing. DPM offers 24/7 real-time database health performance monitoring, through a SaaS platform with a web-based user interface. This makes it easy to use, with comprehensive monitoring and a complete oversight of your entire AWS environment.
It helps you find answers to database performance issues quickly, with down-to-the-second data collection. You can immediately see when a problem arose and compare the timing with different performance metrics to discover the issue. When an issue occurs, you can share post-mortem documentation with your team, to look at query response and performance behavior in comparison to system metrics, look deeply at query details to allow optimization, and spot unusual behavior in the database.
It also includes tools to provide recommendations based on best practices, so you can support your decision-making or get tips if you don’t know where to begin. When deploying code, you can also look at performance before and after, to spot whether a new code deployment has caused an issue. You can also use DPM to check potential deployment performance impacts before you deploy, to stop unnecessary problems before they begin.
I’ll go through another few options, so you can see what else is out there, but I highly recommend SolarWinds DPM.
Sumologic
Sumologic also offers an AWS management solution worth checking out. Sumologic is an AWS management solution, which includes performance tools. It has native support for AWS apps and services and integrates easily with your other performance management tools. This is a tool designed to monitor AWS application performance, rather than a complete AWS solution.
It uses pattern detection through machine learning tools to identify issues outside of baseline performance. This allows you to quickly spot when a problem has occurred.
One of the unique features of Sumologic is it specifically includes features for security analytics, particularly for threat identification and compliance purposes. It includes functionality for maintaining compliance with standards such as PCI DSS, HIPAA, and GDPR.
Finally, the LogReduce and LogCompare tools allow you to drill down into issues to detect anomalous behavior and determine the root cause of issues.
Datadog
Datadog is another analytics and monitoring tool with features designed to help you with AWS monitoring. Datadog displays information on metrics and events for DevOps purposes across the full stack and can be used with both SaaS and cloud providers.
It includes automation tools and features to help you with monitoring and instrumentation, source control and bug tracking, and the monitoring of your databases and components in most common servers.
Datadog has an integration that allows you to monitor AWS performance through the platform. For application monitoring, Datadog allows you to monitor, troubleshoot, and optimize application performance by tracing your requests through the AWS system and flagging issues that come up. You can also use Datadog to create service overviews, while automatically generated service reports can support you in your analysis. For latency and errors, Datadog graphs and alerts allow you to quickly see when latency is spiking or if an unusual event has occurred.
In addition, with log monitoring, filtering, and analysis you can check out what issues have occurred and when and the problems causing them. One of the useful features of Datadog is it includes automated tagging for logs, so you can sort and correlate issues with performance quickly and easily. Finally, use Datadog for comparing database and application issues in the back end, with user experience metrics. Easily spot whether your development decisions have impacted users in a negative way and look at your front-end and back-end metrics in one cohesive view.
Dynatrace
Another great cloud monitoring tool to check out is Dynatrace. Dynatrace is created specifically for cloud-native and hybrid environments. It includes features for handling the management of information on key metrics, logs, and traces throughout your AWS environment smf user experience data, so you can compare the two.
It works with a wide range of AWS services, so you can feel confident your monitoring solution is covering all your bases. The primary benefit of Dynatrace is it’s easy to install, as you only need to install the Dynatrace OneAgent and then you’re ready to get started. This is a highly automated solution with little manual configuration required, and a lot of the monitoring process is artificial intelligence-based as well. This can be both a positive and a negative, depending on how much control you want to have over the monitoring process.
The main downside of Dynatrace is the API and dashboards, as they include a lot of information requiring more expertise. The installation is easy, but the learning curve is a little steeper.

How Do I Choose a Tool?
There are so many different options available, it can sometimes seem hard to choose or to figure out which tool is best. There are a few basic things you can consider right from the outset. First, ensure the tool you choose matches the environment in which you want to use it. For example, if you’re looking for a tool for a large enterprise, make sure you choose a tool offering a complete and easy-to-use solution designed for professional use. Lightweight, free, and open-source tools can be useful but are usually not powerful enough for enterprise settings.
A complete tool for AWS performance testing is SolarWinds Database Performance Monitor, as it’s suitable for large enterprises and small businesses and is easy to get up and running. When you’re looking for a tool for AWS performance testing, find something with the features you need and is intuitive, from a well-known brand, and easily understood. In a large enterprise, it’s vital for all performance testing tools to be both powerful and simple, as spending time with complex manual processes in a large IT environment is simply inefficient. Check out a free trial of DPM here.