
Amazon Relational Database Service (AWS RDS) is a web service specifically designed for dealing with relational databases in the AWS cloud. The purpose of AWS RDS is to make relational database management and setup much easier. It can help you provision the infrastructure capacity you need for installing database software and automate many administrative tasks included with managing a database, including software patching, and managing backups.
However, even with this management service operating, you must monitor database performance to ensure any issues are discovered quickly. Without monitoring your database, you can end up with bottlenecks and service issues capable of majorly impacting end users or service delivery.
I recommend using a performance monitoring tool such as SolarWinds® Database Performance Analyzer or SolarWinds SQL Sentry to perform database SQL query performance monitoring, analysis, and tuning. Proper performance tuning ensures issues arise less frequently, your database has fewer bottlenecks or errors, and performance is faster overall.
Why Is AWS RDS Performance Critical?
AWS RDS performance matters because databases form the backbone of your IT infrastructure, providing data for your devices, services, applications, and storage. Slowdowns in saving, changing, or deleting data can quickly ripple through the entire system. This causes frustration for your employees, potential service delays for your end users, and major losses in both productivity and revenue. The efficiency gains (or losses) in your IT infrastructure’s operations can have much larger impacts than you expect.
AWS RDS is available for many kinds of database instances, including:
- Amazon RDS for MariaDB
- Amazon RDS for MySQL
- Amazon RDS for Microsoft SQL Server
- Amazon RDS for PostgreSQL
- Amazon RDS for Oracle
You need to monitor the database engine for slowdowns for each of these. For example, for AWS RDS Oracle performance, you can monitor and tune by looking at wait times, loads, resource metrics, analyzing SQL queries, and more.
Keeping track of these performance issues can make a big difference in how efficient your organization is, and I highly recommend approaching the AWS RDS performance tuning process with this in mind. Let’s look now at performance tuning and some advice to help you carry it out.
AWS RDS performance tuning
Database performance tuning is the process of optimizing and improving performance, either to remedy current issues or in anticipation of expected issues. Part of the process involves regular and comprehensive monitoring of database performance metrics so you know what you’re working with and can see where you want to get to.
What metrics should you monitor?
When approaching AWS RDS performance monitoring, you could examine several metrics, which can get overwhelming. However, there are some core metrics you need to keep track of—without measuring these, you won’t be able to tell if your database is healthy or not:
Availability
The first thing to look at is the availability of your database. This could be to identify an outage, or simply to find out if your database is experiencing latency. This can also include monitoring for a general, slower trend downward in terms of availability.
Resource usage
The next thing to check is resource usage. If your database simply runs out of resources, this can cause slowdowns. This could include table size limits in MySQL, hitting the maximum number of database connections allowed per instance, or capacity constraints if you’re working during demanding times.
Errors
You should always monitor for errors, both system-related and human-based. Your database error log will be available in the RDS console or through whatever third-party tool you use. These errors can show you any problems occurring inside the database. Human error is also a factor; you should always monitor for mistaken configuration changes. If you change an element in your database schema or cluster, monitor the database to see whether it has any unintended consequences.
Performance limits and scalability
The bigger your applications and databases get, the more likely they will reach performance limits. You’ll need to know how your IT infrastructure scales and allocate more resources as you grow. Monitoring and optimization can also help ensure you get the most out of your resources.
RDS-specific metrics
You also need to monitor RDS-specific metrics, including read/write rates. You can fix many of these issues using indexes, caches, table locking, key constraints, and replicas. Keep tabs on system metrics, including CPU, memory, and disk usage—their limits will be shown in the AWS console or in one of your tools.
Queries
See what slow queries you have in your query log. You can find which statements are taking the most time and try to optimize around those issues. For example, if you have a statement executing a full table scan, you could improve this by adding an index.
Instances
Lastly, look at your instance types and instance counts. If you have many small instances,start trying to switch to larger ones. However, you’ll still reach a point where you have the largest instances available, potentially at a high cost. You can also review whether you need the instances you have or if scaling down is possible. Scaling automatically based on need is a good way to manage instance size. Consider adding read replicas and shards to manage the number of instances you have and keep tabs on how large your clusters are getting. Larger clusters are complex and can add additional bottlenecks.
You should monitor and optimize these metrics and issues to help the performance-tuning process. You can plan for capacity changes or growth by carefully checking your system health metrics. And by keeping tabs on SQL queries and errors, you can spot issues potentially causing performance problems. For example, if you have large database tables, you can apply indexes to speed up queries and only SELECT fields you need rather than using wildcards to select all.
Finally, by managing your database instances in size and number, you can ensure your database system doesn’t sprawl out of control and cost you money and performance.
What tools should you use for AWS RDS performance tuning?
One of the difficulties of monitoring performance is collecting and aggregating performance information from several parts of your infrastructure. In a large enterprise, performing this process manually is impossible. You must use database performance monitoring tools to ensure you’re up to date.
Amazon provides its own tool called Amazon RDS Performance Insights, but this only monitors database load. This means other factors potentially impacting performance may be overlooked. Monitoring and tuning performance requires oversight over several different aspects of database function. I recommend two different SolarWinds tools to help you with AWS RDS performance tuning, though they both fill slightly different roles.
SolarWinds Database Performance Analyzer
© 2023 SolarWinds Worldwide, LLC. All rights reserved
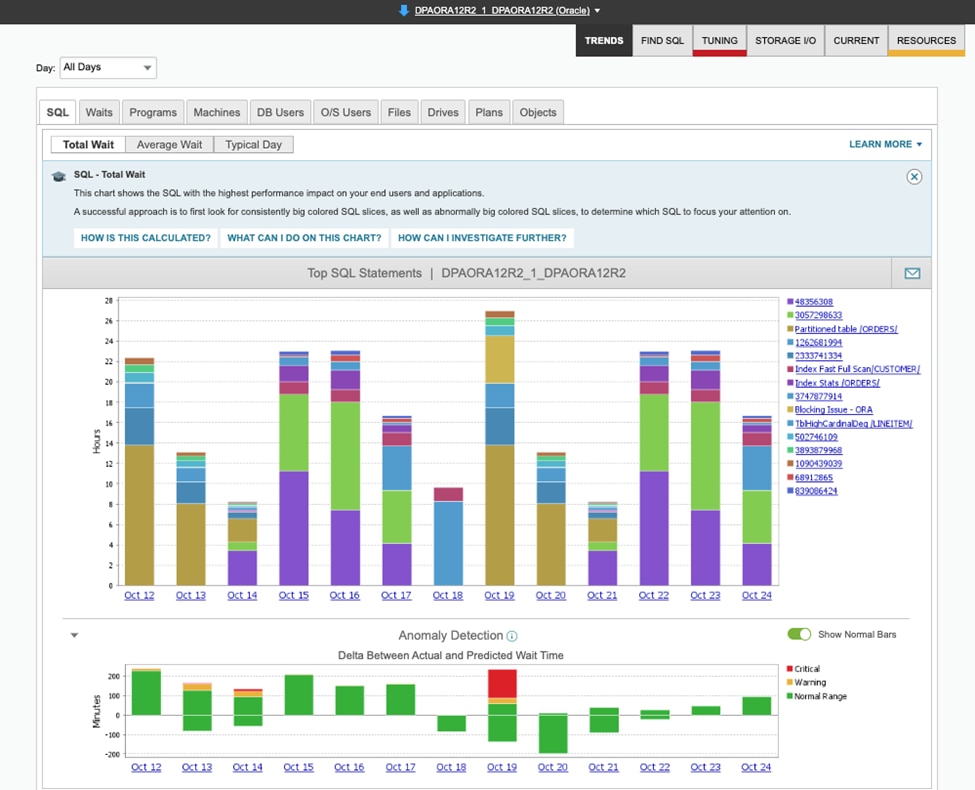
The first is SolarWinds® Database Performance Analyzer (DPA). DPA has several features that make it ideal for database performance tuning and monitoring and supports a wide range of proprietary databases to give a holistic picture of performance. Whether you’re dealing with Oracle, SQL Server, MySQL, MariaDB, or Aurora databases, DPA offers a single view for streamlined administration and quick issue resolution.
From a single unified dashboard, DPA allows users to swiftly pinpoint performance issues, identify bottlenecks, and uncover the root causes of anomalies. It employs algorithmic machine learning to understand normal database behavior and offers robust anomaly detection capabilities. This helps open the product up to multiple users, from DBAs to Application Developers to DevOps engineers.
SolarWinds DPA features
SolarWinds DPA has flexible deployment options available, you can run it on-premises or self-hosted in AWS or Azure. DPA aggregates all on-premises and cloud installations into one central location. This allows you to set up and get started quickly.
DPA is built for granular, to-the-second performance monitoring, providing database users with real-time data and historical analysis for AWS instances. It includes blocking and deadlock analysis for SQL blocking hierarchies, which can significantly affect throughput and SQL Server responsiveness. The Amazon RDS monitoring metrics provided by DPA can help you more effectively optimize database performance and prevent overprovisioning.
Database performance tuning is a common use-case for DPA, and comes with table, index and query advisors out of the box. A typical example here is application developers looking to improve their application’s performance would frequently use DPA to tune their application’s DB queries and table/index schemas.
DPA is designed to help both DBAs and non-DBAs alike by correlating database activity, wait times, SQL statements, application requests, and other dimensions to investigate the cause of application slowdowns.
SolarWinds SQL Sentry
© 2023 SolarWinds Worldwide, LLC. All rights reserved.
Another tool I recommend is SQL Sentry, also available within the SolarWinds database portfolio. It offers robust capabilities for monitoring and optimizing the performance of Amazon RDS instances, particularly those running Microsoft SQL Server as their database management system.
SQL Sentry is one of the industry leaders in performance monitoring for SQL Server hosted on Amazon RDS or Amazon EC2. This is due to its ability to collect performance metrics for SQL Server workloads hosted on Amazon, that give data teams unprecedented capabilities for proactively managing performance:
- Displays actionable metrics, including waits, backups, transactions, latency, and Top SQL (completed queries and query and procedures stats)
- Comprehensive high-impact query analysis
- Animated deadlock re-enactment
- ability to define logic for a limitless array of automated performance tests and take action, including executing PowerShell command
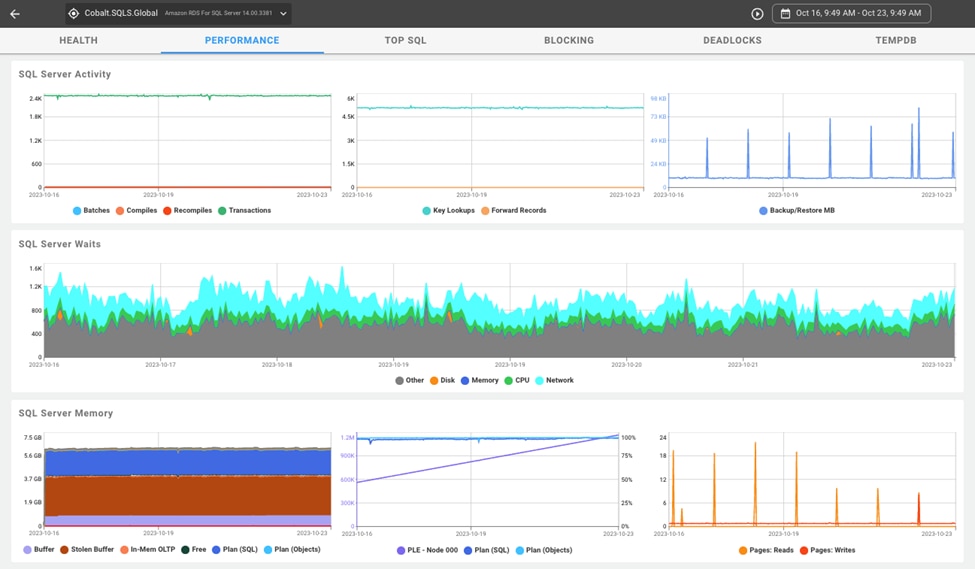
SQL Sentry dashboard
SQL Sentry’s integration with Amazon RDS and EC2 platforms provides users with comprehensive insights into their data estate’s performance. It offers deep-dive capabilities and actionable performance metrics, facilitating fast root cause analysis for any performance problems that may arise. It effectively utilizes AWS EC2 instances and EBS volumes to monitor the performance of SQL Server databases hosted on AWS, ensuring optimal database performance.
SQL Sentry features
SQL Sentry is designed to provide a thorough description of a database’s performance by presenting actionable metrics related to aspects such as waits, backups, transactions, latency, and the behavior of SQL queries and procedures. This simplifies RDS monitoring and empowers database administrators and performance analysts to identify and address issues, optimize AWS RDS performance, and ensure the smooth operation of the database system.
The tool also provides a dashboard rich with vital statistics that show the health and performance of databases. Whether it’s assessing the duration of processes waiting for resources (waits), monitoring data security through backups, tracking transaction activity, or identifying latency affecting user interactions, SQL Sentry presents a comprehensive array of data points.
A key feature of SQL Sentry is its comprehensive, high-impact query analysis. Its RDS monitoring capabilities don’t stop at just reporting which queries are impacting performance. It also delves into the essence of these queries. It exposes the inner workings of query execution plans, which reveal bottlenecks, inefficiencies, and opportunities for optimization. This ability gives administrators unparalleled insights into query behavior, bringing the process of query optimization to a whole new level.
There’s one more feature that makes it an ideal RDS monitoring tool. SQL Sentry empowers users to create custom automated performance tests with adaptable logic, enabling the execution of actions and PowerShell commands. The tests, powered by adaptable logic, enable administrators to define not just what to test, but also how to respond when issues arise. Integrating PowerShell commands as part of these automated actions magnifies the tool’s capabilities. This dynamic flexibility transforms SQL Sentry from a mere monitor to a guardianidentifying problems and actively intervenes to rectify them. You can request a free trial of SQL Sentry for up to 14 days.
How to choose a tool for RDS monitoring
If you want something basic to ensure you have somekind of performance monitoring tool in place, Amazon RDS Performance Insights may be enough. However, this won’t show the whole story for a typical enterprise, as you’ll need to check on significantly more metrics than just database load. There are also numerous free and open-source tools available if you’re looking for something for a home project or a small business.
A starting point of your decision could be based around your familiarity with database technology. If you are a DBA, the feature rich capabilities of SQL Sentry would make it a great choice for you. But, if you are and application developer or DevOps engineer, the expert tuning advice of DPA will help with performance tuning efforts.
For organizations using multiple types of databases hosted in AWS, SolarWinds Database Performance Analyzer would be a great solution for you. DPA supports monitoring databases like Amazon RDS for Oracle, SQL Server, MySQL, PostgreSQL, and more. You can find a free trial of DPA here, or if you want to test drive it without installing it, DPA also has an interactive demo site.
If you are fully invested in SQL Server databases, SQL Sentry might be your product of choice. You can download a trial of SQL Sentry to see how it can help you optimize SQL Server performance on Amazon. SQL Sentry interactive demo is also available for you here SQL Sentry interactive demo site.
There are many different options on the market, but these are the ones I believe will give you the best approach to performance tuning for your AWS RDS.
This post was written by Israel Oyetunji. Israel is a frontend developer with a knack for creating engaging UI and interactive experiences. He has proven experience developing consumer-focused websites using HTML, CSS, Javascript, React JS, SASS, and relevant technologies. He loves writing about tech and creating how-to tutorials for developers.