
Although Windows Management Instrumentation (WMI) is widely used by websites and software providers to communicate event publicity and error details to Windows computer users, WMI monitoring is often overlooked. WMI can be a source of valuable system information for commercial network administrators and private computer users, but it often results in an unnecessary flood of inessential notifications. This may make WMI feel more like a burden than an asset.
With Windows WMI monitoring tools, you can unlock the true potential of WMI. WMI notifications can deliver critical information on your server, network, and computer, but the Action Center doesn’t feature any controls. WMI tools enable you to manage your notifications and other WMI components, so you can take full advantage of their usefulness.
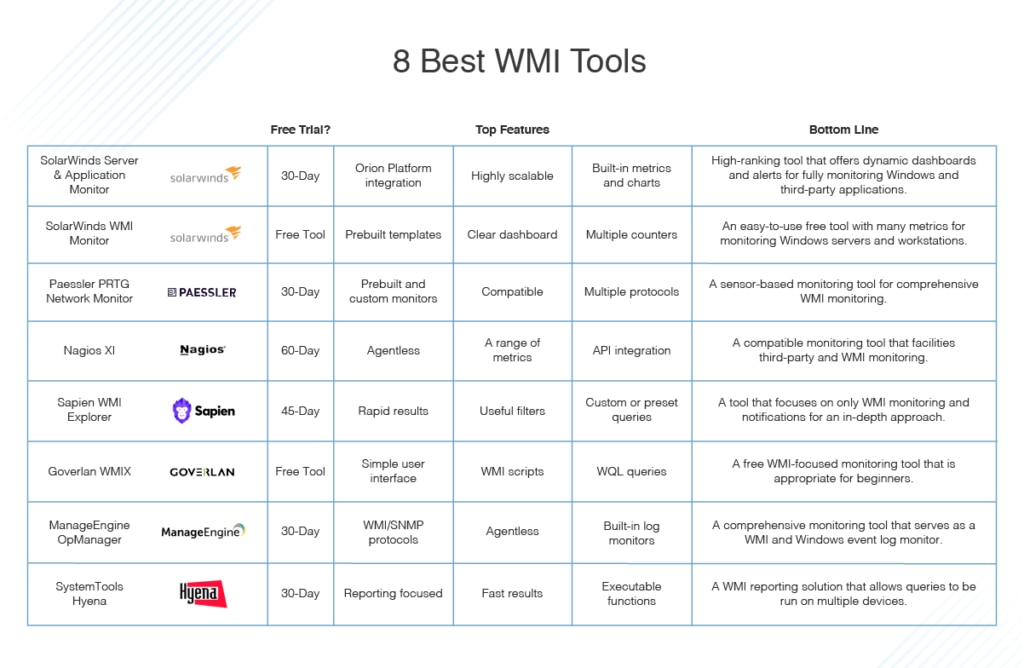
This guide will explain what WMI monitoring is and what it can be used for, followed by my ranking of the best WMI monitoring software available today. SolarWinds® Server & Application Monitor (SAM) ranks at the top of the list, offering an unrivaled approach to Windows WMI monitoring that’s sophisticated, comprehensive, and user-friendly.
What Is WMI Monitoring?
Issues With WMI
The Best Windows WMI Monitoring Tools
Choosing the Right Windows WMI Monitoring Software
What Is WMI Monitoring?
Windows Management Instrumentation (WMI) is the Microsoft implementation of Web-Based Enterprise Management (WBEM), which is managed by the Distributed Management Task Force (DMTF). The WMI management framework has been built into every single Windows operating system since Windows 2000. WMI is a proprietary technology designed to poll management and performance information sourced from Windows-based applications, components, and network devices.
WMI’s primary purpose is to define a set of environment-independent specifications, so management data can be shared between systems and applications. WMI is sometimes used as an SNMP alternative, because it offers a similar level of insight into monitoring and management data, with the added benefit of Windows-specific security and communication capabilities.
WMI allows for agentless monitoring of Windows workstations and servers, which means IT administrators can deploy monitoring solutions without needing to install agent software on every single monitored system. The WMI platform can create and execute scripts capable of reading and even altering device settings, without requiring the installation of extra software agents or monitors.
As network devices operate, WMI continually monitors and generates parameters, states, and settings. Let’s take a hard disk drive as an example. An HDD has several components and metrics associated with it, including used storage capacity, total storage capacity, free storage volume, and internal temperature. These values are likely to change as the system is used. The WMI provider is capable of responding to a request for details regarding the hard drive’s current temperature, or any other hard drive metric. It can also alert the WMI object manager if the hard drive temperature breaches a predefined level.
The WMI platform also creates the opportunity for WMI application monitoring, in the form of an application programming interface (API). The API exists at the WMI object manager level, which means you don’t need to have knowledge of the specifics of the WMI provider. The management application wouldn’t need to issue a direct query to a system or device but would only need to contact the object manager.
If an event is triggered, or a device is sent a query, the data is transmitted across the managed device’s standard architecture, through its WMI provider. It then goes to the WMI object manager, followed by the WMI consumer. This infrastructure is standardized across platforms and devices, so any WMI-enabled enterprise management software can access data collected on WMI-enabled devices, whether it has any knowledge of the device or network structure.
Issues With WMI
Why might you need Windows WMI monitoring software? As this guide has already touched on, some issues with WMI make it difficult to take full advantage of, unless you have specialized WMI tools at your disposal. WMI monitoring software and WMI tools vary enormously, but they share the goal of making WMI more effective and advantageous to the user. These are some of the most notable issues associated with WMI, which WMI tools could potentially rectify.
I’ll start with the Action Center’s design flaws. The Action Center is the desktop area where notifications are displayed. An icon facilitates access to it, changing to indicate you have unread messages. This is a subtle change, with the icon going from hollow (when there are no unread messages) to solid (when there are). This ineffective design doesn’t necessarily lead you to see notifications, as the icon is easily overlooked.
The Action Center side panel must be opened to view notifications. Some users never open the Action Center, or they might do so infrequently, either accidentally or purposefully. As such, notifications are likely to be missed. Moreover, you can flush messages out of the Action Center without having read them, via a context menu connected to the notification icon.
Lastly, commercial software developers make ample use of WMI messaging, which allows them to remind potential customers of a product’s benefits or availability. Websites can even push notifications through WMI, via WBEM, meaning the notification system is often overwhelmed by sales pitches. When WMI is used as a key marketing channel, users are likely to associate it with spam and flush out their notifications without reading them.
The Best Windows WMI Monitoring Tools
The issues with the Action Center, which often result in its being disregarded, are a real shame. WMI is used in numerous network administration processes and by key business applications. SNMP can be configured to process notifications, via WMI, into the Action Center. With a little help, you could be using WMI in a much more rewarding way, filtering out irrelevant notifications and perhaps even using alerts to communicate device errors to users.
The WMI tools listed below were built to give you control over your Action Center and help you harness the power of your notifications without having to sift through spam. In ranking these products, I considered suitability for business use, how advanced and varied the features are, and user-friendliness, along with overall value for money.
Server & Application Monitor is one of many SolarWinds products to dominate the market. SolarWinds has a track record of delivering some of the best IT management and monitoring programs available. By combining advanced features with ultimate beginner-friendliness, dynamic design, and maximum user support, SolarWinds products are among the highest ranking in the industry. SolarWinds Network Performance Monitor (NPM) is the provider’s most popular and widely used tool, but SAM is no exception to its history of creating top-quality, business-grade solutions.
SAM is built on the Orion® Platform, which centralizes your entire SolarWinds IT stack. The Orion Platform is a common technology platform upon which the major SolarWinds products are built, which means you can use it to extend your IT monitoring and management solution as you grow. You could start with SAM, for example, and then implement additional SolarWinds products as and when you need to:
- SolarWinds Network Performance Monitor
- SolarWinds Database Performance Analyzer
- SolarWinds Virtualization Manager
- SolarWinds Storage Resource Monitor
- SolarWinds Network Configuration Manager
- SolarWinds Log Analyzer
- SolarWinds Network Bandwidth Analyzer Pack
These tools are built to be integrated, affording you a centralized and comprehensive IT monitoring and management solution, across your entire stack from infrastructure to application. This scalable architecture extends across your cloud, virtualized, and physical IT environments. The benefits associated with the Orion Platform are numerous, including the ability to scale up to 400,000 elements on a single instance of the platform while the number of supported users is scaled by additional web servers.
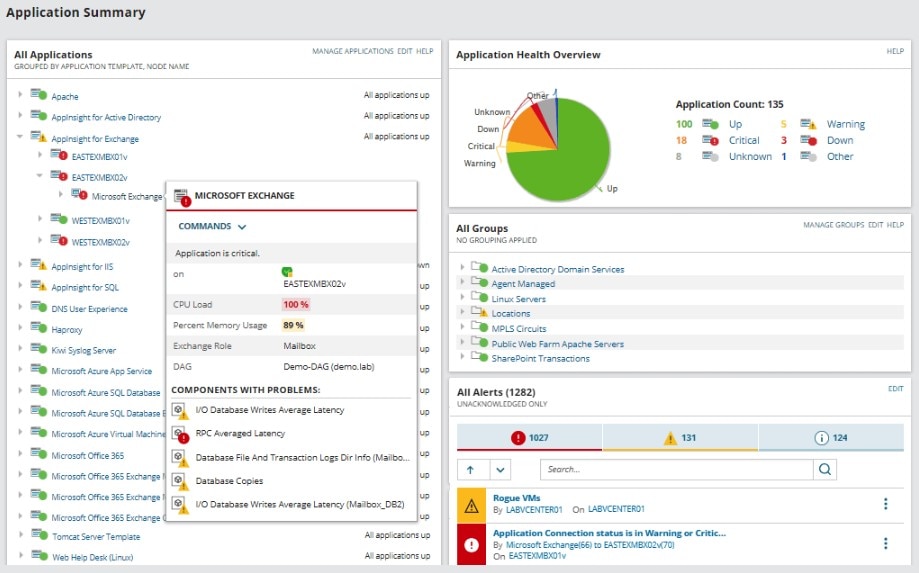
SolarWinds SAM Windows monitoring features built on the Orion Platform are extremely useful, because it affords you the flexibility to extend, grow, and integrate with other IT solutions. With one vendor and one platform, it couldn’t be easier. This is one of many fantastic SolarWinds design features, of which the dynamic user interface is at the forefront. SAM uses colorful visualizations, including graphs and charts, to display your key data. Metric categories, such as CPU load and memory statistics, are divided into widgets. These widgets can be moved and tweaked to suit your requirements, so you can place your most important metrics center stage.
The tool’s Windows server management gives you access to built-in capacity forecast metrics and charts, which help you rapidly identify when resources are nearing critical thresholds. Because SAM offers a unified monitoring solution, you can combine Windows monitoring with third-party WMI application monitoring. This includes Microsoft applications like Active Directory, Internet Information Services (IIS), Windows Server, Skype for Business, SharePoint, DHCP, DNS, and Dynamics CRM, and Oracle, Unix, Java, Linux, AIX, Solaris, Citrix, Apache, and more.
One of the challenges with WMI is staying informed, since the notifications system is largely disregarded because of its susceptibility to spam. SAM rectifies this problem by providing you with an efficient and customizable alerts system. It also offers out-of-the-box Windows monitoring templates for identifying and alerting you to performance issues. The templates allow you to collect a range of server performance data, including percentage processor time, pages per second, page file usage, length of disk queue, and much more.
With SAM, you can also monitor print servers, FTP services, network load balancing, remote desktop services, and Windows Server Update Services. You’ll be alerted to any performance deviations, so you’re always aware of any unusual activity. SAM’s real-time troubleshooting utilities enable you to remotely monitor rogue and expensive processes, and to kill, stop, and restart corrupt services.
SAM makes it possible to manage asset inventory and identify hardware failures before they start to have an impact on performance. The built-in IT asset inventory capability scans your entire Windows environment, collecting software and hardware data. This information covers drivers, hard drives, firmware, hosted virtual machines, logical volumes, network interfaces, processors, memory, Windows update information, and more.
Although SAM delivers a highly advanced WMI monitoring solution, it remains extremely user-friendly. There’s no initial learning curve or training required to get started, and the user interface is easy to navigate. A 30-day free trial of SAM is available.
If you’re looking for a free Windows WMI monitoring tool, SolarWinds WMI Monitor is one of the best available for WMI monitoring for one server. This program is built to monitor any Windows WMI-enabled device, including Windows servers and Windows workstations.
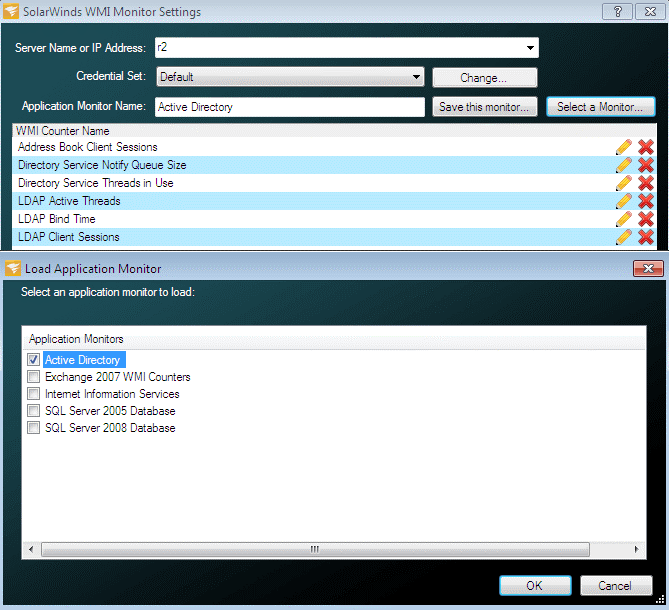
Getting set up with WMI Monitor is quick and easy. First, you’ll need to enter the server name or IP address. If you want to monitor a remote server, you’ll be prompted to enter credential information at this stage. This is essentially the login information the application will use to pull stats back from the server and is usually affiliated with an administrative-level account. Credentials include a username and password.
In the next step, you’ll be asked to input what you want to monitor. You can choose from a list of prebuilt application monitors, which include Active Directory, IIS, Exchange 2007 WMI Counters, SQL Server 2005 Database, and more. Alternatively, you can choose to import user-created application monitors from THWACK®, the vast SolarWinds online community. Lastly, you can opt to build your own application monitor by browsing WMI counters and selecting which you would like to monitor.
With the built-in WMI browser, creating your own application monitor is simple. You can browse WMI counters on the server, selecting up to 20 counters to monitor. You can filter these counters in a few ways—for example, you might want to view only formatted performance counters.
There are a huge number of counters to choose from, including thread count, virtual bytes, working set, working set peak, page faults per second, page file bytes, page file bytes peak, percent privileged time, percent processor time, and percent user time. Once you have selected the counters you want to monitor, press Start and the WMI Monitor will begin collecting data. Although this simple process requires minimal training, SolarWinds offers video walkthroughs to help you get set up.
The WMI Monitor display is basic and easy to use and shows you the values associated with the counters you chose. This makes keeping an eye on any changes practically effortless. Moreover, you can easily modify the counters you chose by clicking on the settings icon. From this page, you can browse WMI counters, import from THWACK, change the names of your monitoring counters, and establish warning and error thresholds to keep you informed. If a threshold is reached, the counter icon will change color to indicate this. For instance, if you set the thread count critical threshold to the value of 1,000, the icon would go red if the thread count ever exceeded this number.
SolarWinds WMI Monitor lets you choose from preselected or saved lists of monitors and load them directly into the monitoring system. If you choose to import monitors from THWACK, you will be accessing application templates created by other users and by the SolarWinds product management team. You can also export your own applications to THWACK, so other users can access them.
WMI Monitor offers monitoring for one server and lacks many of the advanced features included with SAM—like advanced alerting, availability and inventory reports, and availability for more than 200 applications. However, if you’re looking for the best of the free WMI tools on the market today, then SolarWinds WMI Monitor comes highly recommended. Get a free download here.
Paessler PRTG Network Monitor is an all-in-one tool for monitoring every imaginable component of applications, networks, and servers across your entire IT environment. PRTG is a sensor-based monitoring tool, and you choose which sensors you want to include. This means PRTG is entirely what you make of it.
If you want a network monitor, activate the numerous network monitoring sensors. Or if you want a server monitor, activate the server monitoring sensors. With hundreds of PRTG sensors to choose from, you couldn’t ask for more flexibility or comprehensiveness. Depending on the plan you choose, you’ll never have to pay for a sensor you don’t need or a functionality you won’t use.
PRTG features multiple WMI monitoring sensors, so you can create your own WMI monitor. If you aren’t interested in any other IT solutions, then don’t activate the other sensors. The first 100 sensors are free, which means you could potentially reap the benefits of a premium WMI monitor at no cost.
PRTG sensors are basic monitoring elements, with one sensor monitoring one specific measured value in your network, server, or application. This could, for example, be the traffic of a switch port, disk drive free space, or server CPU load. The WMI monitoring sensors include a Windows System Uptime sensor, Windows CPU Load sensor, WMI File sensor, WMI Free Disk Space sensor, WMI Microsoft SQL Server 2016 sensor, Windows Network Card sensor, WMI SharePoint Process sensor, Windows Security Center sensor, Performance Counter sensor, and WMI Custom sensor.
The WMI Custom sensor allows you to create your own WMI sensor with a customized WQL query, which is an impressive capability. Together, these ten predefined WMI monitoring sensors form a versatile WMI monitor.
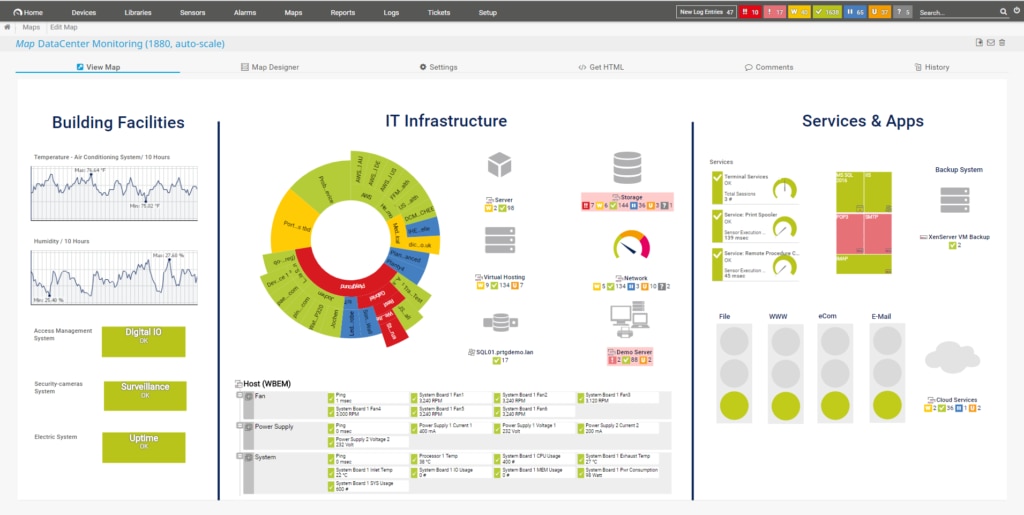
PRTG is compatible with many mobile devices, including Android and iOS, and tablets and smart watches. This means you can access your dashboard and implement key tasks while you’re away from your desk.
With PRTG, you can stay informed about all your workstations, servers, and virtual environments. The program gives you access to multiple protocols, including NetFlow, WMI, SNMP, and packet sniffing. The built-in notification system is easy to configure and highly effective. It alerts you immediately if a predefined threshold has been breached, and it can be configured to prevent floods of unnecessary or irrelevant notifications, so when you receive an alert, you know it’s worthy of your attention.
PRTG boasts more than 200 standard sensors, many of which are automatically implemented and activated during setup. This includes several WMI sensors, so getting started is quick and simple. The user interface, though basic, is another added benefit of PRTG. It’s clean, uncluttered, and easy to navigate, with visual representations of data to make at-a-glance interpretation possible.
The only drawback of PRTG is once you exceed the free 100 sensors—which is likely if you have a medium to large network—the program rapidly loses value for money. The pricing model means once you hit a certain number of sensors, you have to adopt the more expensive edition. If you do not need access to all the additional sensors, then the program’s value decreases. A 30-day free trial of PRTG Unlimited is available.
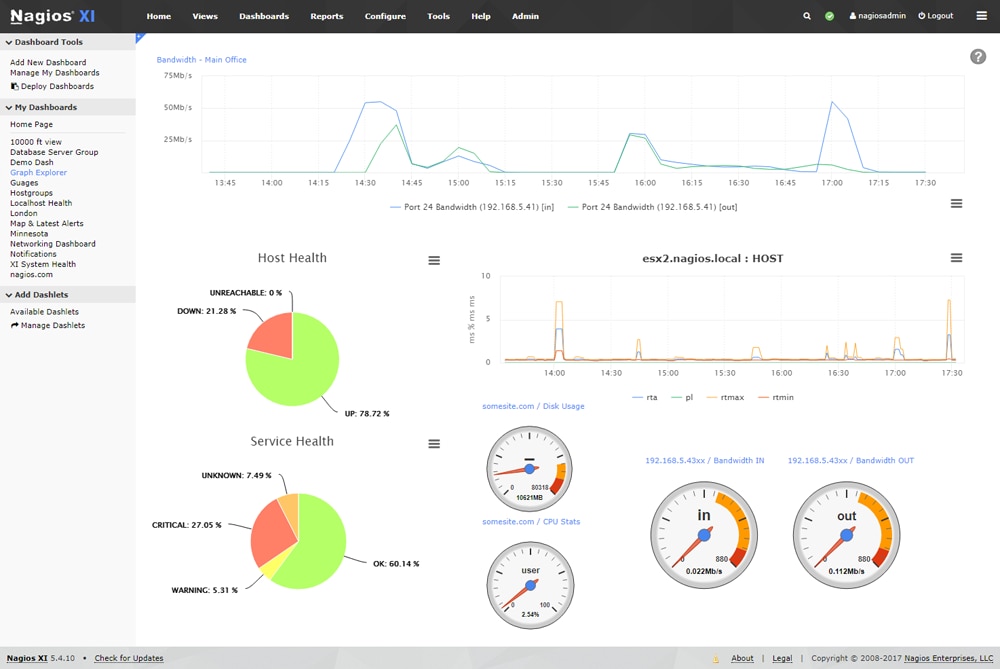
Nagios is a well-known name among IT professionals. This monitoring platform has been in widespread use for many years, and it isn’t hard to see why. Nagios Core is a free, open-source network monitoring tool offering a surprisingly advanced approach to monitoring. Nagios XI is the commercial, paid version of Nagios Core.
Both Nagios Core and Nagios XI can be extended through free add-ons, accessible via the highly active Nagios community, and both use WMI to collect data for administrators. Multiple WMI-related plugins are available within the Nagios community, which can be used to enhance the Nagios WMI monitoring experience.
Because WMI is an agentless system, monitoring programs don’t need to deploy their own client components on every single piece of monitored equipment. The WMI notifications are actively generated, so all you need is a central manager capable of collecting those notifications. Nagios features an integrated central manager in a simple but effective approach to WMI monitoring. There are no frills to this tool—it simply compensates for the issues associated with WMI by providing an efficient and functional management component.
WMI monitoring with Nagios allows you to monitor a wide range of metrics, including process state, availability, service state, performance, system usage, and much more. It can rapidly detect application and service failures, while keeping you informed with real-time alerts, so you can act as quickly as possible. Moreover, Nagios supports permission-based access to make your systems more secure and allows for remote WMI access to afford you added flexibility.
This WMI monitoring software uses multiple APIs to facilitate simple integration with third-party and in-house applications. With thousands of community-created add-ons to choose from, the architecture is fully extendable. You can even use the custom interface and add-on developments to tailor the program to your business’s specific needs.
Nagios can be run on Linux and Windows. If you’re wondering if gathering WMI data is possible on a Linux device, the Nagios system reaches out across the network to explore data on every connected device. This includes gathering WMI information.
Although both versions of Nagios use WMI to gather data, Nagios XI is more feature-rich than Nagios Core. It’s also easier to install and set up, and offers a more premium, enterprise-grade experience. Although it uses the same engine as Nagios Core, which is powerful, it also benefits from a customizable GUI.
Though powerful, sophisticated, and suitable for business use, Nagios XI has an initial learning curve, and it takes time to get used to interacting with the user interface. A 60-day free trial of Nagios XI is available.
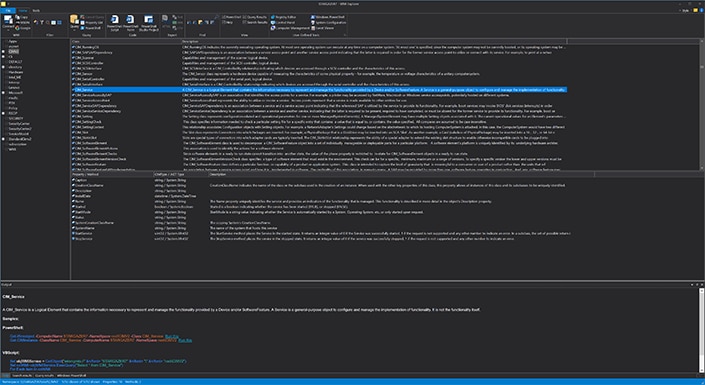
Sapien is one of the few software providers to produce a full WMI management and monitoring tool in the form of its WMI Explorer. Because this tool focuses solely on WMI monitoring and notifications, it offers an especially in-depth and detailed approach. Sapien thinks of WMI as a “vast universe” in need of exploring, and WMI Explorer does just that.
This tool provides superior performance by using multi-threaded code and cached data to generate rapid results. WMI Explorer allows you to query and explore both remote and local machines, offering a vast range of search options for gaining access to the data you need as efficiently as possible.
WMI Explorer is a no-nonsense Windows WMI monitoring tool and aims to eradicate time and resource wastage. One of the ways it does this is with clever filtering capabilities, which help you flush out irrelevant information, reduce noise, and focus on what’s important. Custom filters also allow you to adapt the way you view results to suit your specific preferences.
WMI Explorer gives you the option of using custom or preset queries to help you examine the properties, methods, and classes of data, in addition to underlying data. Furthermore, you can access and view all the documentation for any WMI object at any given time. This instant visibility and availability can be invaluable in critical situations.
WMI queries often yield a significant amount of information that may need to be processed by other specialist tools or programs. As such, WMI Explorer lets you export your query results in a few formats, including plain text, CSV, XML, and HTML. Although this is a simple functionality, it’s useful.
In fact, WMI Explorer has a clear talent for implementing simple functions that reap substantial rewards. The search capabilities are another example, letting you either search everything or limit the search to the areas you need. You can search any namespace or class, or the whole database.
WMI Explorer can generate sample code for VBScript and PowerShell, including calls to WMI methods. You can use the local cache to browse remote machines, even when they aren’t connected. These highly advanced utilities are suited to business use and are well-liked by IT professionals who really want to sink their teeth into WMI monitoring.
Unfortunately, Sapien WMI Explorer is not especially user-friendly. This tool is best suited to WMI monitoring experts, which means it’s likely to be challenging for less-experienced IT professionals. There is a 45-day free trial, accessible via instant download.
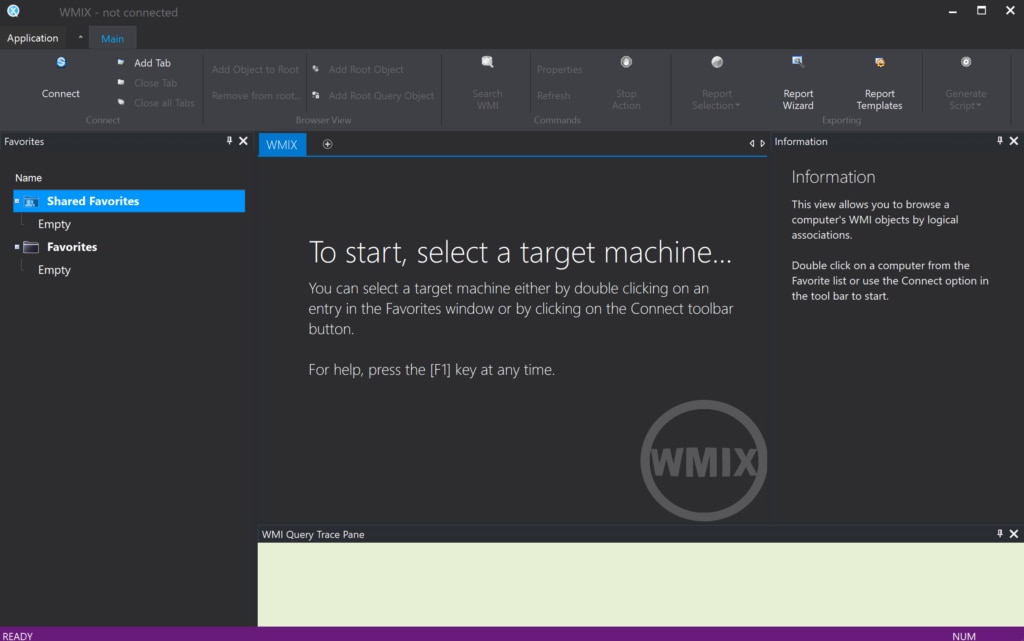
Goverlan WMIX is another free WMI application monitoring tool. This Windows WMI monitoring program was designed to be accessible to beginners and IT professionals with little experience in WMI monitoring, which means it’s easy to use. Goverlan WMIX makes this list because, though it’s free, it’s surprisingly generous with its capabilities. It allows you to generate WMI scripts and carry out sophisticated WMI-based system administration reports and tasks.
With WMIX, you can explore the WMI technology and environment via a simple user interface, which doesn’t require you to have any coding skills or existing understanding of WMI. By using the GUI, you can automatically generate VBScript and PowerShell scripts, allowing you to define a report or action. WMIX will then generate the script for you, saving you time and labor.
The WMI Query Wizard is a welcome addition to this program. It assists you in creating a WMI GPO filter, so you can generate WQL queries, and gives clear instructions, keeping you from feeling out of your depth. WMIX also helps you keep your IT infrastructure clear of third-party vendor agents by allowing you to perform agentless remote systems administration.
WMIX poses a great way to learn WMI monitoring. This is because the tool represents the elements of a WMI Query Language search in the form of a GUI front end. As elements are selected from each panel, you will see the WMI Query Language assembling at the bottom of your screen, helping you become increasingly familiar with it.
WMI queries are typically managed via VBScript or PowerShell. However, WMIX packages your WMI Query Language statements in script, so you don’t need to learn the command language for PowerShell and VBScript. Fortunately, if you want to write your own scripts, you can use the WMIX interface to assemble WMI Query Language queries, which can then be extracted and included in your scripts.
This very functional script and query generator is especially useful for those who want to learn more about WMI monitoring. It’s suitable for small systems and home use.
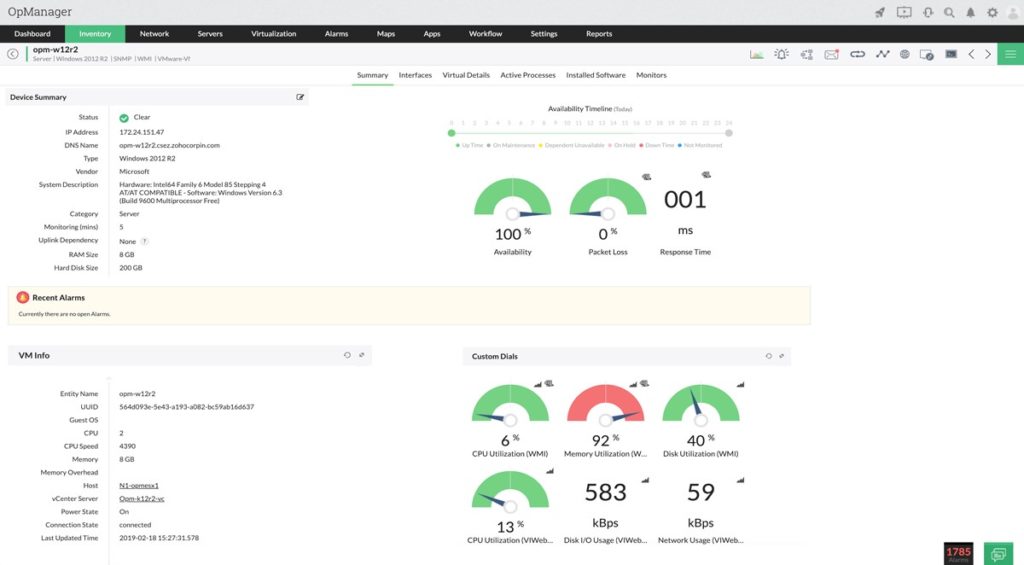
OpManager is a popular Windows WMI monitoring program by a dependable provider. Almost all IT professionals will be familiar with ManageEngine, which produces a range of desktop, active directory, network and server, application, and IT security management solutions. OpManager is among the provider’s most well-known products, and with good reason.
OpManager uses both WMI and SNMP monitoring protocols to deliver a versatile device and interface monitoring solution. To use OpManager to monitor via the WMI protocol, it must be installed on a Windows server. The device to be monitored must also have WMI, DCOM, and RPC services enabled.
This tool benefits from multi-vendor support, so it can monitor critical Microsoft applications and servers alongside their processes and services. Windows servers are monitored on a continuous basis via WMI to certify they continue to perform at an optimum level. All data collected by OpManager is stored, which facilitates troubleshooting and historical performance tracking, so you don’t have to invest in numerous server monitoring programs.
With OpManager’s WMI monitoring capabilities, you can execute agentless Windows service monitoring. This allows you to monitor all critical Windows services and perform key actions like rebooting and restarting servers automatically across remote locations.
OpManager is also an effective Windows event logs monitor. It uses the WMI protocol to collect event logs from all your monitored devices. Fifty out-of-the-box event log monitors are available within the console, so you don’t have to integrate this solution with a separate event logging tool.
The reason OpManager doesn’t rank higher on this list is because it has less of a WMI monitoring focus than many of the other tools. You can schedule a demo here.
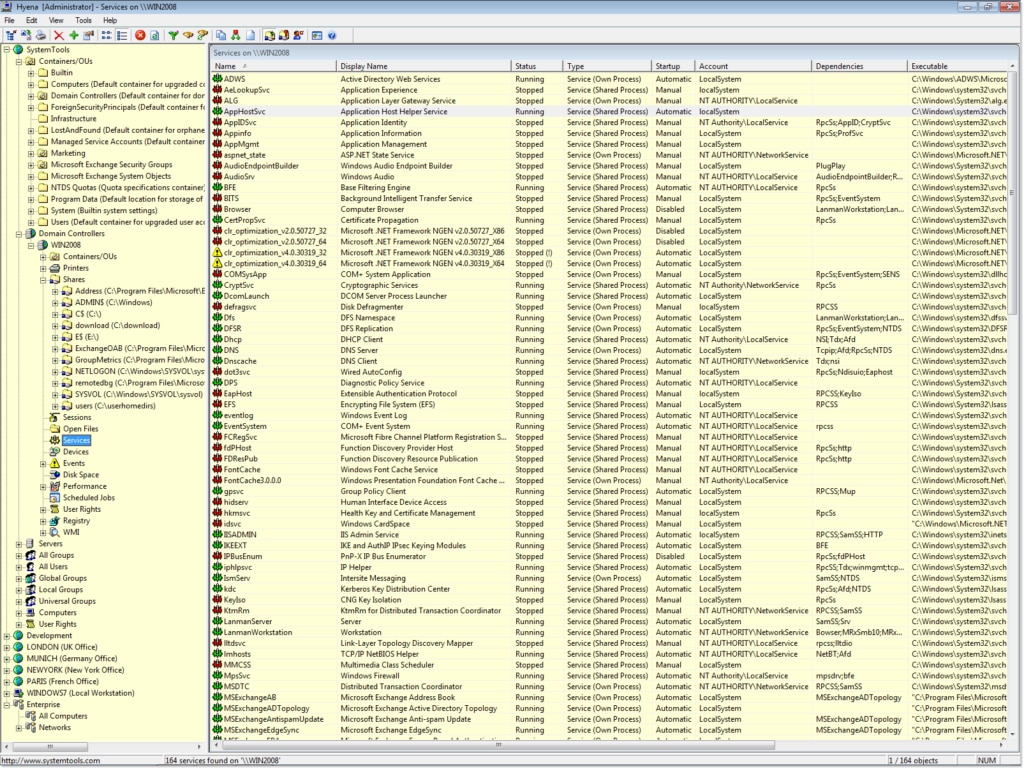
Hyena was developed to harness the true flexibility and power of WMI. Although Microsoft had published multiple WMI VBScript-based scripts and tools, the developers recognized these only captured a fraction of WMI’s full potential. According to the provider, SystemTools, there are drawbacks to Microsoft’s WMI scripting functionalities, like the necessity of knowledge of WMI property names and classes, in addition to an understanding of the scripting language itself.
Hyena differs from most WMI reporting tools, leveraging WMI by allowing queries to be run on multiple devices via its GUI interface. WMI operations can be performed on the resulting output, which facilitates the easy updating of data on multiple devices simultaneously. Most importantly, you won’t need to do any scripting, so no prior knowledge or experience is necessary.
Hyena delivers a comprehensive WMI reporting solution, with an impressive range of functionalities. For example, it features predefined WMI queries, so you can start using WMI right away with access to the most common WMI reports and classes. You can also create your own WMI queries with the tool’s simple, graphical query builder.
Speed is a real benefit of this program—it lets you execute any WMI query on multiple computers, or just one, in a matter of seconds. Moreover, you can rapidly export WMI query results to Microsoft Access or Excel, and you can filter and sort the results from within the Hyena GUI.
The Hyena WMI integration isn’t limited to executing queries and viewing results. You can also execute functions, referred to as “methods,” on the results. You can terminate processes, execute remote processes, manage event logs, alter IP addresses, force DHCP lease renewals, uninstall applications, shut down the computer, reboot the computer, control services like startup, and much more. Lastly, Hyena supports complete logging of WMI method execution and WMI querying.
You can access a 30-day free trial here.
Choosing the Right Windows WMI Monitoring Software
If you want to make the most of Windows Management Instrumentation, implementing the right WMI monitoring solution is fundamental. The market for IT software solutions is becoming increasingly saturated, and there are hundreds of WMI tools claiming to be the best. In this guide I’ve outlined WMI monitoring, what it can do for you, and how WMI tools can help you take full advantage of it. I’ve also ranked the best WMI tools available today, with consideration of a range of factors, including user-friendliness and capability sophistication.
Overall, SolarWinds Server & Application Monitor ranks highest. This tool was designed by a dependable company with a track record of delivering high-end, enterprise-grade tools, and is suitable for growing organizations, no matter how small they start out. If you foresee and are aiming for growth in the future of your business, then choosing a tool capable of growing with you is extremely important. Because it’s built on the Orion Platform architecture, SAM’s WMI monitoring capabilities are highly scalable and can be easily extended with other SolarWinds solutions and technologies.
SAM is an excellent choice of WMI monitoring software and serves as a WMI reporting tool, with advanced WMI application monitoring and server monitoring utilities. No training or experience is required to get started, and if you ever need assistance, SolarWinds has support technicians available 24/7. SAM is backed by a vast community of loyal SolarWinds users, so you can connect through forums and learn from their experience.
If you want to give SAM a try, I recommend downloading the fully functioning 30-day free trial. If you have your heart set on a free tool, then WMI Monitor is a viable alternative, although it’s worth noting free tools are rarely ideal for business use.