
In server and application monitoring, response time is one of the most critical attributes to track because it tends to have the biggest effect on end users. If a server response time is slow, then so are the applications or websites, regardless of how well-tuned your other resources are. It’s important to use ongoing server and application response time monitoring tools to ensure apps can function, and your end users aren’t struggling.
In this blog, I’ll go over what response time is, how to measure it, and what tools you can use to improve it. Or, if you’d like to skip ahead to choosing software to automate the response time monitoring process, I suggest looking at SolarWinds® Server & Application Monitor.
What Is Server and Application Response Time?
How to Check and Measure Response Time
How To Improve Server Response Time
Best Response Time Monitoring Tool
What Is Server and Application Response Time?
Server and application response time refers to the amount of time it takes an application or a server to return the results of a submitted request to an end user. Most often, response time is affected by factors like network bandwidth, the volume of users and requests submitted, and average think time.
For web servers specifically, response time can best be understood as the amount of time it takes for a server to load the HTML doc of a website, so a client can render a page. If you have poor server response time, it takes longer for the HTML doc to load properly. When this happens, the browser won’t know what other resources might be required to display the page properly, which can delay the process even further.
As for servers, application response time can reveal a lot about underlying (and end-user) functionality. With application response monitoring, admins can more quickly identify when poor performance is occurring or could potentially occur, allowing them to more easily remedy the situation. Applications can be affected by various network components and processes, like heavy user traffic or queries from misconfigured databases.
How to Check and Measure Response Time
To measure server response time, you can use a few potential metrics. Most often, admins measure server response time with a term called Time to First Byte (TTFB), which represents the time it takes in milliseconds for a browser to receive the first byte of the response from a server. With knowledge of this measurement, admins can better check server response time and understand when and why a server might be running slowly.
In addition, application response times can be measured by tracking the time it takes for a server to respond to a request from a client application. TTFB measurements apply in this case but measuring application response time might also require monitoring network elements like TCP application ports or other database resources.
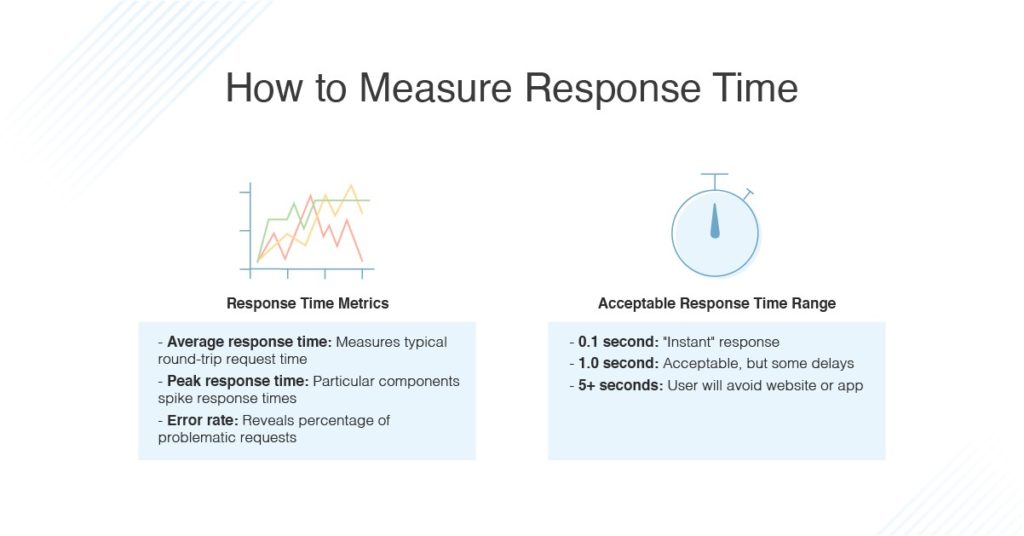
When considering response time—especially in the context of user experience and overall performance—it can be useful to refer to a few different measurements, including:
- Average response time is essentially the average round-trip request time (as for loading HTML, JavaScript files, or images). Slow system components lower this average.
- Peak response time can help you understand which components, queries, or requests may be dragging down response times.
- Error rate shows you how many requests are problematic when compared with all occurring requests (within a certain time frame).
A response time of about 0.1 seconds offers users an “instant” response, with no interruption. A one-second response time is generally the maximum acceptable limit, as users still likely won’t notice a delay. Anything more than one second is problematic, and with a delay of around five or six seconds a user will typically leave the website or application entirely. It’s crucial for your troubleshooting to help you head off a situation where functionality enters this red zone.
Analyzing response time can be extremely painstaking and difficult without the right tools, and with the proliferation of both quick and simple open-source tools and more comprehensive monitoring software, there isn’t a reason not to use an automated program. With basic tools, you need to know what metrics you’re looking for and what they mean to piece together a useful view of your servers and applications. However, a professional tool should be able to offer you real-time, continuous insights into response time across your environment, allowing you to respond more quickly to any issues.
How To Improve Server Response Time
Once you begin checking and monitoring your server and application response times, you’ll be able to more effectively improve server response time. Here are a few best practices to implement.
- Improve database performance. There are many ways to optimize your database performance, and all of them can have a big impact on critical applications and servers. Rewriting queries, changing your schema to group objects to be more effective, and taking the time to ensure you’re using your database correctly are good first steps.
- Optimize web servers. As with databases, optimizing your web servers can be a big undertaking, and it might require buying some automated tools to help. But if you want to improve response time, the costs are worth it.
- Know what to monitor. If you want to improve server and application response time, you should regularly check attributes like CPU load usage, storage resources, and memory. Even virtual machines need to be checked for resource allocation and hardware malfunctions, since these elements can have negative impacts on response time.
- Update hardware. Unfortunately, slow response time isn’t always about optimizing your system—sometimes the problem is maxed-out, over-virtualized, or out-of-date hardware. If metrics like CPU or memory are always problematic, it could be time to rethink your hardware resources.
Best Response Time Monitoring Tool
If you want to monitor server response time and application response time to improve overall performance, you can’t expect to do it manually. You have to look out for many different elements—various operating systems, browsers, connection speeds, different devices and locations, and more. A small complication in one of these isolated elements could cause your servers and applications to underperform. Although local testing can be effective in some capacities, it’s wise for admins to look to response time monitoring tools for help.
That’s where SolarWinds Server & Application Monitor (SAM) comes in. This tool offers IT teams an in-depth look into the health and performance of both physical and virtual servers, plus a wide range of critical applications. It comes with off-the-shelf support for over 200 applications and gives admins the power to create custom monitors to support any server. Easy to roll out, SAM allows you to monitor server response time within a matter of minutes.
Although many tools let you check metrics for basic server components like CPU, memory, disk space, and availability, SAM offers more. With SAM, IT teams can gain real-time, detailed statistics on critical server performance attributes, all of which come with granular timestamp details. This offers quick insight into current (and historical) response times. Plus, built-in alerts assure you’ll never miss an issue. Overall, SAM makes it easier to catch issues and analyze root causes, so you can proactively keep your server performing above expectations.
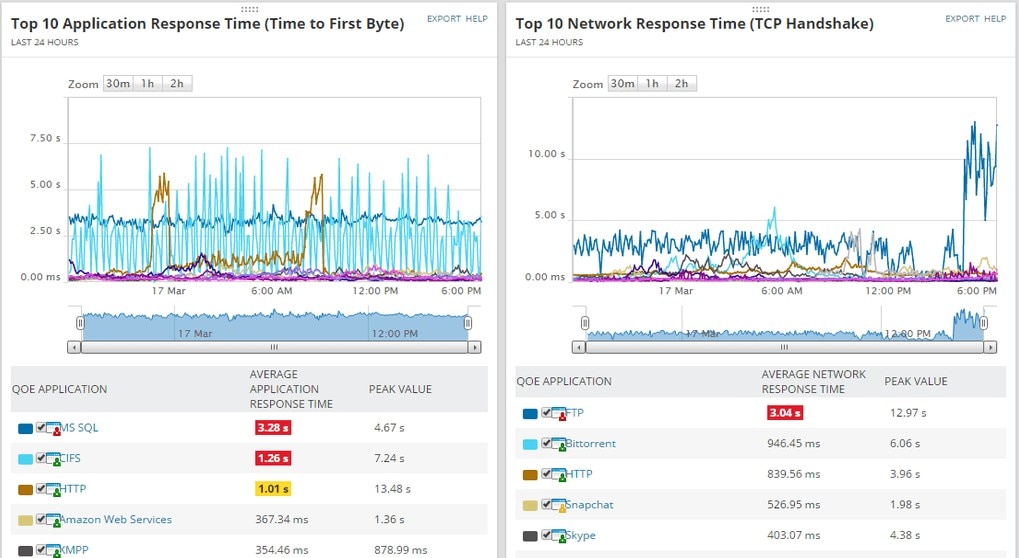
In addition, SAM comes with a built-in Quality of Experience dashboard designed to help IT pros understand network traffic from the perspective of someone using an application. With this ability, you can easily view network response time elements like TCP handshakes or TTFB, right from the SAM dashboard.
SAM can be paired with another SolarWinds tool—Database Performance Analyzer—for even more details about server and application response time issues. With this added support, you can ensure your database performance doesn’t affect the health or speed of critical applications and servers.