Redis is an open-source, non-relational database, and like any database, it must be constantly monitored to ensure optimal performance. Redis monitoring tools can help you analyze the information Redis collects and gather statistics on crucial Redis metrics. One of the most important features Redis monitoring offers is Redis memory analysis, which can help you understand how Redis is being used throughout your network.
Investing in a Redis memory monitoring tool is essential, but it can be difficult to choose one. In this article I’ve listed my top five Redis monitoring best tools, starting with SolarWinds® Database Performance Monitor (DPM). I discovered DPM can enable the collection of Redis memory metrics along with general data on infrastructure’s performance, and is designed to offer dashboards that recommend best practices for Redis monitoring.
Check out the details of the DPM software from SolarWinds if you like:
- Convenient, granular charts and dashboards showing the status of Redis databases.
- The ability to analyze the most important metrics for Redis databases to help optimize and improve their performance.
- Measure performance of databases and applications working with them.
- Quickly check the most important metrics, find errors and tips on how to solve specific problems with your Redis databases.
It’s easy to install and set up, and you can download a 14-day free trial of DPM today.

What Is Redis Memory Monitoring?
Redis memory analysis or monitoring is the act of observing, managing, and maintaining Redis. These tools can give insight into Redis memory metrics while also collecting and displaying crucial health and performance statistics.
Redis (Remote Dictionary Server) is an open-source, in-memory database that can be used as a cache, a message broker, or simply as a server. All Redis data is stored in RAM, allowing it to function at incredibly high speeds. Redis also has persistence, which means data is stored in a stable location. This helps future requests be fulfilled efficiently and ensures your data will remain after a system reboot.
Redis provides data structures in certain forms outlined below, all based upon the simple “string.” Unless otherwise specified, strings are non-repeating in these organizations.
- Strings: Sequence of characters
- List of strings: Ordered strings, sorted by insertion time
- Sets: Unordered strings (not sorted)
- Sorted sets: Ordered strings, sorted by user defined score
- Hashes: Maps matching string names to string values
- HyperLogLogs: Logs items to prevent errors when estimating unique items in a set
Redis Memory Metrics
Use the Redis INFO command button found through the command line interface (red-cli) to access Redis memory metrics. This ensures your Redis memory analysis uses accurate, up-to-date memory statistics. Nine other sections make up the INFO command output besides memory: server, clients, persistence, stats, replication, CPU, commandstats, cluster, and keyspace. INFO command output doesn’t offer latency metrics.
Here are three main commands you can use to discover memory metrics while Redis memory monitoring:
● used_memory
This utilization metric shows you the amount of memory Redis has used in bytes.
● mem_fragmentation_ratio
Use this command to find the ratio of memory allocated by OS by memory requested by Redis. This is a saturation metric, which displays memory allocated for user-defined data and internal overhead.
● evicted_keys
This is also a saturation metric and will display the number of keys removed due to a max-out on memory limit. You can choose between data removal from Least Recently Used key (LCU eviction policy) or key closest to expiration (TLL eviction policy).
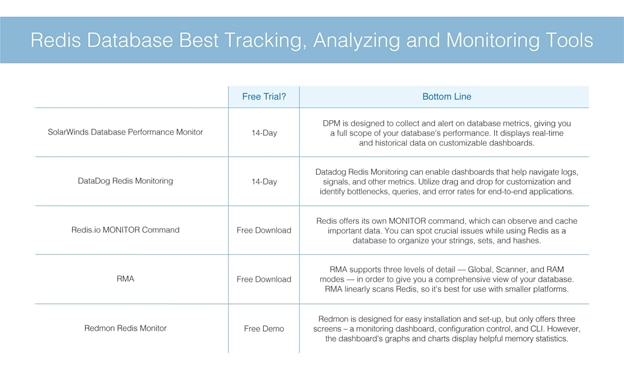
Redis Monitoring Best Tools
1. SolarWinds Database Performance Monitor
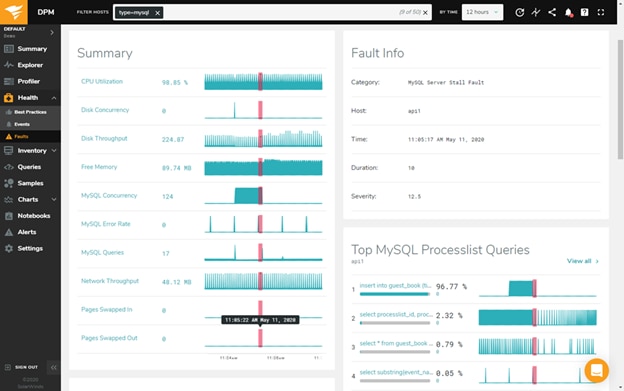
SolarWinds Database Performance Monitor (DPM) is designed to collect Redis memory metrics as well as thousands of other database, query, and general infrastructure performance metrics. This critical information, such as before-and-after analyses and outlier details, is displayed on intuitive dashboards. I found it easy to customize and export dashboards. The instant best practices recommendations also drew my attention. DPM enables you to pinpoint performance issues using historical and real-time data, so you can easily keep track of trends over time.
DPM can allow you to monitor Redis databases locally, on the cloud, or using a hybrid of the two. Agents gather information and push it to the DPM cloud API, where the data is then transformed. This data can help you attain KPI goals for availability, frequency, deploys, lead time for changes, and MTTD plus MTR.
Since SolarWinds DPM is a SaaS platform, it’s easy to install and begin Redis memory monitoring. You can download a 14-day free trial of DPM on their official site.
1. Datadog Redis Monitoring
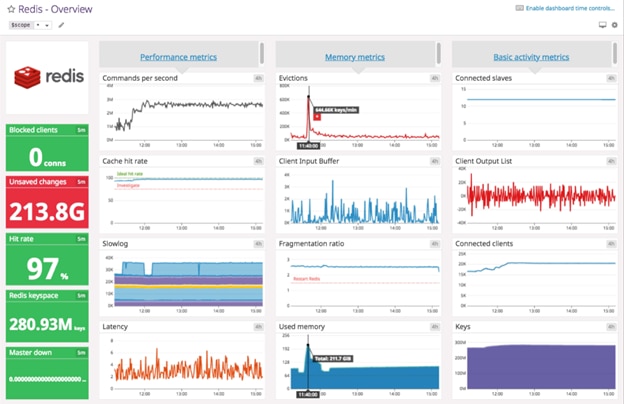
Datadog Redis Monitoring is designed to collect Redis memory metrics to let you view performance, throughput, and Redis memory analysis. This enables you to identify bottlenecks and slow running queries and discover error rates for end-to-end applications. You could stack traces and latency breakdowns with Datadog Redis Monitoring.
Like DPM, Datadog Redis Monitoring is designed to generate dashboards to help you navigate logs, security signals, and other key metrics. You can customize these dashboards with a drag-and-drop system. The Datadog Watchdog tool detects outlier situations while accounting for specified fluctuations, such as seasonal changes or updates, and creates alarms from related data. I found the customization options especially useful. Enterprise versions of Datadog cost $23 monthly per host. There’s a 14-day free trial of Datadog Redis Monitoring available for download.
2. Redis.io MONITOR Command
Redis.io is the original Redis database and includes a debugging command called MONITOR designed to stream back commands processed by the Redis server. Using Redis as a database as well as a monitoring and caching system can help you spot issues in an application as you organize your database’s strings, sets, and hashes.
By discovering bugs in your Redis database, you can quickly detect and diagnose performance issues and improve throughput. However, for security purposes, the administrative commands AUTH, EXECT, HELLO, AND QUIT are not logged while using the MONITOR command. Download the Redis database option of your choice here.
3. Redis Memory Analyzer
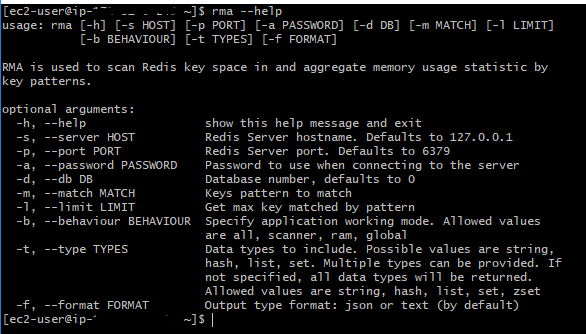
RMA is quite comprehensive for a free Redis memory monitor, and supports three levels of detail: Global, Scanner, and RAM modes.
Global Mode offers an overview of memory usage information, providing statistics for system memory, resident set size, and key space size plus number of keys. Scanner Mode gives an overview of key space, displaying namespaces alongside types of items plus percentages of memory consumed. RAM Mode focuses on key space-level memory consumption, specific details of memory usage, and actual data size, and pinpoints large memory-hoggers.
RMA monitors crucial data in real time but doesn’t support probabilistic sampling. RMA linearly scans Redis, which can be a time-consuming process for larger networks. For this reason, I suggest RMA for smaller platforms. Instructions for installation can be found here.
4. Redmon Redis Monitoring
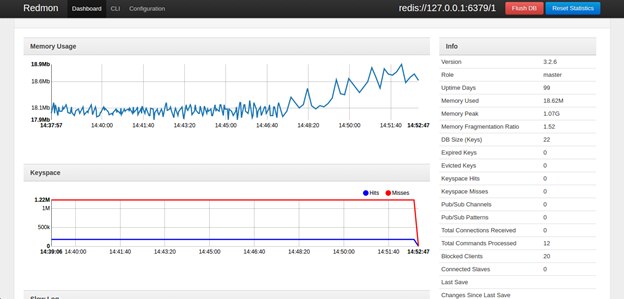
Redmon Redis Monitoring is programmed in Sinatra, a DSL designed to quickly create web applications with Ruby. Redmon is simple to install and starts with the single command “gem install redmon.” It’s also a simple platform, and only contains three screens—a monitoring dashboard, configuration control, and CLI. However, the Redmon dashboard is extensive and enables the creation of many visualizations.
These graphs and charts display lots of helpful memory statistics like usage, uptime days, and keyspace misses. You can access real-time views of Redis traffic, requisitions, and line operations. There is also dynamic server configuration, so you can interact using a familiar CLI interface.
Redmon is by no means a complete Redis monitoring tool but gathers data useful for understanding your database’s performance. Get instructions for downloading a demo onto your Redis database here.

Final Remarks on Redis Monitoring Tools
Redis memory monitoring is a very important aspect to observing and maintaining your Redis database and helps ensure your network continues to function at optimal performance. SolarWinds Database Performance Monitor (DPM) is my personal top Redis monitoring tool, enabling the generation of clear and helpful dashboards to display Redis memory metrics plus other Redis and non-Redis statistics. Monitor Redis in the cloud, on-premises, or in a hybrid model using DPM, and compare before-and-after Redis memory analysis over time. Download a DPM 14-day free trial t