
There are few things more important in your IT infrastructure than database performance. DB performance metrics can be easily tracked, and there’s no excuse for not doing so. There are several common database problems you’re likely to encounter when managing a large IT network, and solving these quickly can make a big difference in terms of preventing disruptions for your end users. As a result, it’s critical to keep tabs on database performance, meaning you must be looking at key metrics and common problems in a systematic, resilient, and structured way.
This guide will look at some of the most common database problems, key metrics for monitoring, and how to check those metrics to ensure the efficient resolution of performance issues. I highly recommend using a tool such as SolarWinds® Database Performance Analyzer (DPA) to check database performance metrics. These tools guide you in identifying database performance problems, automating large parts of the troubleshooting process, so you can focus your efforts and attention on critical issues.
Common Database Problems
Database Performance Metrics
Best Practices for Checking Database Performance Metrics
Key Takeaways for Identifying Performance Issues
Common Database Problems
Database problems are very common, and databases are typically subject to harsh performance criteria. Database administrators may face issues including the following.
Slow Read-Write Speeds
Performance slowdowns can occur due to high latency for disk read/writes. DBAs need to be able to drill down on I/O hot spots to see exactly where these latency values are highest and figure out why. Addressing this issue may require index tuning, checking the buffer pool, and other measures.
Scaling Problems
Trying to scale up a database isn’t necessarily a straightforward operation. For instance, relational databases are typically designed to run on a single server and scaling requires more complex and powerful hardware. Similarly, horizontal scaling, or “sharding,” involves splitting up your database into separate sections, which can create complexity and cause problems.
On the other hand, problems can occur if you aren’t scaling up certain aspects of your database, like storage and memory, which is known as vertical scaling.
Incorrect Virtual Machine Setup
With the increasing use of virtual machines, database hardware is now required to give everything it has, and optimization matters when dealing with virtual machine management. Large numbers of machines all relying on the same hardware leave little room for error, so if your database environment isn’t set up correctly, you can end up with major issues in your virtual machines.
Lack of Backup and Monitoring
Databases are fundamental to your entire organization’s ability to deliver services, so if one database goes down, it will likely take down some important dependencies as well. Databases need to be resilient, frequently backed up, and monitored constantly to catch issues before they take down major parts of your infrastructure.
Database Performance Metrics
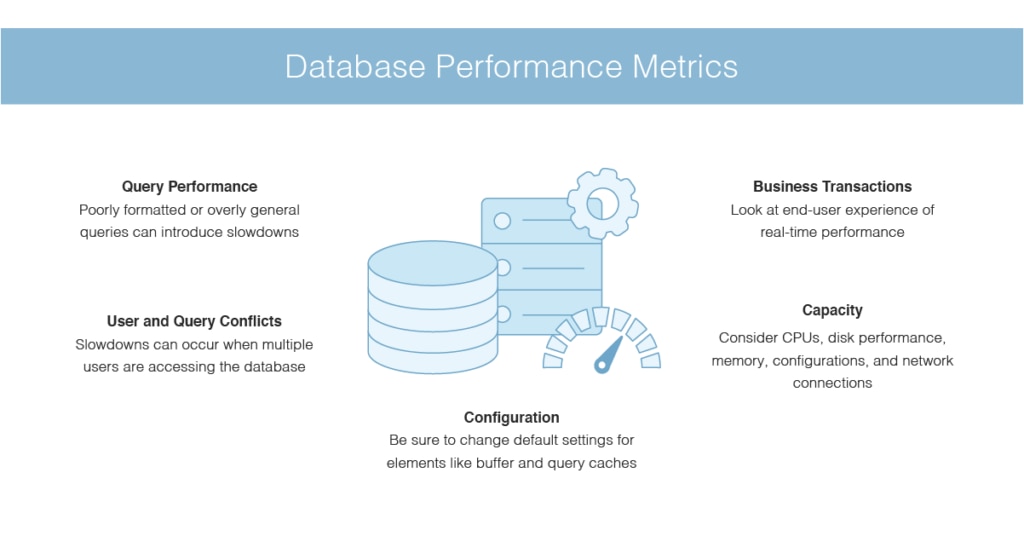
There are several metrics you should monitor to keep tabs on database health and prevent performance issues before they occur. Key metrics can be grouped into the following categories:
- Query performance
- User and query conflicts
- Configuration
- Capacity
- Business transactions
Query Performance
Query performance is one of the most important database performance metrics to monitor. Your database is accessed by queries. If these are formatted poorly or are requesting large amounts of information each time, they’re introducing slowdowns and performance problems into the fabric of the database.
For example, if you’re using the SELECT query, make sure you’re specifying the columns you want to select—don’t just use the SELECT* approach. Using SELECT* looks at the entire table, which in most cases is completely unnecessary.
In addition, ensure you’re using proper indexing to access the tables in the database. Without an index, the database needs to read through all the tables to find the information. The index serves as a reference point, enabling the database to get there faster.
User and Query Conflicts
If you have multiple users for your database, this can also cause performance issues, so you’ll want to look at how many users you have and whether there are any conflicts as a result. While someone is reading a table with a read query, the database will “lock” the table to stop it being changed while it’s being read. If you have many users accessing the database simultaneously, tables can be locked while other users are waiting to read, change, or access them. This results in slowdowns.
Slowdowns can be avoided by carefully checking how many users are accessing a database, as well as through “lock hints,” which tell the database how to lock tables in the most efficient way.
Configuration
Database configuration is an important metric to check. If you’ve left everything on the default settings, you may want to try changing some of these settings, checking the results, and then continuing to change configurations and optimize as needed.
Two of the settings you need to check are the buffer cache and the query cache. If the buffer cache is too small, data is flushed frequently and then reread from the disk, slowing things down. If the query cache is storing too much, this can lead to a performance bottleneck rather than helping to speed things up.
Capacity
It’s important to consider capacity and hardware: this includes the metrics relating to your CPUs, disk performance, memory, disk configurations, and network connections. All these network infrastructure metrics can have a huge impact on database performance.
Business Transactions
Finally, look at the most practical of metrics: your business transactions. Essentially, you want to look at the real-time performance your users experience, so you can see whether there are issues while they interact with your application or service. This includes measuring the response time of different parts of your application or network, as well as looking at the application performance and the user experience.

Best Practices for Checking Database Performance Metrics
There are several best practices you can follow for checking on your database performance metrics to prevent database problems. If you notice metrics changing rapidly or declining, you can troubleshoot these issues before they become full-blown problems. If you see a database problem occurring, you can pinpoint which aspects of the IT environment are at fault by examining metrics to look for unusual patterns.
Check Regularly
It’s essential to check your database health metrics regularly. Whether you’re checking things manually or using tools, all checks and scans should be frequent enough to both establish clear baselines and spot issues as soon as possible.
Use Tool
In general, large enterprises shouldn’t be using manual processes alone. Instead, database administrators should use tools. There are two pieces of software I recommend for checking and identifying performance issues in databases. Which is right for you will depend on whether you want an on-premises or cloud offering or a SaaS solution.
SolarWinds Database Performance Analyzer can be used both on-premises and in the cloud. SolarWinds DPA sets itself apart through its wait-based approach to performance optimization. Instead of looking at health metrics alone, it uses these metrics alongside application and end-user wait times to ensure changes and optimizations are improving the end performance. This is ultimately what you want to accomplish, and metrics alone can be less useful than a holistic approach considering the whole system and the outcome you’re trying to achieve.
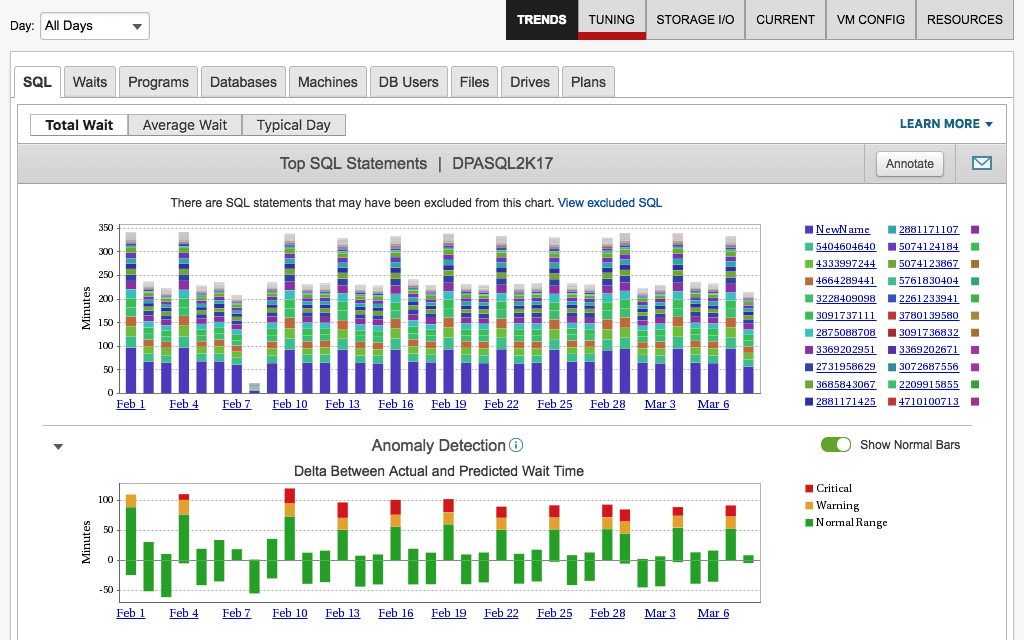
DPA works by showing you where in your database or network your longest wait times are, and periods with longer wait times than expected. This can indicate anomalies and problems you might not have spotted otherwise. When you see a performance issue in DPA, you can drill down through the interface to examine the problem in more detail and gain insight into how to fix it. Using the “Greatest Upward Wait Time Trends” graph, you can also see potential issues that may grow into major problems if not addressed.
SolarWinds DPA also includes a dashboard showing query details, such as statistics and metrics charts to correlate wait query times with other events, as well as query and table tuning advisors. This tool helps you to optimize and tune your queries to improve performance, and then check the wait-based metrics to see what impact this had. Table tuning advisors helps you ensure your tables are efficient and can flag problems and help you fix them if you’re not sure where to begin.
For general database monitoring, I would tend toward DPA. For example, it allows virtualized database monitoring for VMware, and includes machine learning anomaly detection.
There are other paid, professional solutions on the market, as well as a range of free and open-source tools. The key drawback to free solutions is they tend not to have the features, documentation, or support that would make them reliable in an enterprise environment. If you decide to seek out other professional solutions, always check on how pricing is structured; whether the tool in question is a standalone solution or uses add-ons or extensions to complete the offering; and whether it’s easy to use. You can often access free trials, which I recommend taking advantage of.
Set Up Alerts
Most database performance monitoring tools enable you to set up alerts. SolarWinds tool recommended above come with an alerts functionality. Alerts should be set up with thresholds built in, so you get the most important alerts, aggregated alerts, and alerts for unusual behavior. If you don’t set up thresholds, you can end up with floods of alerts, ultimately slowing down your efforts to fix problems. On the other hand, if your alerts aren’t configured correctly, you might miss critical issues you otherwise would have been able to quickly resolve.
Key Takeaways for Identifying Performance Issues
Database performance isn’t something you can take for granted. For all companies, particularly large enterprises, database performance monitoring is critical for ensuring service quality and application performance. Without checking on the key health metrics for your databases, your IT environment can suffer badly from performance issues that severely impact your end users.
I recommend implementing tools to automate your database performance monitoring. My top choice is SolarWinds Database Performance Analyzer. It is a high-quality tool from an established, reputable vendor. It comes with a fully functional 14-day free trial.