
Monitoring Oracle databases is a necessary part of the job for database administrators (DBAs). They also need to spend time improving performance if things slow down, or to meet the requirements of end users who expect nearly instant results. These can be time-consuming and difficult tasks without the right metrics and tools.
To improve both monitoring and tuning for slow Oracle database performance, here are some tips and key metrics to consider, including the use of a monitoring solution such as SolarWinds® Database Performance Analyzer.
- Why Is Oracle Database Performance Monitoring Important?
- How Does an Oracle Database Work?
- How Does Oracle Database Performance Tuning Work?
- Oracle Database Performance Tuning Tips
- Key Oracle Database Monitoring Metrics
- Oracle Performance Monitoring Tools
- Improve Oracle Database Slow Performance With Performance Tuning

Why Is Oracle Database Performance Monitoring Important?
Databases are everywhere; they’re responsible for running applications, creating reports with business intelligence statistics, forecasting, and more. Of those databases, Oracle’s are among the most commonly used, for a couple of reasons.
Oracle databases are optimized for enterprise-level companies with massive data sets. Additionally, they support different configurations: on-premises, cloud, and hybrid cloud environments. This enables them to work for companies with different requirements.
Businesses that choose an Oracle database application are looking for reliability in handling large volumes, as well as the flexibility to meet changing business needs. Users who rely on these databases expect them to perform well and be available on a constant or near-constant basis.
To ensure these requirements are met, service-level agreements (SLAs) or operational-level agreements (OLAs) are often put in place. These agreements define the maximum amount of time considered acceptable when running certain database queries.
Most of the time, those requirements can be met, since Oracle databases are designed for high-volume usage. The databases can still fail, though, so it’s important to regularly monitor Oracle database performance.
By keeping track of key performance indicators and possible bottlenecks, DBAs can maintain compliance with SLAs and OLAs, and prevent databases from crashing due to unexpected volume.
How Does an Oracle Database Work?
Before you can tune the performance of an Oracle database, it’s important to first understand Oracle is a relational database management system (RDBMS) with several components.
A relational database is a way of storing and accessing information with a computer. Information is consolidated and stored in the relational database until an application needs to retrieve it for a specific use. For example, a company might store the shipping address of a customer who made a purchase there. The next time the same customer makes a purchase, the address can be retrieved from the database, so the customer doesn’t need to enter it again.
The data stored in a relational database gets put into tables, also called “relations,” which are similar to spreadsheets. Each field is like a spreadsheet column, used to store different pieces of information (street address, state, zip code, etc.), and each entry is like a row.
Relational databases are created by management systems, which organize the information and manage the interactions with applications needing access to the data. The components of a database management system are as follows:
- Kernel code: Defines settings and manages the system’s storage and memory
- Data dictionary: A read-only repository with reference information, tables, and views showing the data stored within the database
- Query language: What allows applications to access information in the database
Oracle uses Structured Query Language (SQL) for the database language. SQL supports:
- Adding, updating, retrieving, and deleting data from the database
- Assigning and revoking user access, which is done by administrators
- Creating individual views and functions
SQL is also an easy language to learn, and SQL queries can be embedded in other languages, making it a useful tool.
How Does Oracle Database Performance Tuning Work?
Tuning Oracle database performance isn’t always straightforward. If a user reports a page is loading slowly, or an application has delays, it’s not necessarily clear where the problem originates. It could be a problem with the client machine, the way the SQL statement is coded, an issue with the application server, or something else.
DBAs trying to improve performance need to consider all the elements in the RDBMS when seeking out the root cause of the problem. This is often a time-intensive task, since it involves looking at all levels of the RDBMS components. This includes reviewing the following:
- Client machine: Sometimes, slow page loads stem from page bloat when the client machine tries to process unnecessary rich UI components.
- Issues between client machine and application server: When the poor performance happens during the transmission of information, this could be caused by bottlenecks within the network or by sending too much information at one time.
- Application server: The app server itself may be the bottleneck, in which case the code needs to be examined for ways to improve performance.
All these areas need to be reviewed to improve performance and meet user expectations.
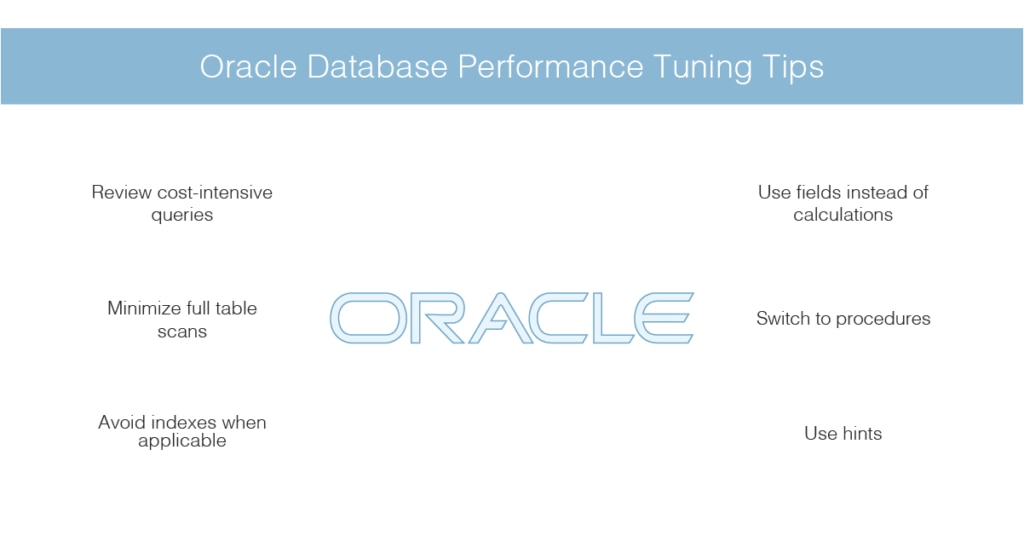
Oracle Database Performance Tuning Tips
After doing basic system-level checks for performance issues, the next step for DBAs is to tune the SQL queries. Here are some tips to help you make the most of this part of the process.
Review Cost-Intensive Queries
The best place to start when optimizing SQL queries is with the high-impact statements. These get executed regularly and require significant input/output (I/O) and database activity. Tuning these statements will give you the biggest immediate performance improvements.
It’s also important to remember this type of tuning is ongoing, which means you may return to high-impact code more than once before it’s fully optimized.
Minimize Full Table Scans
Using an SQL statement that requires a full table scan requires significant I/O and can impact performance due to unnecessary broad scans. Here are some ways to improve data retrieval:
- For larger tables, where you need to access 5% or less of the data, add an index to the table. For smaller tables, it’s still faster to search the whole table even if you don’t need much data.
- Avoid using the * symbol in SELECT statements unless you need to return all the information.
- Restrict the data set by using WHERE clauses in filters.
- Use the EXISTS command to let Oracle know it can stop a search when it finds a match, instead of completing the full table scan.
Avoid Indexes When Applicable
For tables with several UPDATE or INSERT operations, it’s best to avoid using indexes, since they reduce the speed of data input. Additionally, for insertions or batch updates, dropping indexes could be helpful. Instead, after each batch event, you could re-create indexes, or simply avoid using them if the table has frequent batch data loads.
Use Fields Instead of Calculations
When using a JOIN or WHERE clause, you might also perform a calculation to get certain information. If this impacts performance, though, you can create a new field to store the calculated value, and then use your statement to select the value rather than calculating it.
Switch to Procedures
If you run a certain query regularly, it might be better to turn the individual statements into a procedure. Procedures are a group of statements, and they have a lower cost to the system than executing a recurring query.
Use Hints
Hints provide a way for DBAs and developers to take over from the optimizer to improve the performance of their SQL statements.
This is important because in some cases, the people working on the code have insight into the data the optimizer doesn’t, and this knowledge allows the developers to direct execution plans to speed up processing. Oracle even provides a list of hints to help with this process.
Key Oracle Database Monitoring Metrics
Tuning SQL statements and updated client machines for performance is important, but it’s not enough to do this once. Network and client activities change all the time, which is why it’s important to monitor Oracle database performance metrics.
By monitoring key metrics, DBAs can keep track of changes and tune the performance as they go instead of waiting until the issues impact their business. Here are some of the top metrics to monitor.
In Memory Sort Ratio
This ratio tells you how many sorts are performed in memory versus on disk. With a slow database, this is important to consider: disk sorts need to be done in the tablespace, which is considerably slower than sorts performed in RAM.
Underallocated RAM
Oracle does a good job of automatically managing the use of memory, but you can sometimes improve speed if you increase RAM rather than using disk access, which is slower. Specific areas to look at include:
- shared_pool_size
- db_cache_size
- aggregate_target
If these don’t have enough RAM, the database is reduced to the speed of the physical I/O, which will slow things down.
Average Buffer Pool I/O Response
Many software applications are limited by the I/O of the disk, and if the database disk is at capacity, users will experience slow performance due to bottlenecks in responses. Tuning the I/O will help with this; a good goal for the average buffer pool read/write time is 10 milliseconds.
Parse to Execute Ratio
SQL statements need to be parsed when they’re first run, which includes the following:
- Syntax check
- Semantic check
- Decision tree
- Execution plan
After the initial run, execution plans are retained in the library cache and referenced the next time the statement is run, helping to ensure it runs efficiently.
This type of parse on the initial run is called a hard parse. A soft parse occurs when only the variables of an SQL statement are parsed. It’s helpful to reduce both types, but reducing hard parses is particularly important, since they’re the most expensive.
If you see problems with the parse to execute ratio, it could be because the database isn’t effectively using cursor sharing. To improve the ratio, you can increase the session cache cursors. You’ll likely get the best performance with settings between 100 and 1000.
Transaction Log Response Time
Log response times impact latency in transactions, which in turn can be a significant problem, especially with critical transactions. Improving the log response can improve the latency issues; a good response time to aim for is 10 milliseconds.
Rows Read/Row Selected Ratio
This ratio indicates how many database rows were read before getting a return for the specified rows. A ratio higher than 20 is a problem and could indicate an issue with indexes. You can also explore further to look at situations where there are more rows than the number of total executions.

Oracle Performance Monitoring Tools
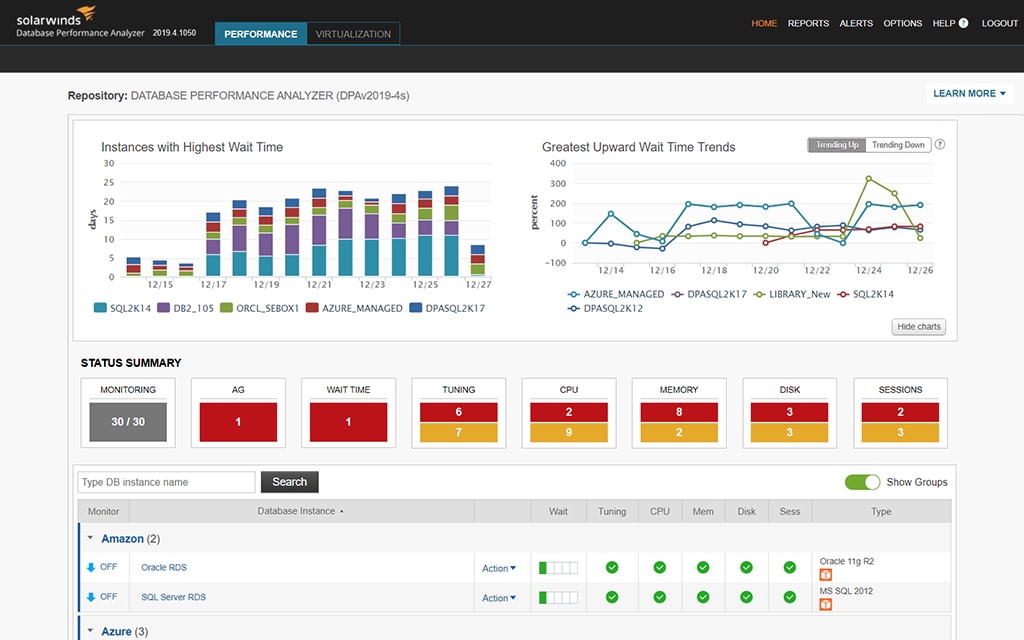
As important as it is to monitor and tune performance, you need the right solution to help you do it. You have many tools to choose from for performance monitoring and using the right one will save you significant time and effort. While there are a range of tools on the market for Oracle performance monitoring, my favorite is SolarWinds Database Performance Analyzer.
When looking for a solution, you want to make sure it has the best functionality to support your needs. The most obvious requirement is for it to be able to continually monitor your Oracle database, but you shouldn’t stop there. When you get into the nuances of effective performance monitoring, the tools really begin to distinguish themselves.
Monitoring is only useful if the information is presented in an easy-to-read way, which means looking for a solution that compiles and correlates the information for reviews at a glance. This should include the ability to drill down into details, so you can identify the root cause of any problems. SolarWinds DPA comes with a clear, intuitive interface designed to help you get to the root of performance issues with ease. You can easily gain a bird’s-eye view of collected data on a single screen, and then click on the displayed information to go into greater detail. DPA also lets you create custom charts to help you visualize data and make sense of it.
These simplified views aren’t just beneficial because they help to clarify information no matter your level of expertise; they also offer another benefit by keeping everyone on the same page. Developers, DBAs, and those in operations can all access the performance information and understand how it impacts them.
Reports are also an important feature to look for, as are anomaly detection and alerts. With DPA, you’ll be alerted as soon as a performance issue requiring your attention is detected. Comprehensive, intelligent alerting means you’ll be kept informed without getting overwhelmed with alerts you don’t need. Though there are built-in alerts, you can customize your own too. And with detailed reporting, DPA makes it easy to share the performance story with anyone involved in the Oracle performance monitoring process.
A good tool goes beyond monitoring and will offer solutions to issues when they arise. This includes suggestions for tuning SQL statements as well as general tuning support for Oracle and more. SolarWinds DPA is designed to go beyond simply identifying performance issues by providing the actionable insights you need to rectify those issues. It identifies bottlenecks quickly, pinpointing their root causes and prioritizing the actions needed to address them. Further, it uses wait-time analysis to determine the true root causes of your Oracle performance issues.
Finally, DPA offers you insights to optimize your Oracle database even without problems arising. It identifies the most inefficient workloads and impactful queries, so you’re better equipped to optimize the database. It comes with a 14-day free trial.
Improve Oracle Database Slow Performance With Performance Tuning
A slow database causes problems for everyone, so it’s important to monitor Oracle database performance metrics and tune your databases as needed.
Just as important, though, is having the right solution to assist with those activities. SolarWinds Database Performance Analyzer is my recommended option, providing much more than monitoring. It also includes analysis, reports, alerts, and suggestions for performance improvements, all presented in a way that makes it easy for teams to collaborate and stay on the same page.
For many companies, Oracle databases are the foundation of their work, and keeping those databases running smoothly is one of the best things you can do for your business.